Introduction
Forest monitoring systems at a country national scale are fundamental tools for land management and the mitigation of climate change impacts and land use intensification1. Information on spatial extent and productivity of forests feed global databases and are highly valuable when participating in international initiatives such as REDD+ or the Montreal Protocol2. In addition to their central role in reducing carbon emissions3, forests are one of the most biodiverse terrestrial ecosystems4 and provide multiple ecosystem services, including the control of floods and diseases, they provide timber and non-wood forest products, and offer a myriad of recreational activities5)(6. The quantification of ecosystem services, the evaluation of forest conservation status and the elaboration of management plans depend in part on the quality of data on the spatial distribution of forests, and their availability to the institutions responsible for forest management. Efforts to map forests have increased in recent decades7)(8)(9, mostly focusing on monitoring trends in forest distribution associated with global change10.
Estimating forest area via tree canopy coverage has become one of the main ecological indicators incorporated into forest inventories11)(12. Tree canopy cover is defined as the proportion of the ground covered by the vertical projection of tree crowns13, and it constitutes one of the main structural characteristics of forests, being fundamental for the maintenance of biodiversity and the continuity of ecosystem services14. Tree canopies constitute much of the habitat for flora and fauna associated with forests, they participate in the hydrological cycle through evapotranspiration and rainfall interception and have an important role in climate regulation15. Additionally, in savanna ecosystems, tree canopy cover is also a key player in cycling soil C and N, as well as in fire dynamics16)(17. Likewise, canopy density is strongly linked to carbon reserves in forests and savannas18)(19. Multiple tools have been developed to measure tree canopy cover in the field and, more recently, remote sensing with satellites imagery or LIDAR has become widespread as one of the main techniques for estimating canopy cover at broader scales20)(21.
The need to develop strategies for climate change adaptation and mitigation has promoted the development of monitoring systems to evaluate rates of primary productivity and net carbon storage at country level18. Among the most commonly used indicators for monitoring primary productivity, the Normalized Difference Vegetation Index (ndvi) is derived from red and near infrared bands from satellite imagery22)(23)(24. The utility of the ndvi as an indicator of primary productivity is limited in forests with high canopy density due to saturation25, but it is widely used for the monitoring of forests, savannas and grasslands in southern South America and African savannas26)(27)(28.
In Uruguay, native forests occupy approximately 4.5 % of the land surface area29)(30, a value that varies depending on the estimation method and the scale of analysis used31. According to our knowledge, there is only one study addressing the temporal changes in the spatial extent of native forests countrywide32. An upward trend in the area covered by native forest for the period 1980-2006 was recently reported for Uruguay33. Meanwhile, the General Agricultural Censuses indicate a decrease in forest cover for the period 2000-201134)(35. Other studies at a smaller scale have reported a decrease in native forest area as a result of anthropogenic activities, particularly those pertaining agriculture expansion and tree plantations36)(37. Along these lines, quantifying the recent change in native forest area is one of the objectives of the redd + Project in Uruguay, initiated in 2016.
In order to further contribute to the monitoring of Uruguayan native forests, the objectives of this study are: (1) to generate an updated coverage of the spatial distribution of the hillside and ravine forests in Uruguay (locally referred as monte serrano and monte de quebrada respectively, from now hrf); (2) to quantify the canopy cover of the hrf, and (3) to evaluate the relationship between canopy cover and ndvi in the hrf. To achieve these goals, a series of Geographic Information System (gis) tools and satellite images were used at different spatial resolutions to obtain data of the forests area, ndvi and the degree of coverage in the hrf of Uruguay.
Materials and Methods
Forest cover classes
To generate the hrf land cover class, henceforth referred to as the «hrf-2015 layer», we used three spatial datasets: 1) Landsat 8 images (resolution: 30x30 m), consisting on the Operational Land Imager (oli) and the Thermal Infrared Sensor (tirs), mainly from the austral-summer months (Dec-Feb) of 2014/2015, 2) high resolution images from the summer 201538, and 3) the official hillside forest layer of 2008 from the Uruguayan Land Cover Classification System31.
Landsat 8 images were downloaded from the United States Geological Survey portal39. A set of thirteen images, which together covered the entire land surface of Uruguay, were joined in a mosaic image, which was integrated into a raster and served as the basis for limiting the spatial extent of the analysis to the national boundaries of Uruguay. This national boundary was defined by a vector layer of «terrestrial boundaries» elaborated by the Uruguayan military geographical service. Radiometric correction of Landsat images was deemed unnecessary for several reasons. First, forest patches were strictly identified by visual interpretation of the Landsat images (cross-checking with Google Earth high-resolution images). Second, all Landsat images were obtained from the austral summer months (Dec-Mar) of 2014/2015, which correspond with the growing season for most woody species in the region. Finally, the hrf is dominated by evergreen trees40, that are photosynthetically active throughout most of the year. To reduce the influence of cloud cover, images with a cloud cover of less than 10% were selected for analysis.
Given the patchiness of forest ecosystems and their relatively small size, we used high-resolution images from Google Earth38 from the summer 2015 -viewed at a scale of 1:7000-, as well as Landsat images to delineate polygons based on the presence of forest patches within each polygon.
As a third source of spatial information, we also used an official Land Cover layer from 2008 as a guide for the delineation of hrf patches. This layer of native forest in 2008 was obtained from the land cover classification of Uruguay developed among multiple institutions in 200831, henceforth referred to as «lcc-2008». In the lcc-2008, natural and anthropogenic uses were classified based on Landsat 5 tm images (30x30 m) from 2007 and 2008 (scale 1:100,000). We isolated the hrf class, and superimposed the lcc-2008 layer over the 2014/2015 Landsat 8 satellite images in ArcMap 10.1, working at a 1:30,000 scale.
The 2015-hrf layer was delineated by hand using tools from the editor toolbar in ArcMap 10.1. In most cases the polygons of the lcc-2008 layer were removed and re-digitized to conform to the shape of forest patches in Landsat 8 images, checking for the presence of forest patches in Google Earth. Given the distinctive nature of the hrf patches (compared to the surrounding vegetation) they were easily identified. Although the reflectance of native forests was similar to those of tree plantations, they can be distinguished by their shape, since tree plantation have geometric spatial patterns. Once this process was completed, a corrected cover of 2015 was obtained, which included the following forest formations recognized in Uruguay: hillside, ravine, escarpment and rocky soils forest, in Spanish: serrano, quebrada, escarpas and mares de piedra41. This new layer was ground-truthed using the locations of plots categorized in the field as hillside and ravine forests (N = 152 plots) in the National Forest Inventory (ifn). The 2015-hrf layer was again revised and corrected to include those IFN plots excluded by the layer, thus reducing omission errors.
Differences in ndvi and canopy cover within the hillside forest cover class
Uruguay ndvi data at a spatial resolution of 1 km2 was obtained from the SPOT 4 & 5 vegetation (vgt-S10) product available on the vito platform42, and previously processed by Ceroni, Achkar, Gazzano & Burgueño24. The index was calculated as: ndvi = (rnir-rred) / (rnir + rred), where rnir was near infrared (nir) reflectance and rred was red reflectance. During the period of April 1998 -March 2012, VGT-S10 products provided 10-day composite ndvi images, applying the maximum-value-composite (mvc) technique to select the «best» ground reflectance values from daily ndvi. Composite data are then post-processed, which includes the incorporation of flags for bad data, clouds, and a land mask to reduce the influence of atmospheric conditions; flag data was obtained from the Status Map layer in the S10 product catalogue42. Further details regarding the processing of ndvi data at the national scale are described in Ceroni, Achkar, Gazzano & Burgueño24.
To select the ndvi data corresponding to hrf, an intersection of the national-scale ndvi pixel layer from spot imagery was made with the hrf-2015 layer. We obtained a total of 439 hrf pixels; those pixels with >90 % of hrf cover were defined as «pure pixels»28. This monthly ndvi time series reflects the behavior of ndvi in areas that are dominated by native forest and have minimal influence from other land cover classes such as tree plantations, bare soil or grasslands. Tree plantations are excluded from this analysis, whereas in previous studies ndvi of native forest and tree plantations are considered as a single class43. Based on this time series data of 168 months, we calculated the annual mean, minimum and maximum ndvi for all hillside pixels.
Finally, to evaluate the relationship between tree canopy cover and ndvi, each of the 439 pixels were assigned to one of the following canopy cover categories: 0-24 %, 25-49 %, 50-74 % and 75-100 % (Figure 1)28. Tree cover class was estimated visually for each pixel, using the tool «create network» to create a grid with cells of 250 x 250 m, which was superimposed with the hillside forest pixels over high resolution esri built-in Basemap Layer «World Imagery» in ArcMap 10.01 at a scale of 1:20,000. As this Basemap Layer includes high-resolution imagery GeoEye ikonos (1m resolution) for most of Uruguay, individual trees were easily visible to visually classify tree cover28. To compare the differences in ndvi between the four tree coverage categories, generalized linear models and the Tukey hsd post-test were used. All analyses were conducted with the software R 3.0.344.
Results
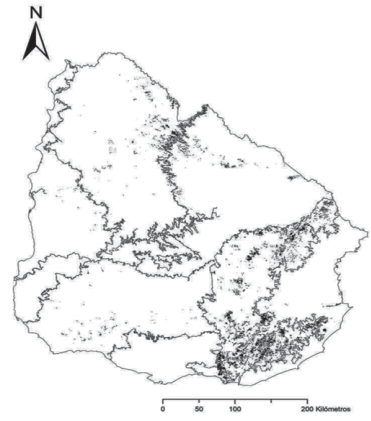
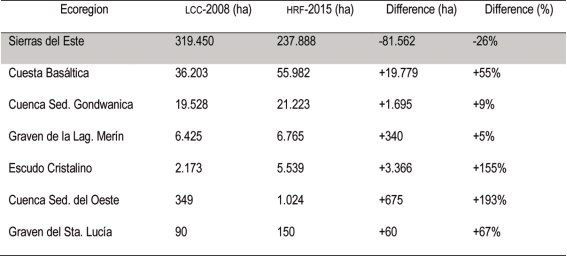
The hrf were highly patchy in the Uruguayan landscape, consisting of 4226 polygons with an average area of 45 ha and a median of 24 ha in 2015. We created an updated layer for hrf in Uruguay in 2015, covering a total area of 334,487 ha (1.9 % of the terrestrial surface area of Uruguay; Figure 2). This area was less than the 384,240 ha (2.1 % of Uruguayan territory) as registered in the national land cover class product «lcc-2008»). Using the lcc-2008 layer as a baseline for forest cover, we excluded the area originally categorized as hillside forest, that were subsequently reclassified in 2015 as grasslands and afforestation. The 13 % decline (49,754 ha) in the estimated hillside forest area from 2008 to 2015 was largely due to the elimination of hillside grasslands classified as native forest in the lcc-2008 layer. These potential errors in forest classification based on Landsat 5 images in 2007-2008 increased at regional spatial scales, for example, by eco-region or by department (e.g.: we found that hillside forest cover was overestimated by 27 % in the ecoregion Sierras del Este, while hillside forest cover was underestimated by 34 % in the basaltic soil ecoregion of northern Uruguay; Table 1).

Figure 2: Map of the updated total surface area of hillside and ravine forests in Uruguay (hsr-2015) showing terrestrial ecoregions of Uruguay45.

Table 1: Total surface area of hillside and ravine forest in Uruguay by Ecoregion (Fig. 1a) according to the official forest cover classification, lcc-2008, the updated hrf-2015 cover class generated here, and the net difference in area between these two cover classes. Declines in total hrf area are shaded in grey. Ecoregions proposed by Brazeiro and others45.
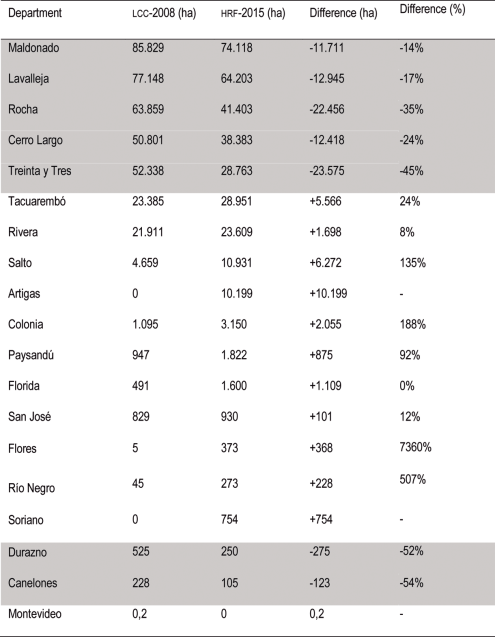
According to the eco-regions of Uruguay45, 75 % of the surface area of hrf were distributed in the eco-region «Sierras del Este», followed by 15 % in the northern eco-region Cuesta basáltica (Figure 2). The departments with the largest forest area were: Maldonado, Lavalleja and Rocha (Table 2).

Table 2: National extent of hillside and ravine forest by administrative divisions (Department, Fig. 1b), according to the official forest cover class lcc-2008, the updated hrf-2015 cover class generated here, and the differences between them. Declines in total hrf area are shaded in grey.
The discrepancy between the spatial extent of the hillside and ravine forest layers of 2008 and 2015 was also reflected in the difference between tree canopy cover for these two years (see Figure 2 as an example). In 2008, hillside and ravine forest 1 km2 pixels had an average canopy cover of 55 ± 25 %, with only 11 % of the pixels in the highest canopy cover class of 76-100 %. In the updated forest layer presented here, the average canopy coverage among pure forest pixels was 69 ± 23 %, with 17 % of pixels displaying 75-100 % tree cover. In this sense, the 2015 layer is more representative of dense forest than the 2008 classification of native hillside forests, due to the inclusion of previously omitted forested areas with high tree cover, as well as the exclusion of areas with scarce tree cover (0-25 %) that corresponded to other land cover classes, mainly hillside grasslands. Nonetheless, hrf remained patchy, with 44% of forest pixels in the 2015 cover class displaying a tree canopy cover less than 50 %.
During the study period, hrf pixels with more than 50% tree cover (N = 194 1 km2 spot pixels) had an overall average ndvi of 0.70 ± 0.03, varying seasonally between an average of 0.74 ± 0.03 in autumn (maximum greenness) and 0.67 ± 0.04 in winter (minimum greenness). For this same subgroup of pixels, mean ndvi in summer and spring were 0.70 ± 0.04 and 0.71 ± 0.03, respectively. The average maximum ndvi -averaged over the 14-year period for each individual pixel- occurred in May for 44% of pixels and in April for 29 % of the pixels. The average minimum ndvi -averaged over the 14-year period for each individual pixel- was largely expressed in August among 52 % of pixels and in September for 23 % of pixels.
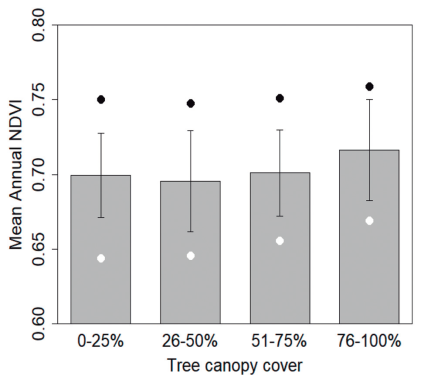
Heterogeneity in forest density, measured as canopy cover, was reflected in differences in forest ndvi at the 1 km2 scale. There was an increase in ndvi with an increase in tree canopy cover (Figure 3). Pixels with less than 25 % tree cover had an average ndvi of 0.69 (± 0.03), while those with 100% cover had an average ndvi of 0.72 (± 0.03). The analyses showed significant differences in the average ndvi between the maximum canopy cover category (>75 %) and the two lowest cover categories (<25 % and <50 %; Tukey hsd, p <0.001). Significant differences in minimum ndvi (average of the annual minimum) were also observed among categories, except between the intermediate coverage categories (25-49 %and 50-75 %; Tukey hsd, p <0.01). Alternatively, the maximum values of ndvi were very similar regardless the canopy cover (Tukey hsd, p> 0.05, with the exception of the significant difference in ndvi between 25-49 % and 76-100 %, p <0.05).
Discussion
National estimates of total forest area are essential for participation in global initiatives for biodiversity conservation and carbon mitigation46. In response to the need to evaluate different methods for forest monitoring via remote sensing, this study highlights that the effective area of native forest depends upon the definition of «forest», and the spatial resolution of the images used for forest cover estimation. Specific concern arose regarding the classification of terrestrial land with less than 25 % tree canopy cover as native forest. Moreover, an adequate method for monitoring forest expansion or deforestation in areas with low tree density is clearly needed. In this regard, this study contributes to a broader discussion about the most efficient and accurate way to estimate the forest surface area in patchy landscapes or savanna biomes, highlighting the difficulties of exclusively using Landsat images (resolution 30x30 m) to quantify national forest cover. We demonstrate that the complementary use of satellite (Landsat) and high-resolution images (Google Earth) with field sampling data (nfi) is a useful strategy to achieve a more accurate delimitation of native forests in Uruguay, particularly in the case of «patchy ecosystems» such as hrf.
Hillside and ravine forest: delimitation, canopy cover and ndvi
A key aspect in determining the spatial distribution of forests in Uruguay is establishing an operational definition of forests. In the delimitation of forests with satellite images, it is useful to establish a minimum canopy cover -at a defined spatial scale-, both to determine forest area as well as to monitor areas of expansion or degradation47)(48. According to the Native Forest Registry of the General Forest Directorate in Uruguay: «Any forested area with a density greater than 200 trees/ha with a canopy cover of 50% is considered as forest»49. Nonetheless, we identified the inclusion of grasslands in the hillside forest cover class in the national land cover classification product lcc-2008 as the main source of error in the estimation of surface area. Through the classification of forest pixels by canopy cover here, we detected that 12 % of pixels had a tree cover of less than 25 % forest in 2015 (e.g.: see Figure 1). These pixels have ndvi values similar to those of pasture and livestock production systems28)(43.
The hrf of Uruguay are naturally patchy within the Uruguayan landscape, and they can be further fragmented by both historical and more recent anthropogenic activities40)(50. These forest patches are located within a transition zone between forest and grassland51, where it can be said that grasslands and forests are alternative states, where the prevalence of one environment or the other depends on complex interactions between climate, fire and land-use activities, especially livestock grazing52)(53)(54.
Our study reaffirms the fragmented and heterogeneous nature of hrf, where about half of the forest pixels analyzed had a tree canopy cover of less than 50 %. This implies that an important area of this ecosystem designated as «forest» strictly corresponds to other land cover classes, such as grasslands and rocks. In fact, a recent study reveals the intimate association between these environments, and provides evidence that the expansion of hillside forests into the surrounding grassland matrix occurs through the nucleation processes around rocks and woody nurseries54. Heterogeneity and the land cover mosaic could influence the function of these forest ecosystems, reflected by the lower ndvi values in areas with lower tree canopy cover. The complexity to quantify wooded areas in heterogeneous landscapes was also observed in African savannas19)(55. Among other tools, the use of high-resolution images and vegetation indices such as ndvi to differentiate woodland types is highlighted19.
Error in the quantification of forest extent
One of the central aspects of forest mapping is obtaining a cover class with a high degree of precision, which allows for the temporal monitoring of deforestation and carbon stocks in native forests18)(56)(57. This is one of the great challenges Uruguay faces to sustain a monitoring program of native forests over time.
Regarding the potential sources of error in estimating cover of native forest in the country, we observed that the 2015 forest cover generated here estimated the hrf area as 19 % and 27 % smaller, relative to this same category in the official layers of Land Cover for 2008 (lcc-2008) and 2011 (lcc-2011) respectively31. These differences are likely due to the images used for analysis (Landsat 5 tm vs. Landsat 8), the methodology used for the classification of forest cover (segmentation vs. visual interpretation and digitization31), and the change in scale of analysis from 1:100,000 to 1:30,000, which allowed for a more precise delimitation of the forests. It should be mentioned that, beyond the apparent decrease in the total area of mapped forests at a national scale, northern and western Uruguay showed a regional increase in hillside forest area associated with a greater inclusion of forest. These adjustments are of vital importance for the monitoring and detection of threats to this type of forest, especially under future scenarios of accelerated changes in land use58.
The overestimation of the hillside forest area by the inclusion of surrounding grasslands and the underestimation of the surface of ravine forests highlights the question of how much error is permissible in the quantification of forest area in Uruguay. If we consider a maximum error of 5 to 10 %59, other indicators of degradation and deforestation such as ndvi60 would have to be considered in order to evaluate the status of native forests.
Given the application of ndvi, among other indices, to monitor vegetation in Uruguay61)(62 it is important to recognize the factors that influence spatial variability within the «native forest» cover class. In addition to the differences identified in the ndvi among native forest types in Uruguay28, we show here that an increase in tree density within the hrf cover class was associated with higher ndvi values. As ndvi correlates with Leaf Area Index, the increase in ndvi may be the product of an increase in leaf area (or photosynthetic tissue). Similarly, in savanna landscapes of Central Africa where tree density varies from 3% to >18%, ndvi has also been identified as a good indicator of tree cover19. This work highlights the heterogeneity that a single forest cover class can have not only in structure, but in function, such as in carbon sequestration and preventing soil erosion.
Recommendations for future research
We propose the following recommendations for the delimitation of native forests in general:
In this way, efficient national scale monitoring uses methods such as Landsat image analysis to facilitate comparison with global figures of forest extent. A representative fine-scale sub-sampling could be useful to corroborate trends in deforestation and forest expansion, and maintain a system for checking potential errors in national figures.
Conclusions
Currently, there is a nationwide discussion regarding the extent and trends of native forests in Uruguay, but with limited efforts to assess the appropriate methods and scales for long-term monitoring of this critical ecosystem. The patched nature of hrf, and their close interaction with grassland and scrubland environments, as well as tree plantations, make the precise delimitation of this land cover class problematic. This difficulty in establishing borders for ecosystems in transition with other land cover classes leads to errors in estimating the total cover of national native forest. Although moderate-scale national land cover classification products are valuable and widely used for both research and decision-making, in the case of spatially restricted ecosystems, a finer scale approach could detect spatiotemporal changes in their cover and function within acceptable ranges of certainty. Such is the case for native forests63, as well as highly threatened palm groves64)(65, biodiverse wetlands and other critical ecosystems that have relatively small areas within Uruguay. In order to capture forest expansion and/or degradation of hrf, we suggest that broad-scale satellite monitoring be complemented by high-resolution images, tree canopy cover indicators and fine-scale monitoring of specific patches representative of each ecoregion. These practices will ultimately contribute towards the monitoring, conservation and management of this ecosystem.


