Figure 1. Components of a Signaling Pathway (Image extracted from [23]).
Carlos R. Rangel and Junior Altamiranda
Universidad de Los Andes, Centro de Estudios en Microcomputación y Sistemas Distribuidos
(CEMISID), Mérida, Venezuela, 5101
and
]]>Jose Aguilar
Universidad de Los Andes, Centro de Estudios en Microcomputación y Sistemas Distribuidos
(CEMISID), Mérida, Venezuela, 5101
Prometeo Researcher, Universidad Técnica Particular Loja, Ecuador,
Abstract
In this paper we use concepts from graph theory and cellular biology represented as ontologies, to carry out semantic mining tasks on signaling pathway networks. Specifically, the paper describes the semantic enrichment of signaling pathway networks. A cell signaling network describes the basic cellular activities and their interactions. The main contribution of this paper is in the signaling pathway research area, it proposes a new technique to analyze and understand how changes in these networks may affect the transmission and flow of information, which produce diseases such as cancer and diabetes. Our approach is based on three concepts from graph theory (modularity, clustering and centrality) frequently used on social networks analysis. Our approach consists into two phases: the first uses the graph theory concepts to determine the cellular groups in the network, which we will call them communities; the second uses ontologies for the semantic enrichment of the cellular communities. The measures used from the graph theory allow us to determine the set of cells that are close (for example, in a disease), and the main cells in each community. We analyze our approach in two cases: TGF-β and the Alzheimer Disease.
Abstract in Spanish
]]> En este trabajo se utilizan los conceptos de la teoría de grafos y la biología celular representado como ontologías, para llevar a cabo tareas de minería semántica en las redes de vías de comunicación celular. En concreto, el documento describe el enriquecimiento semántico de las redes vía de comunicación celular. Una red de vía de comunicación celular describe las actividades celulares básicas y sus interacciones. La principal contribución de este trabajo es en el área de la investigación de vías de comunicación celular, se propone una nueva técnica para analizar y entender cómo los cambios en estas redes pueden afectar a la transmisión y circulación de la información, que producen enfermedades como el cáncer y la diabetes. Nuestro enfoque se basa en tres conceptos de la teoría de grafos (modularidad, clustering y de centralidad) que se utilizan con frecuencia en el análisis de redes sociales. Nuestro enfoque consiste en dos fases: la primera utiliza los conceptos de la teoría de grafos para determinar los grupos celulares en la red, lo que les llamaremos comunidades; la segunda utiliza ontologías para el enriquecimiento semántico de las comunidades celulares. Las medidas utilizadas en la teoría de grafos nos permiten determinar el conjunto de células que están cerca (por ejemplo, en una enfermedad), y las principales células en cada comunidad. Analizamos nuestro enfoque en dos casos: el TGF-ß y la Enfermedad de Alzheimer.Received: 2015-10-31 Revised 2016-06-30 Accepted 2016-07-28
DOI: http://dx.doi.org/10.19153/cleiej.19.2.6
1. Introduction
Nowadays, there is a lot of biological knowledge embodied in information technology in different ways: in databases, ontologies, among others. A major challenge is to gather the scattered information from different sources, in order to help biologists to understand the behavior, for example, of the human body. An example of biological knowledge in information technology is the Gene Ontology (GO) [1], which is an ontological framework in biology that describes genes in terms of their molecular functions, associated biological processes, and cellular components, in an independent manner.
On the other hand, currently lot of biological networks are being extensively studied, such as the protein-protein interaction networks [2], the gene regulatory networks [3] and the metabolic networks [4]. Recent studies show that biological networks are dynamic; they reconfigure (appearance or disappearance of links) in response to different external signals. There are many examples showing the same list of genes with different forms of interactions in different conditions, which leads to different meanings or biological functions.
A cell signaling network is a type of biological network that describes the cellular activities and coordination among them, as response to their microenvironment. Particularly, the nodes describe the genes and the arcs the interaction among them. The genes have specific interactions according to their temporary functions, and can change their functions according to their interactions with different neighbors [5]. This implies that the functional analysis of genes regardless of their interactions, is not correct. Therefore, the cell signaling networks describe the genes considering at the same time their molecular functions and their interactions [6, 7, 8].
Cell signaling networks are studied in the context of human diseases, because they can help to treat them effectively. A signaling pathway describes a group of molecules in a cell. When the first molecule on a pathway receives a signal, it activates another molecule. This process is repeated until the last molecule is activated, and the cell function is performed. The abnormal activation of signaling pathways can lead to diseases such as cancer.
In general, gene networks in healthy people have the same list of genes that in sick people, but the connections are different, and therefore have different phenotypes. The functional analysis of these networks goes beyond from the capacities of current analysis tools, which consider only the genes individually, without the study of the link information. Thus, there is a great need to develop new methods of analysis for biological networks, which fully exploit the network topological information. In such networks, it is crucial to discover communities of genes (dense clusters) present at a given time. This problem is typical in the context of a large number of applications, such as social networks [9]. A number of techniques have been designed in the literature for the determination of dense clusters [10,11,12,13].
In this paper is proposed the detection of gene clusters, taking into account the topological structure of the network in the signaling pathway. The gene clusters are characterized using measures of graph theory, such as centrality and modularity. When this characterization of the clusters is carried out, our approach continues with a semantically enrichment using the GO. The main contribution of this paper is the application of graph theory and ontology mining into traditional biology, which normally is focused on studying individual parts of cell signaling pathways.
]]> Our proposal is tested in two signaling pathway networks: in the TGF-β and in Alzheimer's disease. TGF-β is a protein that controls cell proliferation and differentiation, which is also substantially involved in immunity and cancer. TGF-β signaling pathway modulates processes such as cell invasion, immune regulation, and microenvironment modification that cancer cells may exploit to their advantage. Alzheimer's disease (AD) is a chronic disorder that slowly destroys brain cells and causes severe cognitive disabilities. The study of the AD signaling pathway allows, among other things, analyze how the disease affects the cell functions.This article has five sections. The first section is the introduction; the second section shows related works; the third section presents the theoretical basis of our proposal; the next section explains our approach. The fifth section presents two cases studies. Finally, the last section presents the conclusions.
2. Related Work
Some work related to semantic enrichment area of genes networks are described below. In recent years, have been designed experimental techniques to detect cellular molecules, such as microarray, RNA-Seq and mass spectrometry. To make biological interpretation of them, is used commonly genes grouping based on their similarities [14]. In particular, to determine the shared functions (functional similarity) between genes, one way is to incorporate biological knowledge, using knowledge bases as Gene Ontology (GO) and Kyoto Encyclopaedia of Genes and Genomes (KEGG) [1,15]. In this way, we can determine the prevailing biological subjects into a collection of genes, and compare biological themes among groups of genes. Basically, that is what is proposed in [14], with the "ClusterProfiler" tool, a tool to compare and visualize the functional profiles between groups of genes.
Moreover, [16] proposes a method for analyzing protein-protein interactions (PPI). The purpose of this method is to detect molecular interactions that might be common manifestations of Colorectal Cancer (CRC). The method described in [16], consists in the construction of a network using a set of databases publicly available of proteins, based on the utilization of mining applications. The network is characterized by its centrality values, to determine the regions of interest containing the main similarities between proteins. They find similar regions in the networks of CRC, to help to understand the molecular mechanisms of the disease [17].
On the other hand, NOA (Network Ontology Analysis) has been proposed as a resource for semantic enrichment of signaling pathway networks [18]. NOA is an ontology of biological links, which assigns functions to the interactions based on the annotation of known genes. NOA can capture the changes of the biological functions, by the change in the links of the networks of interactions of the proteins, something not possible with other techniques of analysis [18].
CePa is a R package in order to find important pathways through the network topology [19]. The package has several advantages. First, it defines the node pathway rather than defining only the gene, this is taken as the basic unit of a more complex system of genes. Second, multiple network centrality measures are applied simultaneously, to calculate the importance of the nodes based on different aspects, to have a complete view of the biological system [19].
Cytoscape and PSIQUIC are two tools for analyzing the interactome (protein-protein interactions taking place in a cell) [20]. These tools use multiple repositories of protein interactions at the same time, and find topological groups within them. In addition, these groups are semantically enriched using GO [1,20].
With respect to the previous works, our proposal differs in that it is based on the structure of the generated graph of the signaling pathway, uses techniques of Social Network Analysis (SNA), specifically techniques based on graph theory for the detection of clusters (known as SNA communities) and genes more significant, and ontological mining techniques for the semantic enrichment of the clusters.
3. Theory
]]> 3.1 Signaling Pathway NetworksSignaling networks are a type of biological network, which describe the system of communication that defines the cellular activities and the interactions among them. The signaling pathway networks are complex systems, and may exhibit a number of emergent properties. The signaling networks normally integrate protein-protein interaction networks with the cellular functions.
3.1.1General characteristics
The activation of a pathway is a response to an external stimulus. For example, a cell A can activate a cell surface receptor that is part of a channel to get to B. The binding between A and B may contain other cells, and the stimulus that activates A opens a series of chain of activations until B. The activated receptor must first interact with other proteins inside the cell, before the ultimate physiological effect on the cell's behavior is produced. Often, the behavior of a chain of several interacting cell proteins is altered after a receptor activation. The entire set of cell changes induced by the receptor activation is called a signal transduction mechanism or pathway [21,22].
Cell signaling research involves studying the spatial and temporal dynamics of both, receptors and components of signaling pathways that are activated by receptors [21]. Cell signaling networks have been extensively studied in the context of human diseases. They help to understand the transmission and flow of cellular information. Errors in cellular information processing are responsible for diseases such as auto-immunity, diabetes and cancer.
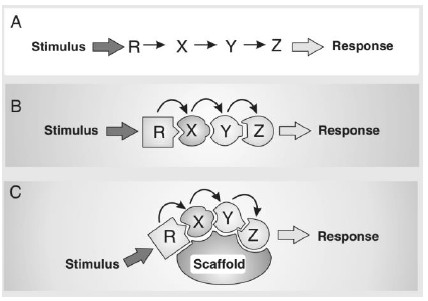
3.1.2 Components
The signaling components are: stimulus, receptor and the response, as is shown in fig 1.A. In some cases, between the receptor and the response, there are proteins and the information transmitted through the protein–protein interactions (see fig.1.B). In some protein–protein interactions, there is a variety of scaffolds functional to hold together the individual components of signaling pathways, in order to create macromolecular signaling complexes (see Fig. 1.C) [23].
Figure 1. Components of a Signaling Pathway (Image extracted from [23]).
3.2 Graph Theory
]]> One of the major problems of modern biology is the discovery of knowledge in large databases. The pathway networks and metabolic networks usually can be modelled as directed graphs. In a Signaling Pathway Network, the nodes represent cells, with arcs denoting the interactions between them. This is a directed graph because, if cell A regulates cell B, then there is a natural direction in the arc between the corresponding nodes, starting at A and finishing at B [24]. The interest of the graph theory in this work is because it allows describing graphs from two points of view: What are the communities of nodes in the graph? and, What are the basic characteristic of each community?.At the following, we present the main concepts used in this work, in order to extract information from the Signaling Pathway Networks.
3.2.1 Modularity
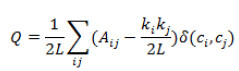
Modularity is a measure of the network structure. It is designed to measure the strength of the division of a network into modules (also called groups or communities). Networks with high modularity have strong connections between nodes within modules, but few connections between nodes in different modules. Modularity is used to detect the communities’ structure in networks. The modularity measure used in our work is [25]:
 (1)
(1)
Where, L is the number of links in the network, Aij is the adjacency matrix, ki is the degree of node i, and δ(ci,cj) equals 1 if the two nodes belong to the same community.
This measure is interesting in our work, because the concept of modularity in cell signaling pathways assumes that cellular functionality can be seamlessly partitioned into a collection of modules. Each module is a discrete entity of several elementary components, and performs an identifiable task, different from the functions of the other modules. The identification of this task is very important for the biologist. For example, the detection of the modules or groups, and their semantic enrichment, allows defining the function of this group, for instance, in a disease [26].
3.2.2 Centrality
In graph theory and SNA, the centrality refers to a measure of a node in a graph that determines its relative importance within the graph [27]. The centrality of a node can help determining, for example, the impact of a gene involved in a series of reactions in a signaling pathway network. Several metrics of centrality are used in this work:
The degree centrality: it is the simplest measure of centrality. It is the number of links of a node [28]. This can be divided into the centrality of the input degree and the centrality of the output degree, for directed graphs. This can be divided into the centrality of the input degree and the centrality of the output degree, for directed graphs. An example of this measure, for a given directed graph G=(V,E), of the centrality of the output degree of a node Vi is:
 (2)
(2)
where, n is the number of nodes in the network.
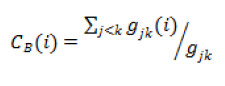
The betweenness centrality: it is a measure that quantifies the frequency or number of times a node acts as a bridge along the shortest path between two nodes [28]. It is important because it determines the critical nodes in the spread of a disease or opinion in SNA. The betweenness of a vertex ci in a graph G:=(V,E) is:
 (3)
(3)
where gjk is the number of short paths connecting nodes j and k, and gjk(i) is the number of short paths connecting nodes j and k in which ith node is.
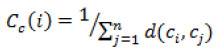
The closeness centrality: it is based on the idea “an important node is close to, and can communicate quickly with, the rest of nodes in the graph”. It is a distance metric between all pairs of nodes with the node studied, defined by the length of its shortest paths. It is defined by [29]:
 (4)
(4)
where d(ci,cj) is the shortest path between nodes ci and cj.
We use these measures of centrality to filter the most important nodes in each module/group/cluster. Other measures of centrality, which we do not use in this work, are [28]: eigenvector centrality, Katz centrality, PageRank, among others. Each one can be used to determine specific aspects of the nodes in a graph.
3.3 Mining Techniques
In this work we use several types of mining techniques, which are presented in the next sections.
3.3.1 Semantic Mining and Ontological Mining
The semantic mining is responsible for extracting semantic knowledge from different semantic sources, such as web pages, annotated graphs, and ontologies, among others. The semantic mining is divided into three groups [30,31]: semantic data mining, web mining and ontological mining. The latter is the most interesting for this work. The Ontological Mining (OM) allows extracting knowledge from a set of ontologies [37]. Some of the OM techniques that have been developed are:
The alignment of ontologies analyses the correspondence between the concepts of two or more ontologies [30,32]. The alignment process is defined by the tuple:
A = (O1, O2, p, f)
Where O1 and O2 are the ontologies to be aligned, p is the set of requirements (ontology language (i.e. OWL), the concepts vocabulary, among others), and f is the function of alignment (f is normally a similarity function to correlate the concepts). The set A symbolizes all the semantic correspondences between O1 and O2.
There are several algorithms of alignments, for example in [32] they proposed two algorithms of alignments: one called LMO (Linguistic Matching Ontology), based on linguistic similarity; and another based on the similarity of graphs (graph matching), called GMO (Graph Matching Ontology). In [30] is proposed an algorithm to automatically select the best alignment technique, given a set of ontologies to be aligned.
The merging of ontologies is the process, where multiple ontologies in the same domain, are joined to standardize knowledge, grow the knowledge, or having full knowledge locally, among others. The merging of ontologies has different problems such as the handling of the same knowledge with different representations, the partial representation of the knowledge, among others. That requires the presence of experts during the process of merging to make decisions [33].
The linking of ontologies can be performed when have been identified the correspondences between concepts, in order to support the navigation between ontologies.
]]>Other concept in the semantic ontology domain is folksonomy, used to describe a system where users use public tags to redefine items, particularly online items, which allows building a social or collaborative classification.
3.3.2 Hierarchical Clustering
Hierarchical clustering is a data mining method of cluster analysis, which seeks to build a hierarchy of groups. The hierarchical clustering strategies generally fall into two types [13]:
Agglomerative: This is a bottom-up approach that starts with different groups, and pairs of groups are mixed when one moves up the hierarchy.
Divisive: This is a top-down approach that begins with a group, and divisions are performed while is descending in the hierarchy.
We use the agglomerative approach because its quality [13,28]. Since the computing of the similarity of an individual to the centroid of a cluster using characteristics of the individual is really difficult, we stay with a simple way to generate the clusters, as is the agglomerative hierarchical. In order to calculate the similarity, we need to define the attributes for the comparison, and the similarity measures to use in each attribute, for each individual [38]. If we use simply a hierarchical agglomerative algorithm, the time complexity is O(m2). In the agglomerative case, initially an identifier is assigned to each node; and successively these nodes will be grouped, up to the point desired: either a number of nodes per cluster or a maximum number of clusters. The representation of the hierarchy of clusters obtained are usually an inverted tree, called dendrogram, with successive mergers of the groups into top-level groups (larger, less uniformity, see Fig. 2).
]]>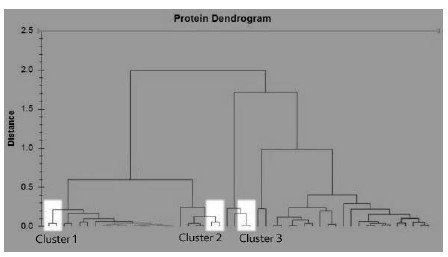
The grouping is given by a function that defines the distance between clusters [28]. The choice of an appropriate metric will influence the shape of the clusters. Different to the classical distance metrics (Manhattan, Euclidean or maximum distance) used by the hierarchical clustering strategies, our hierarchical clustering is based on the modularity measure. Modularity is a scalar value between -1 and 1 that measures the density of arcs inside communities to arcs outside communities. Optimizing this value, results in the best possible grouping of the nodes of a given network. However, going through all possible iterations of the nodes into groups is impractical, so heuristic algorithms are used. In our hierarchical clustering, the first small communities (The first communities are the initial grouping of nodes) are found by optimizing modularity locally on all nodes in the leaves (for example, among clusters 2 and 3, and not among clusters 1 and 2 or 1 and 3), then each small community is grouped into one node, and this step is repeated to a desired point.
The hierarchical clustering algorithm is presented in [39], and when we introduce the modularity measure we find high modularity partitions for large networks in short time. This algorithm is divided in two phases. The first phase is to assign a different community to each node of the network. Then, for each ith node and its jth neighbors is evaluated the gain of modularity (see eq. 1) that would take place by removing i from its community and by placing it in the community of j. The ith node is placed in the community with more profit. This process is applied repeatedly to all nodes, until no further improvement can be achieved. Then, the first phase is completed. The second phase of the algorithm consists in building a new network whose nodes are now the communities found during the first phase. The weights of the links between the new nodes are given by the sum of weights of the links between nodes in the corresponding two communities [40]. Once this second phase is completed, then the first phase can be reapplied to the resulting weighted network, until there are not more changes, a maximum of modularity is attained, and a maximum number of clusters or nodes per cluster (this is the desired point). The hierarchical clustering used in this study has the following macro-algorithm:
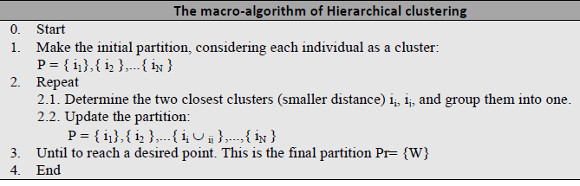
The macro-algorithm assigns initially a cluster to each node (step 1); then continues by grouping the nodes that are closer, using the maximum distance metric (step 2.1). Then, a new partition (cluster) is formed (step 2.2). Steps 2.1 and 2.2 are repeated until reach the desired conditions (maximum number of clusters or number of nodes per cluster).
3.4 Gene Ontology
The Gene Ontology (GO) project [41] rovides structured, controlled, vocabularies and classifications, which cover several domains of molecular and cellular biology. They are freely available for community use [1]. Many biological databases and genome annotation groups use the GO and contribute to the GO project. The GO database integrates the vocabularies and provides full access to this information in several formats. The GO Web resource also provides access to extensive documentation about the GO project, and links to applications that use GO data for functional analyses. The GO ontology is a directed acyclic graph, where each term has relationships to one or more terms in the same domain, and sometimes to other domains. In this graph it can be found:
Cellular Component: it is the parts of a cell or its extracellular environment. It describes a component of a cell that is part of a larger object, such as an anatomical structure.
Biological Process: It describes the operations of a set of molecular events, with a defined beginning and end, with respect where they are integrated: cells, tissues, organs, and organisms. Examples of biological process is "signal transduction". A biological process is not equivalent to a pathway.
Molecular Function: it is the elemental activity of a gene. Molecular functions generally correspond to activities that can be performed by individual genes, but some activities are performed by assembling complexes of genes.
A variety of browsers that provide visualization and query capabilities for the GO are available [1]. For example, the AmiGO browser (developed by the GO software group at Berkeley; see http://www.godatabase.org/cgi-bin/go.cgi) provides a web interface for searching and displaying the ontologies, and organism databases, developed in the GO project. AmiGO easily allows users to browse and to search for terms, using a variety of different keys such as a name, synonyms, definitions, numerical identifiers, among others. The summary view presents the list of genes associated with each term.
PANTHER (Protein ANalysis THrough Evolutionary Relationships) is a tool for the extracting knowledge from GO [1,35]. PANTHER receives a gene identifier, and returns the semantic content of the gene. It is a Library of Families and Subfamilies of Protein, Indexed by Function [35]. In this way, PANTHER is a classification system of proteins in order to facilitate high-throughput analysis. PANTHER has a method for relating protein sequences to functions, in a robust and accurate way. The Proteins have been classified according to:
Molecular function.
Biological process.
Pathway.
4. Our Approach
The main component of our approach is the next macro-algorithm, which detects the clusters within a signaling pathway network by using one of the most successful solutions for the communities’ detection problem [40], based on the modularity measure [39], and enriched it using the GO.
]]>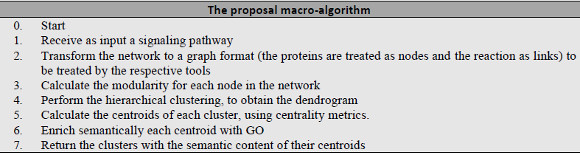
The macro-algorithm is described below: the first step is to bring the signaling pathway network to the desired format. Normally, it is received in OWL format (Ontology Web Language), and must be transformed to a network traditional format, in order to be analyzed by a SNA tool (in our case, Gephi [36], see step 2). Among the formats that the tool allows are: NET, DOT and CSV. Then, the modularity of all nodes is calculated using the equation 1 (step 3).
Each community is defined in step 4 by using our hierarchical clustering algorithm (see section 3.3.2 for more details). These three first steps are done for a given signaling pathway network, such as the TGF-β (see Figure 3). The hypothetical result is shown in Figure 4, where the clusters are represented by circles. They define the dendrogram, as is shown in Figure 2.
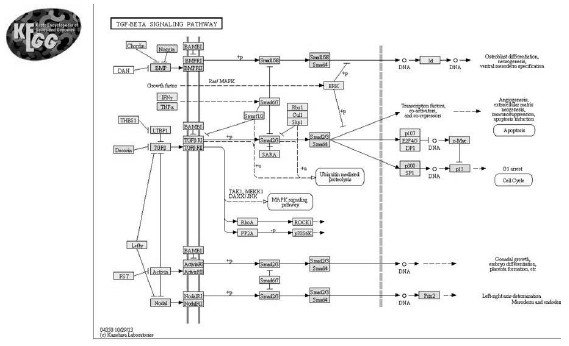
Figure 3: The signaling pathway network of TGF-β
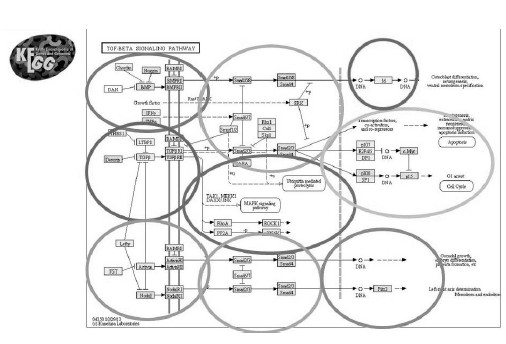
Figure 4: Clusters for the signaling pathway network of TGF-β
Then, the centroids are extracted for each cluster (step 5). For this study, the centroids will be taken as equivalent to the central nodes, taking into account the measures of centrality such as degree, closeness and betweenness. We are striving to merge the concepts of centroid of the cluster and central nodes of communities. A negative consequence is that we will not have a unique centroid, but the positive consequence is that we do not need just one, indeed more than one node that represents a cluster is helpful, in order to extract more knowledge from the GO to enrich the cluster. Initially, the central nodes are defined by the centrality measures of degree and closeness, because these are nodes that can be reached fast for the rest of the nodes in the network. If these centralities are not enough to identify the central node in each cluster, the betweenness centrality is used as a second filter, this is done because there are some networks that using just the closeness centrality, it is not possible to detect a group of interesting nodes.
Next, the central nodes are passed to a semantic enrichment (step 6). This is done by using the PANTHER tool from the GO consortium. In this work, the nodes that are passed to PANTHER are the highly central nodes of each cluster that were filtered using the degree, closeness and betweenness centralities, and the semantic information returned will be extrapolated to each cluster where each central node belongs (step 7). The query using the PANTHER tool is an OM task (alignment and linking of the central nodes of the clusters with GO), for the semantic enrichment of the clusters.
]]> The step 6 is based in the alignment of the Gene Ontology with the most central nodes inside each cluster, for a further enrich of each cluster within the pathway with the knowledge that can be incorporated from the Gene Ontology to the clusters. Then, the Gene Ontology is merged with these central nodes of each cluster. For some authors, this can be understanding as folksonomy, because our system uses public tags to enrich its clusters.5. Case Studies
5.1 TGF-β
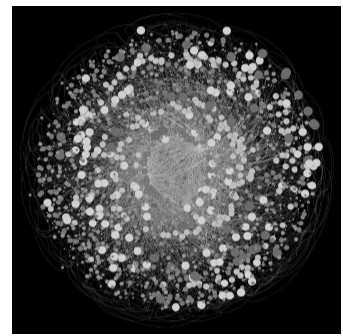
TGF-β is a protein that controls cell proliferation implicated in cancer. This study allows biologists to detect biological functions specific to the cancer cell proliferation. The network used is shown in Fig. 5 in the network format that supports Gephi. The network has 1534 nodes or genes, and 3029 reactions or relations between them.
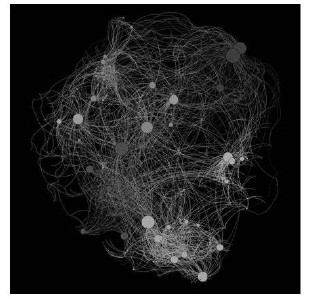
Figure 5: Gephi Clusters
Once calculated the modularity, 16 communities were found, which for this work represent 16 clusters of genes. In the calculation of centrality for all genes in the network, the Closeness Centrality was highly interesting, because for this type of network, the critical nodes are the ones that may be causing a disease, in this case carcinogenic. These nodes with high closeness centrality will spread a disease faster, or they are responsible for triggering a series of reactions that lead to the disease. The central nodes are shown in Fig. 6, which have a larger size than those with lower centrality (the size is proportional to the measure of centrality). Our approach calculates the degree and closeness centralities as a first filter, and the betweenness centrality when the other centralities give too much central nodes, in order to reduce the number of central nodes.
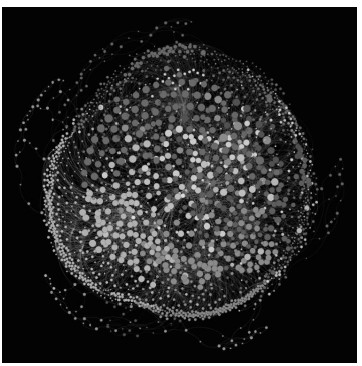
Figure 6: Network view with larger size of central nodes
]]>
As mentioned in the algorithm, the closeness centrality is calculated (Fig. 7 shows the closeness central nodes of Fig. 6). These nodes are potentially critical genes in the development of cancer diseases. This leads to a greater understanding for the biologists.
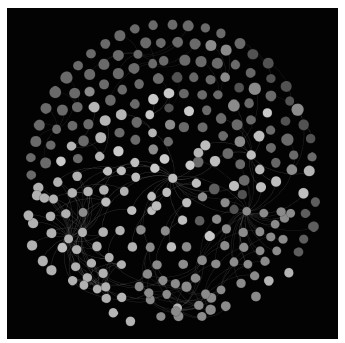
Figure 7: Network view showing only central nodes
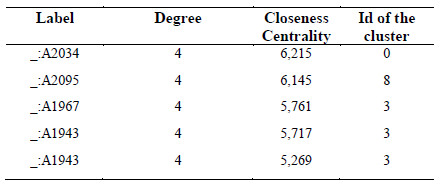
Table 1 shows the output that provides Gephi, where label is the identifier of the gene, degree is the degree centrality of the node or gene in the network, closeness centrality is the value of proximity of the gene, and id of the cluster is the number of the community to which each node belongs. In this case, it does not need to use the betweenness centrality because with the degree centrality and the closeness centrality there are enough nodes from each cluster to enrich the clusters.
Table 1: Gephi TGF-Β output
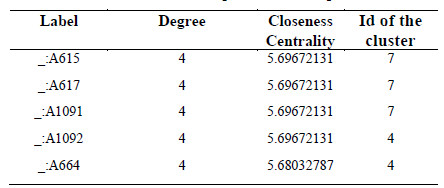
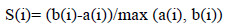
Table 1 is a small version of the real table, with only 5 of the most central nodes, belonging to two different clusters; the genes _:A615, _:A617 and _:A1091 belong to cluster 7, and have the highest closeness centrality from the entire network. Furthermore, the genes _:A1092, and _:A664 belong to cluster 4, the most central nodes from cluster 4 (using the Closeness Centrality). We have used the Silhouette Coefficient like the performance metric, to measure the quality of the clustering process. The Silhouette Coefficient of a i node is [13]:
 (6) ]]>
Where a(i) is the mean distance between the ith node and all other nodes in the same cluster, and b(i) the mean distance between the ith node and all other nodes in any cluster not containing the node. We compute the average of the Silhouette Coefficient of all nodes as an overall measure of the goodness of the clustering process. The result is 0.9214, it is a very good result (closer to 1 is the best value). This is done in order to check and verify that our approach is giving good results.
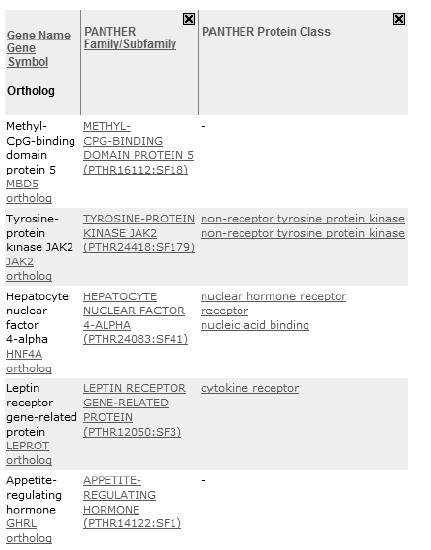
The next step is the semantic enrichment of the data in Table 1, which is performed with the PANTHER tool. The list of genes identifiers is given as input to PANTHER, and the output that gives the tool can be seen in Fig. 8, where all terms are referenced to a concept GO.
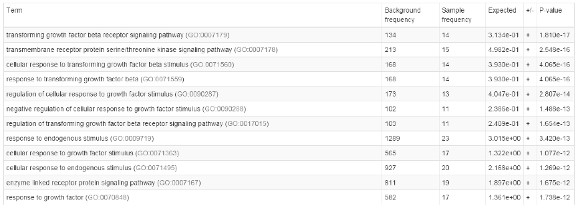
Figure 8: Semantic enrichment of the nodes, extracted from PANTHER
In Fig. 8 can be seen the list of genes in Table 1, with the semantic content extraction from GO. Each GO term within the table has a unique alphanumeric identifier; which leads to a definition with cited sources; and a namespace indicating the domain to which it belongs. The terms may also have synonyms, references to equivalent concepts in other databases, and comments about the meaning or usage of the term. This can be used by the biologists in order to know exactly which genes, proteins or reactions are the critical nodes in a pathway. These cells are essential in the proliferation of the disease.
5.2 Alzheimer Disease
This experiment shows the pathway of genes, and other processes associated with the Alzheimer's disease. An adaption from KEGG 2011 (see [15] and http://www.genome.jp/kegg/pathway/hsa/hsa05010.html for details) was used. This network has 2537 nodes or genes, and 5816 reactions or relationships between them.
As in the case of TGF-β, the closeness centrality is calculated. Fig. 9 shows the network using a filter that only allows highly central nodes using the closeness centrality, these nodes are the genes that can propagate a disease faster than other nodes.
 ]]>
]]>
A second filter is used to allow genes with a high degree of input and output, the resulting network is illustrated in Fig. 10. This is done to get the more representative nodes from each cluster, these genes are those that can propagate faster the disease (closeness centrality), and moreover, they are nodes that can spread the disease to a high number of nodes at the same time (degree centrality), for these two reasons, these nodes are critical nodes in the network.
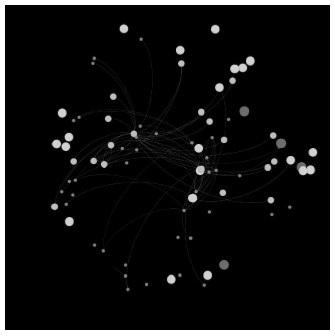
Figure 10: Alzheimer Network view, with the main central nodes
Table 2 shows the output that provides Gephi. Table 2, like Table 1, is a reduced version of the real data table with thousands of genes. In this case are shown only 5 of the central nodes, belonging to three different clusters, clusters 0, 3 and 8. These genes have the highest closeness centrality of the graph. The Silhouette Coefficient value, using the eq. 6, in this case is 0.9067, that is, the quality of the clustering process is good.
Table 2: Gephi Alzheimer output
The next step is the semantic enrichment of the data in Table 2. As mentioned in the previous case, it is performed with the PANTHER tool. The output of the tool can be seen in Fig. 11, where all terms are referenced to a concept in GO. In Fig. 11 can be seen the genes listed in Table 2, with the semantic content mapped from the GO. In this case, PANTHER gives links to their respective family in the ontology. This output type, besides giving semantic content to the nodes (genes and proteins); adds a macro-semantic content, which is the family and the kind of node. This will be used by the biologists to analyse the critical genes in a pathway (essential in the spread of diseases or other biological reactions), their family and the protein class.
 ]]>
]]>
5.3 Comparison with similar approaches
The criteria used for comparison with other approaches are: Theoretical bases used for the study, the type of problem which is resolved, and the output given to the user.
Table 3: Comparison with previous work
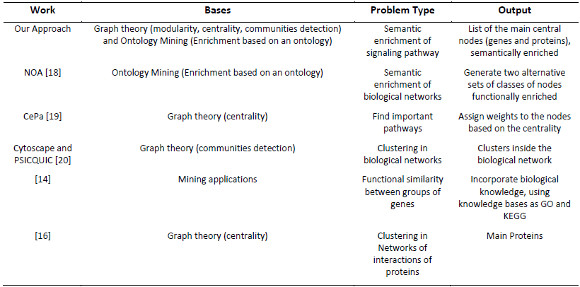
According to Table 3, similar approaches usually perform the analysis only using graph theory or ontologies. The only one that mix both in a semantic enrichment process is our approach. Our proposal is based on the structure of the generated graph of the signaling pathway, and the graph is analyzed using techniques of SNA to detect clusters (communities). Additionally, it identifies the most central nodes in each cluster. Also, it uses OM techniques (alignment and linking of the most central nodes of the clusters) for the semantic enrichment of the nodes (proteins) in the clusters. Our approach can use any gene ontology, not only GO, in the semantic enrichment process, and can be used in any signaling pathway, as we are shown in two case studies.
Additionally, we use the silhouette measure to determine the similarity of an object with its own cluster compared to other clusters (see eq. 6). The silhouette ranges from -1 to 1, where a high value indicates that the object is well matched to its own cluster and poorly matched to neighboring clusters. If most objects have a high value, then the clustering configuration is appropriate, otherwise the clustering configuration may have too many or too few clusters. The result of the Silhouette Coefficient value for the first case is 0.9214, and for the second case is 0.9067, that is, the quality of the clustering process is very good with respect to previous works (see previous sections).
6. Conclusions
This paper proposed the use of clustering techniques aimed initially for SNA, to detect communities or groups in the signalling pathway networks. As main contribution, respect to other signalling pathway analysis techniques, our approach does not use the traditional clustering techniques, but from another area (SNA). In this way, it uses the ideas of modularity to define the clusters, then the centrality of nodes is used to link them with semantic knowledge, and characterize the biological clusters where each central node belongs to. In particular, the centrality identifies the central nodes within groups, without making a study of the characteristics of the nodes, only considering their structures and connectivity. It is sufficient to determine the critical nodes in a community.
]]> Particularly, this idea of the utilization of measures from the graph theory can extend the analysis of the biological networks with other concepts, to understand them better. Next work must explore the relationship between these measures and the biology, and analyse the interest in using other metrics from the graph theory: eigenvector centrality, Katz centrality, PageRank, among othersOn the other hand, we have used the GO for the semantic enrichment, and in particular, the PANTHER query engine. Semantically, it enriches the most central nodes in each group. This provides much information of value to biologists because it gives precise biological information for critical nodes in the spread of a disease. Our approach does not depend of this ontology, we can use others ontologies, or a mix of them.
A future work is an application that integrates all these tools. Also, future studies should analyse a process of semantic enrichment from multiple ontological sources (for this task, it will be required other OM tasks, such as the ontological merge.
Acknowledgements
Project CDCHTA I - 1407-14 - 02 - B from the Universidad de Los Andes, for their financial support. PhD. Aguilar has been partially funded by the Prometeo Project from the Ministry of Higher Education, Science, Technology and Innovation of the Republic of Ecuador.
References
[1] M. Harris, J. Clark, A. Ireland, J. Lomax, M. Ashburner, R. Foulger, et al. “The Gene Ontology (GO) database and informatics resource”. Nucleic Acids Research. vol. 32, pp. D258-D261, 2004. http://geneontology.org/.
[2] U. Stelzl, U. Worm, M. Lalowski, C. Haenig, F. Brembeck, H. Goehler, M. Stroedicke, et al. “Human protein–protein interaction network: a resource for annotating the proteome”. Cell, vol. 122, pp. 957–968, 2005.
[3] J. Hasty, D. McMillen, F. Isaacs, and J. Collins, “Computational studies of gene regulatory networks: in numero molecular biology”. Nat. Rev. Genet., vol. 2, pp. 268–279, 2001.
[4] E. Ravasz, A. Someraz, D. Mongru, Z. Oltvai and A. Barabasi. “Hierarchical organization of modularity in metabolic networks”. Science, vol. 297, pp. 1551–1555, 2002.
]]> [5] H. Kitano, “Systems biology: a brief overview”. Science, vol. 295, pp. 1662–1664, 2002.[6] A. Barabasi and Z. Oltvai, “Network biology: understanding the cell’s functional organization”. Nature Reviews Genetics, vol. 5, pp. 101–113, 2004.
[7] L. Chen, R. Wang and S. Zhang, Biomolecular Networks: Methods and Applications in Systems Biology. John Wiley & Sons, 2009.
[8] L. Chen, R. Wang and K. Aihara, Modeling Biomolecular Networks in Cells: Structures and Dynamics. London, Springer, 2010.
[9] C. Aggarwal, and H. Wang, Managing and Mining Graph Data. Advances in Database Systems, Springer, 2010.
[10] R. Agrawal, and R. Srikant, “Fast algorithms for mining association rules in large databases”, in Proc. 20th International Conference on Very Large Data Bases, San Francisco, CA, USA, 1994, pp. 487-499.
[11] S. Agrawal, S. Chaudhuri and G. Das, "DBXplorer: a system for keyword-based search over relational databases," in Proc. 18th International Conference on Data Engineering, San Jose, CA, USA, 2002, pp. 5-16.
[12] S. Bhagat, G. Cormode, and I. Rozenbaum, “Applying link-based classification to label blogs”, in Proc. 2007 workshop on Web mining and social network analysis, New York, NY, USA, 2007, pp. 92-101.
[13] Aguilar, “Resolution of the clustering problem using genetic algorithms”, International Journal of computers, vol. 1, pp. 237-244, 2007,
[14] G. Yu, L. Wang, Y. Han, and Q. He, “ClusterProfiler: an R package for comparing biological themes among gene clusters”. OMICS: Journal of Integrative Biology, vol. 16, pp. 284-287, 2012.
[15] KEGG: Kyoto Encyclopedia of Genes and Genomes, http://www.genome.jp/kegg/
[16] M. Bux, U. Leser, U., and T. Philippe, “Comparing semantically enriched experimental protein networks in colorectal cancer”. Humboldt Universität zu Berlin, 2012.
[17] H. Chuang, E. Lee, T. Liu, D. Lee, and T. Ideker, “Network-based classification of breast cancer metastasis”. Molecular Systems Biology, vol. 3, pp. 140, 2007
[18] J. Wang, Q. Huang, Z. Liu, Y. Wang, L. Wu, L. Chen, and X. Zhang. “NOA: a novel Network Ontology Analysis method”. Nucleic Acids Research, vol. 39, 2011
[19] Z. Gu, and J. Wang. “CePa: an R package for finding significant pathways weighted by multiple network centralities”. Bioinformatics Applications Note, vol. 29, pp. 658–660, 2013.
[20] P. Porras, “Network generation and analysis through Cytoscape and PSICQUIC”. EMBL-EBI, vol. 6. Cambridge, U.K. https://www.ebi.ac.uk/sites/ebi.ac.uk/files/content.ebi.ac.uk/materials/2013/130702_San_Michele/biolnetworksanalysis_tutorial.pdf
]]> [21] C. Bettembourg, C. Diot, and O. Dameron, “Semantic particularity measure for functional characterization of gene sets using gene ontology”. PLoS One, vol. 9, 2014.[22] A. Dinasarapu, B. Saunders, I. Ozerlat, K. Azam, and S. Subramaniam. "Signaling gateway molecule pages, a data model perspective". Bioinformatics, vol. 27, pp. 1736–1738, 2011.
[23] M. Berridge, Cell Signalling Biology, Portland Press Limited M.J. 2014)
[24] O. Mason, and M. Verwoerd, “Graph theory and networks in biology”. IET Systems Biology, vol. 1, pp. 89-119, 2007.
[25] V. Blondel, J. Guillaume, R. Lambiotte, and E. Lefebvre, “Fast unfolding of communities in large networks”. Journal of Statistical Mechanics: Theory and Experiment, Vol. 2008, pp. 10008- 10020, 2008.
[26] E. Ravasz, A. Somera, D. Mongru, Z. Oltvai, and A. Barabási, “Hierarchical organization of modularity in metabolic networks”. Science, vol. 297, pp. 1551-1555, 2002.
[27] S. Borgatti, “Centrality and network flow”. Social Networks, vol. 27, pp. 55–71, 2005.
[28] J. Sun and J. Tang, “A survey of models and algorithms for social influence analysis”. In Social network data analytics (C. Aggarwal Ed.), Nueva York, Springer, pp. 177–214, 2011.
[29] G. Sabidussi, “The centrality index of a graph”. Psychometrika, vol. 31, pp. 581-603, 1966.
[30] C. Rangel, J. Aguilar, M. Cerrada, J. Altamiranda. “An approach for the emerging ontology alignment based on the bees colonies”, in Proc. Int. Conf. Artificial Intelligence, Las Vegas, USA, 2015, pp. 536-541.
]]> [31] J. Aguilar, J. Altamiranda, “Minería de Datos en la Web usando Computación Evolutiva”, In Ingeniería de Software en la Década del 2000 (N. Brisaboa Ed.), AECI, RISTOS2, pp. 153-168, 2003.[32] J. Euzenat and P. Shvaiko. Ontology Matching. Berlin, Springer-Verlag, 2007.
[33] B. Bouchou, C. Niang, and M. Lo. “Towards tailored domain ontologies”, in Proc 5th International Workshop on Ontology Matching, pp. 241-243, 2010.
[34] J. Altamiranda, J. Aguilar, and C. Delamarche, “Similarity of Amyloid Protein Motif using an Hybrid Intelligent System", IEEE Latin America Transactions, vol. 9, pp. 700-710, 2011.
[35] P. Thomas, M. Campbell, A. Kejariwal, H. Mi, et. Al. “PANTHER: a library of protein families and subfamilies indexed by function”. Genome Research, vol. 13, pp. 2129-2141, 2003.
[36] M. Bastian, S. Heymann and M. Jacomy, Gephi: An open source software for exploring and manipulating networks, International AAAI Conference on Weblogs and Social Media, 2009.
[37] Y. Ishikawa, J. Li, W. Wang, R. Zhang, and W. Zhang. “Web Technologies and Applications”. 15th Asia-Pacific Web Conference, APWeb 2013, Sydney, Australia, April 4-6, 2013, Proceedings (Vol. 7808). Springer.
[38] L. Rokach, and O. Maimon. “Clustering methods”. Data mining and knowledge discovery handbook (pp. 321-352). 2005 Springer US.
]]> [39] V. D. Blondel, J-L. Guillaume, R. Lambiotte, E. Lefebvre. “Fast unfolding of communities in large networks”. Journal of Statistical Mechanics: Theory and Experiment 2008 (10), P1000[40] A. Arenas, J. Duch, A. Fernández, and S. Gómez. “Size reduction of complex networks preserving modularity”. New Journal of Physics, 9(6), 176. 2007.
[41] M. Ashburner, C. A. Ball, J. A. Blake, D. Botstein, H. Butler, J. M. Cherry, and M. A. Harris. “Gene Ontology: tool for the unification of biology”. Nature genetics, 25(1), 25-29. 2000.
[42] I. Peters, I. “Folksonomies: indexing and retrieval in Web 2.0 (Vol. 1)”. Walter de Gruyter. 2009.
[43] K. Borne. “Collaborative annotation for scientific data discovery and reuse”. Bulletin of the American Society for Information Science and Technology, 39(4), 44-45. 2013.
[44] G. Asmolov. “Crowdsourcing and the folksonomy of emergency response: The construction of a mediated subject”. Interactions: Studies in Communication & Culture, 6(2), 155-178. 2015.
]]>