Natália Chaves Lessa Schots, Rodrigo Figueiredo Magalhães, Taísa Guidini Gonçalves, Ricardo de Holanda Busquet, Ana Regina Rocha
COPPE, Universidade Federal do Rio de Janeiro,
Rio de Janeiro, Brazil
{natalia, rfmagalhaes, taisa, darocha}@cos.ufrj.br; ricardobusquet@poli.ufrj.br
and
Gleison Santos
Programa de Pós-Graduação em Informática, Universidade Federal do Estado do Rio de Janeiro (UNIRIO)
Rio de Janeiro, Brazil
]]> andKáthia Marçal de Oliveira
Laboratoire LAMIH, Université de Valenciennes
Valenciennes Cedex 9, France
kathia.oliveira@univ-valenciennes.fr
Abstract
Background: Process performance analysis is a key step for implementing continuous improvement in software organizations. However, the knowledge to execute such analysis is not trivial and the person responsible to executing it must be provided with appropriate support. Aim: This paper presents a knowledge-based environment, named SPEAKER, proposed for supporting software organizations during the execution of process performance analysis. SPEAKER comprises a body of knowledge and a set of activities and tasks for software process performance analysis along with supporting tools to executing these activities and tasks. Method: We conducted an informal literature reviews and a systematic mapping study, which provided basic requirements for the proposed environment. We implemented the SPEAKER environment by integrating supporting tools for the execution of activities and tasks of performance analysis and the knowledge necessary to execute them, in order to meet the variability presented by the characteristics of these activities. Results: In this paper, we describe each SPEAKER module and the individual evaluations of these modules, and also present an example of use comprising how the environment can guide the user through a specific performance analysis activity. Conclusion: Although we only conducted individual evaluations of SPEAKER’s modules, the example of use indicates the feasibility of the proposed environment. Therefore, the environment as a whole will be further evaluated to verify if it attains its goal of assisting in the execution of process performance analysis by non-specialist people.
Abstract in Portuguese:
Contexto: A análise de desempenho de processo é um passo essencial para a implementação da melhoria contínua de processos em organizações de desenvolvimento de software. No entanto, o conhecimento necessário para executar esta análise não é trivial e a pessoa responsável por executá-la deve ser apoiada adequadamente para que a organização obtenha os reais benefícios advindos desta prática. Objetivo: Este artigo apresenta um ambiente baseado em conhecimento, denominado SPEAKER, proposto para apoiar as organizações de desenvolvimento de software durante a execução da análise de desempenho de processo. O ambiente SPEAKER é composto por um corpo de conhecimento e um conjunto de atividades e tarefas para a análise de desempenho de processo de software, além de prover ferramentas que auxiliam a execução destas atividades e tarefas. Método: A partir de revisões informais da literatura e da realização de um mapeamento sistemático, foram derivados os requisitos básicos do ambiente proposto. O ambiente SPEAKER foi desenvolvido integrando as ferramentas de apoio para a execução das atividades e tarefas da análise de desempenho e o conhecimento necessário para executá-las, a fim de garantir que a variabilidade presente nestas atividades seja atendida. Resultados: Neste artigo, cada módulo do ambiente SPEAKER é descrito, as avaliações individuais destes módulos são apresentadas e um exemplo de uso do ambiente como um todo é descrito, a fim de ilustrar como o ambiente guia o usuário em uma atividade específica da análise de desempenho. Conclusão: Embora somente avaliações individuais dos módulos do ambiente SPEAKER tenham sido realizadas, o exemplo de uso indica a viabilidade do ambiente proposto. No entanto, o ambiente como um todo será avaliado posteriormente visando verificar se, de fato, atende ao seu objetivo de guiar pessoas não especialistas durante a execução da análise de desempenho de processo.
Software quality can be achieved with the adoption of methods and techniques focused both on product and process quality. Indeed, methods and techniques aimed at process quality have been attracting increased attention from software development organisations. This attention can be explained by the premise that a process executed with quality tends to yield products with more quality [1].
]]> In this sense, quality standards (such as ISO/IEC 15504 [2]) and maturity models (such as CMMI-DEV [3] and MR-MPS-SW [4], which is the Reference Model for Software of the Brazilian Software Process Improvement Program; it is fully compatible with CMMI-DEV) offer the bare requirements to define, evaluate and improve software processes. Each maturity level, on both CMMI-DEV and MR-MPS-SW, describes requirements based on which organisations should implement a specific set of Software Engineering good practices. Software organisations manage to adjust these requirements to their own characteristics and needs in order to implement processes with quality. As a result, organizations benefit from reduction of re-work, greater productivity and higher precision in estimates [5].Organisations on the higher maturity levels of CMMI-DEV and MR-MPS-SW move on to quantitatively understand the performance of their processes, which allows process performance predictability, preventive management of projects and implementation of improvements and innovations [3][4]. The first step to achieve such levels is to adopt techniques and methods of a quantitative and statistical nature that allow process performance analysis. From such analysis, organisations can understand better their processes as well as control and predict them in line with the expectations of organisations’ high management and clients [6].
The use of techniques to study process performance started in the domain of manufacturing and has been successfully introduced in other areas, including software development [7]. Literature shows several examples of importance and benefits of executing performance analysis in software processes [6][8][9]. However, only few organisations have adopted it, as can be seen by the number of organisations assessed on levels B and A of MR-MPS-SW (1% of valid assessments) [10] and on levels 4 and 5 of CMMI (8% of valid assessments) [11]. Apart from that, a lack of evidence is perceived on the effective application of performance analysis in the software development domain [12].
Examples of difficulties in executing process performance analysis in software development organisations are: (i) lack of a procedure for adequate measures’ planning and collecting; (ii) lack of knowledge on techniques and methods to execute process performance analysis; and (iii) lack of knowledge on the data needed to carry out an adequate analysis [12][13][8][7].
As can be seen, most of the difficulties relate to lack of knowledge and experience in performance analysis execution by those in charge of process management activities [6]. Moreover, Simões et al. [14] state that the level of technical knowledge in performance analysis is a critical factor for success in implementing CMMI-DEV Level 5.
Based on software engineering literature and on practical experience acquired in consultancy work on software development organisations, we believe that both technical knowledge on concepts and techniques used in performance analysis, and knowledge on the organization’s processes and on the organisational context in which the processes are executed are necessary to accomplish an effective process performance analysis (as stated also by [15]). Therefore, knowledge becomes an important asset in the execution of performance analysis and should be adequately managed so the organisation can benefit from it.
In this context, we believe that providing a body of knowledge on the concepts, activities, and techniques used in process performance analysis, as well as its maintenance, can help software development organisations adequately carry out performance analysis. We also believe that knowledge management practices can be used on this body of knowledge in order to support the execution of performance analysis by providing knowledge to the right person at the right time.
An important knowledge management practice is the knowledge presentation, i.e. how knowledge will be introduced to the user, since knowledge on performance analysis is complex and extensive. An adequate presentation will help understanding the knowledge structure and finding the relevant information to perform necessary tasks more easily. Also, the person responsible for executing performance analysis must be supported during the execution of whole performance analysis process.
We were not able based on informal literature reviews and a systematic mapping study [16], to identify systems or approaches that would completely help the execution of software processes performance analysis by providing the necessary knowledge to guide the user through the necessary steps. Therefore, we have developed the SPEAKER (Software Process pErformance Analysis Knowledge-based EnviRonment) environment at COPPE/UFRJ in order to support the execution of software process performance analysis using knowledge management practices. SPEAKER aims at creating, organising, and providing the necessary knowledge to execute software process performance analysis as well as to provide support to the execution of the associated activities.
This article aims at describing the SPEAKER environment and its modules. Section 2 makes a brief description of the main concepts used in this work. The SPEAKER environment, as well as each one of its modules, is described in Section 3. Section 4 provides an example of use in a hypothetical setting. Related works are discussed in Section 5. Finally, Section 6 provides the final considerations.
Performance analysis implementation is associated to the following benefits [6][8][9][14][17]: (i) process predictability, which leads to feasible plans, meeting costs and deadlines estimated, and the delivery of quality products; (ii) better understanding of processes, enabling better decision-making; (iii) fostering better project management by detecting deviations before they actually happen; and (iv) better estimating of future projects.
A process should have a stable behaviour so that its measures can be used to predict future performance results and, thus, support continuous improvement [17]. In a stable process, performance variations are due to common causes only, i.e., variations are caused by factors inherent to the process itself. Conversely, unstable processes have variations produced by special causes, i.e., factors outside the process that do not allow its behaviour to remain within known limits nor be predictable [6][17]. Control charts are used to characterize the stability of a process, being the most commonly used statistical method in performance analysis activities [7].
According to Florac and Carleton [6], process performance analysis consists of the following activities: (i) Clarifying the business goals; (ii) Identifying and prioritising critical points in the processes; (iii) Selecting and defining measures for both process or product; (iv) Collecting, checking and storing the data on process execution; (v) Analysing process behaviour, i. e., checking the stability of the process; and (vi) Verifying process capability. Apart from these typical statistical process control activities, there is the need to create performance models that enable predicting future process execution. Performance models are important for quantitative project management [3] and comprise the identification of mathematical relationships between attributes of a process.
The person responsible for the performance analysis activities must have the technical expertise on the methods and techniques that are used during each activity. However, this knowledge is not enough as several variables in the process and in the organisational context that have to be analysed to ensure the correct application of the adequate methods and techniques.
For instance, the choice of control charts should be linked to the type of measure to be analysed, to the data distribution model, to the organisational question addressed etc. An incorrect choice of a control chart might lead to an error in the process analysis (e.g., incorrectly assumption of process stability) and thus harming the decision-making. In many cases, only a person with a technical knowledge and a grasp of the process may be able to see this type of error and correct it (in this case, by suggesting the use of another type of control chart).
A knowledge-based system (KBS) can be used to assist a non-expert in carrying out the process performance analysis. KBS aims to imitate human reasoning in problem-solving, providing support to decision-making [18] from a combination of Artificial Intelligence techniques and a specific knowledge database.
In general terms, a KBS implements knowledge management activities such as: knowledge identification, knowledge acquisition, knowledge development, knowledge dissemination, knowledge utilisation and knowledge maintenance [19]. However, these activities may vary depending on the needs and on the operating context.
According to Abecker et al. [19], a good knowledge-based system should handle both explicit and tacit knowledge from a hybrid solution to bridge the technology and human aspects. This type of solution gives the user relevant information about a problem and, as a result, provides better support to one's decisions. In this context, explicit knowledge (also referred to as "coded knowledge") is the type of knowledge that can be easily described in a textual or symbolic manner. On the other hand, tacit knowledge is found in people minds, being difficult to express [19]. Both types of knowledge are tackled in this work, in the attempt to identify, organise, record and provide them in the proposed KBS.
Knowledge visualization comprehends the use of visual representations to construct, assess or apply knowledge in a given context [20]. These visual representations are important especially in two knowledge management activities: knowledge dissemination and knowledge utilisation. Both activities concern on transmitting a specific knowledge from a person (sender) to another (recipient), aiming that the recipient could re-construct, remember and apply this knowledge correctly.
]]> There are many types of visual representations, each one (or a combination of them) can be more appropriate for a given context. In the performance analysis context, since the related knowledge is complex and extensive, the knowledge needs to be presented gradually to the user for a better understanding [20]. In this sense, mind maps are a visual representation that fits this need by presenting knowledge on demand. A mind map is a radial diagram that represents relationships between concepts hierarchically [21], in which the central concept is placed in the middle of the map and the related concepts are linked to it. In this visual representation, the more distant a concept is from the central node, the more detailed it is. For this reason, the mind map was the visual representation adopted at SPEAKER Environment to present the body of knowledge.Some performance analysis activities can be repeated more than once depending on the characteristics of the subprocess (a process that is part of a larger one [3]) to be analysed or the organizational needs. Apart from the repetition of the performance analysis activities for each subprocess that needs to be analysed, the execution of one single subprocess is not linear but interactive, allowing that a given performance analysis activity is executed more than once in one same analysis. Given this peculiarity and organisations need to reuse knowledge from such activities, defining a process for performance analysis can support organisations to implement these activities [22].
According to the experimental study presented in [23], the use of process lines can reduce the effort and time required to define a process. Hence process lines and process elements are applicable to define performance analysis processes.
In the approach defined in [23] and used in this research, 'process lines' are product lines where the products are software processes, and 'process element' is an encapsulation of information items and process behaviours on a given level of granularity where the latter varies according to the intended use. Process elements comprise: (i) activities – fully defined process elements; or (ii) process components – process elements that form the basic unit for the definition of process with reuse. There are two types of process components: concrete or abstract. Concrete components do not have any variation, i.e., they are accomplished by more than one path, while abstract components have variations. Concrete components are executed as they were described whilst abstract components requires choices to be made until it reaches the level of a concrete component and, therefore, can be executed. One process line can model variations through points of variation and determine which elements are optional or mandatory. These points of variation are represented by abstract components.
Given the knowledge required to execute the performance analysis process and the definition of process lines and elements, the dynamic definition of the process at hand is required as the execution will take place according to the choices aimed at each of the situations analysed.
The performance analysis is executed in parts, which means that the tool executes one process element at time, based on KBS choices to instantiate a process line. This means that the result of each process element execution will be analysed in order to check the need for execution of the next element that, in this case, may be the same element executed in the first place.
As mentioned before, apart from the difficulty in identifying and collecting adequate measures, most of the difficulties faced during performance analysis are related to a lack of knowledge and experience. We believe that a body of knowledge on software process performance analysis and the support of specialized tools can help minimize these difficulties.
The SPEAKER environment [24] aims at providing the body of knowledge and at supporting the process performance analysis execution. SPEAKER environment provide knowledge management practices to assist process performance analysis in software development organisations that want to reach high maturity on maturity models such as CMMI-DEV e MR-MPS-SW or that want to better understand and manage their processes. In order to use SPEAKER environment, an organisation needs to have a well-established measure program comprising adequate measures definition, consistent and periodic measures collection and proper measures repository. Besides that, the organisational process must be standardized and institutionalized. Both conditions are found in organisations that achieve CMMI level 3 or MR-MPS-SW level C.
Based on literature review and on the practical experience acquired in consultancy work on software development organisations, we identified a set of requirements for the SPEAKER environment, as follows. The literature review was conducted by: (i) an informal review, which comprises traditional books in performance analysis (e.g., [6] and [17]) and experience reports in industry (although few reports have been identified, e.g., [7][8][9][12][14]); and (ii) a systematic mapping study aiming at exploring how knowledge management practices are used in software process performance analysis (more information is given in Section 5).
R1 – The environment must provide the knowledge needed to carry out software processes performance analysis, guiding the person responsible through all the activities to be undertaken – for executing the process performance analysis properly the user needs both technical knowledge and organisational knowledge; the environment must allow the record, storage and presentation of related knowledge;
]]> R2 – The environment must support the execution of all the activities planned to carry out a software processes performance analysis, as follows: organization’s quantitative goals identification; critical subprocesses identification; evaluation of adequacy levels for the steps in performance analysis; process stability verification; process capacity verification; and performance models definition – all activities and tasks required to execute the performance analysis need support in terms of showing the related knowledge and presenting the proper workflow of this activities and tasks;R3 – The environment must manage the execution of the activities in the process performance analysis along with the support of knowledge management – the knowledge related to each activity or task must be properly presented during their execution;
R4 – The environment must store the results from the execution of the process performance analysis activities in order to allow the execution of the next activities as appropriate for each scenario – from the obtained results of each activity, the environment must guide the user to the proper next activity;
R5 – The environment must comply with MR-MPS-SW level B, CMMI-DEV level 4, and ISO/IEC 15504 capability level 4 – the environment focus is to provide the initial knowledge about performance analysis (required in CMMI level 4 and MR-MPS level B), since it is the first step achieve the highest levels in these maturity models.
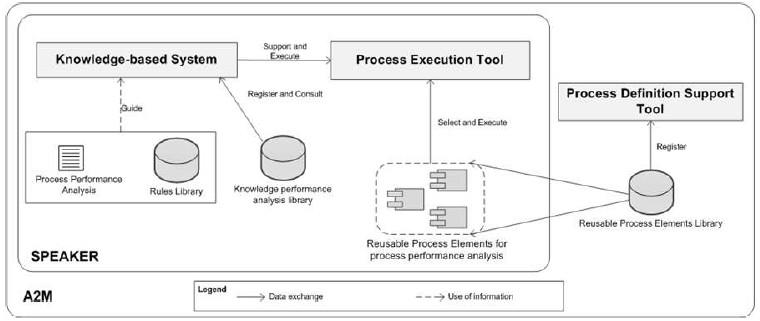
To meet these requirements, the SPEAKER environment was designed with two main tools, as depicted in Fig. 1: (i) a Knowledge-based System (KBS) that contains the body of knowledge of the environment and also guides the person responsible through the performance analysis execution, presenting the knowledge required for each activity (KBS is detailed in Sections 3.1 and 3.2); and (ii) a Process Execution Tool (FIE, in the Brazilian Portuguese acronym for ‘Ferramenta de Instanciação e Execução do processo’) that allows controlling the dynamic instantiation of the process in performance analysis and storing of the results attained (FIE is detailed in Section 3.4).
As also shown in Fig. 1, the SPEAKER environment itself is part of another environment – the High Maturity Environment (A2M, in the Brazilian Portuguese acronym for ‘Ambiente de Alta Maturidade’) – that provides it with the necessary infrastructure. The A2M aims at supporting the execution of high maturity practices in software development organisations, integrating functionalities such as [23][25][26]: (i) support to strategic, tactical and operating planning in software organisations; (ii) support to monitoring of the goals defined; (iii) definition of process elements and process lines; (iv) library of reusable processes; and (v) definition of standard processes for organisations. A2M has the Process Definition Support tool, which contains a library of reusable process elements that support process definition. A part of the process for performance analysis is described in this format and stored in the corresponding Library in the domain of the SPEAKER environment, as described in Section 3.3.
Figure 1: SPEAKER Environment – Architecture Depiction
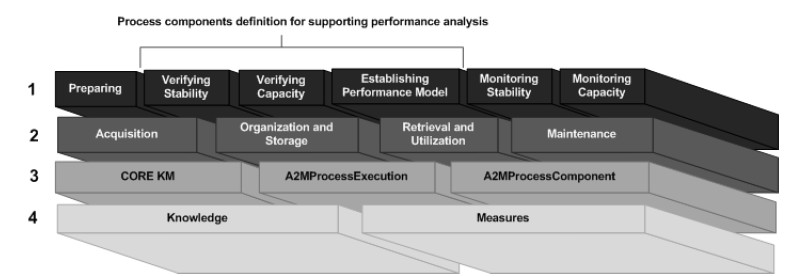
From a layered perspective, as shown in Fig. 2, the SPEAKER environment can be presented as an environment that provides support to the execution of the process performance analysis activities (layer 1) from the use of a knowledge infrastructure (layer 2) and a computational infrastructure (layer 3), making use of the knowledge base and of the organizational measure database (layer 4).
Figure 2: SPEAKER Environment – Layered View
SPEAKER’s initial body of knowledge (detailed in [28]) was defined by following a methodology that consists primarily, in three steps:
Literature reviews: a systematic mapping study was conducted in order to explore how knowledge management practices are used in software process performance analysis. Additionally, literature reviews in software (e.g. [3][4][6]) and non-software areas (e.g. [17]) were conducted to identify relevant works in performance analysis.
Identification of a set of activities and tasks related to process performance analysis: based on literature reviews, the identification of activities and tasks was the first stage of the knowledge collection, and also triggered the identification of additional knowledge. Hereafter, we describe these activities and tasks and how they were evaluated.
Knowledge identification and organization: the required knowledge to execute each activity and task identified in step 2 has been collected and organized in the body of knowledge, as described in Section 3.2. This documented knowledge will be evaluated by experts in performance analysis via peer review.
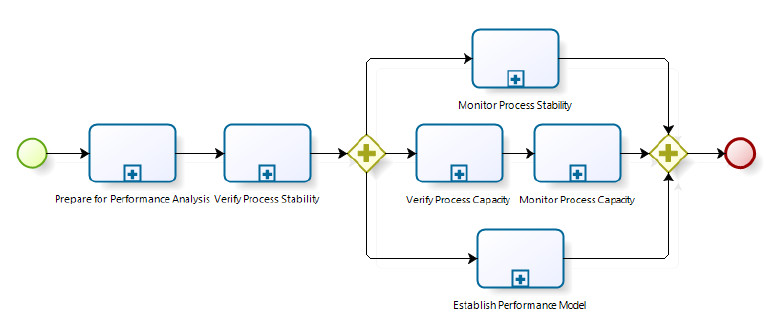
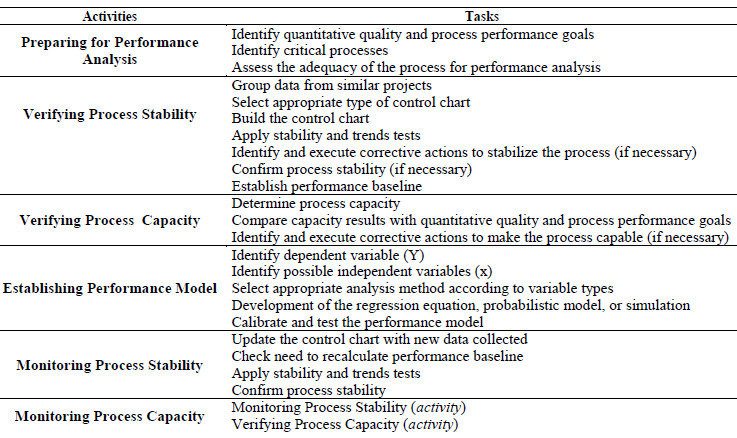
As mentioned earlier, in order to identify the required knowledge, a set of activities and tasks aimed at performance analysis was identified in the technical literature, both in the software development domain as in those not related to software (especially in the manufacturing area). These activities and tasks are summarised in Fig. 3 and detailed in Table I. They were the basis for the identification of the necessary knowledge to execute performance analysis properly.
Figure 3: Process Performance Analysis Activities
Table 1: Activities and Tasks in Process Performance Analysis
The first activity, named “Preparing for Performance Analysis”, aims at identifying the critical subprocesses based on organization’s quality and performance quantitative goals. Apart from that, this activity verifies whether the critical subprocesses meet the minimum requirements to execute performance analysis. The main knowledge items needed to carry this activity out are:
Manners to establish effective criteria to identify the critical subprocesses;
Techniques to support decision-making in the selection of critical subprocesses. Such as: Pondered Multi-voting, Multi-Criteria Analysis, Pareto Analysis, and Delphi;
Minimum requirements for a measure to be considered by performance analysis and how to establish corrective actions, if the measure is not appropriate.
From the selection of a critical subprocess and of adequate measures for performance analysis, the execution of the following activity, namely “Verifying Process Stability”, can start. In it, the type of control chart appropriate for the measure under analysis is chosen and built. The projects’ measures are plotted on the chart and the stability tests that correspond to the chart are applied.
If the subprocess is not stable, it is necessary to identify the cause of variation and, if possible, to eliminate it. The following knowledge items are needed to correctly execute this activity:
Context data for the projects that are included in the analysis;
Forms of analysis of similarity between the projects;
Types of control chart and types of data more appropriate for use;
]]> Applicability of stability tests for each type of control chart;Techniques to support the identification of possible special causes. For example, the Fishbone Diagram (Ishikawa Diagram), Pareto Analysis.
Assuming the process is stable, the following activities can be independently executed: “Verifying Process Capability”, “Establishing Performance Models” and “Monitoring Stability”.
The “Verifying Process Capability” activity aims at determining whether the process complies with organisation’s quality and performance goals. If the process is considered capable, the person responsible only has to monitor it to ascertain if it remains stable and capable through time, when new project measures are added to the analysis, as described in the “Monitoring Capability” activity. If the process is not capable, it is necessary to identify an appropriate corrective action, which may include the process improvement or the revision of the organisation's business goals. To execute this activity, the main knowledge items required are:
Techniques to determine the capability of the process. For example: histograms, capability indexes, Six Sigma;
How to carry out a cost-benefit analysis to choose the most appropriate corrective action.
Once the performance baseline has been created, the “Establishing Performance Models” activity can be executed. This activity aims at creating a mathematical model that lists some of the subprocess attributes, allowing the prediction of its future executions. In order to establish performance models, the main knowledge items required are:
Types of analytical methods (e.g., ANOVA, MANOVA, Chi-Square, Correlation Analysis, Regressive Analysis) and what types of data are most appropriate for each one;
]]> Simulation methods such as: Monte Carlo, Systems Dynamics, and Discrete Event Modelling.Finally, the “Monitoring Stability” activity aims at monitoring the stability of the process through time when new process measures, from the execution of the projects, are added. Basically, the same knowledge needed to execute the "Verifying Process Stability" activity is applicable to this one.
Given that the set of activities and tasks derived from literature review, we had to evaluate their adequacy according to experienced people in the field. Therefore, we conducted a peer review with people experienced in software process performance analysis aiming at answering the following questions [29]:
(Q1) What are the activities necessary to execute a software process performance analysis?
(Q2) What level of difficulty do the software organisations have when executing the activities for process performance analysis?
(Q3) What is the level of importance of the support provided by a specialist during the execution of the activities of process performance analysis?
(Q4) What is the sequence of activities in software process performance analysis?
(Q5) What is the dependence that exists among the activities in the software process performance analysis?
In general, the reviewers said they agreed with both the activities and tasks as well as with the sequence and dependencies between them. Nonetheless, some suggestions were made, especially to better detail the “Verifying Process Capability” and “Establishing Performance Models” activities and their respective tasks. Regarding the level of difficulty and the level of importance in support, it was found that the “Establishing Performance Models” activity was the one associated to the highest difficulty in execution and the greater need of specialist support. However, there was no agreement among the reviewers on the evaluation of the remaining activities, which suggests that some support is needed in them as well, albeit with an emphasis on the “Establishing Performance Models” activity.
In order to build the body of knowledge, the intent is to capture both the explicit and the tacit knowledge. In the context of this work, the explicit knowledge on performance analysis is found scattered in books, dissertations and theses and thus needs to be structured into one single structure to facilitate its access and learning. On the other hand, the tacit knowledge resides in the mind of specialists and therefore needs to be identified and captured (through interviews) to become explicit and available.
The knowledge that is explicit for performance analysis to be organised in the context of this work entails: (i) the description of activities and tasks, (ii) the description of techniques and methods that can be used to support its execution, and (iii) the rules based on which the environment provides the knowledge that is adequate, according to the results of the performance analysis done previously. A catalogue of the techniques and methods to carry out the performance analysis is available in [16]. It provides information such as: method description; context for method application; characteristics of the data to which the method is applied (type of data, size of sample, data distribution, etc.); and an example of application for the method in the software domain. Posteriorly, these techniques (and other knowledge) were organised in mind maps (which is described in Section 3.2)
The manner in which this knowledge is documented and presented can influence its understanding. Therefore, the KBS body of knowledge is provided in different ways, as follows: process (description of activities, as well as its sequences and dependencies), recommendations (techniques suggested according to the activity under execution), good practices (consensus amongst the specialists), and lessons learned (as done by the professionals, following the process performance analysis).
To provide and keep the body of knowledge needed to execute the process performance analysis, a knowledge-based system (KBS) is being developed. An initial version of this system was developed [30] and it is presented in this section.
The KBS aims to manage and provide the knowledge related to the activities and tasks for performance analysis. The main KBS’ functionalities are the knowledge record (which can be done currently in two formats, textual or mind map) and the knowledge visualization (during the execution of performance analysis activities).
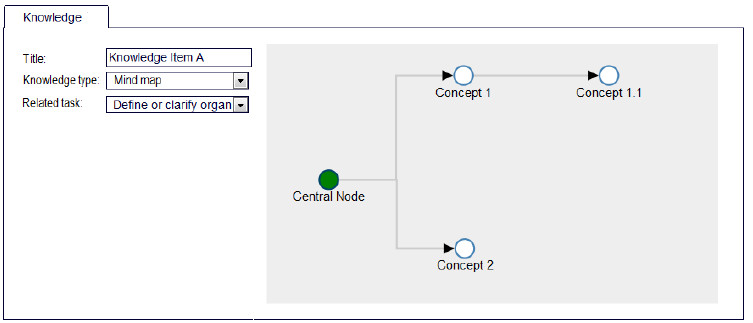
Regarding the knowledge record, the main feature is the mind map construction, which was developed using the D3.js framework [31]. Most knowledge in SPEAKER is defined by mind map. This format was selected due the opportunity that the user has to access the knowledge gradually, according his need. The Fig. 4 shows the structure which a knowledge item is described by a mind map. The central node represents the main concept that will be defined, and the related nodes represent a detail or a specific aspect of this concept. For each node the user can add more information about it, which can be accessed by a double click. Each knowledge item is recorded linking it to a given activity or task of performance analysis, as shown in the left side of Fig. 4.
Figure 4: Mind map structure for a knowledge item
Regarding the knowledge visualization, the knowledge items previously recorded are presented to the user during the execution of performance analysis, as shown in the highlight in Fig. 5. In this figure, we present how the user will interact with SPEAKER, which shows the performance analysis process (in the left side) and guides the user to a proper workflow between the activities and tasks. Besides that, the user can store the result execution of a given task by a textual description or by an attached document. Along with this process guide, the knowledge related to that specific task is shown in the right side. By clicking on a knowledge item, the mind map that describes this item will be presented and the user can see more information on demand about this item.
]]> Figure 5: Knowledge visualization for a given taskBy means of these two functionalities of KBS, the main activities in knowledge management are run, as follows:
Knowledge Identification and Acquisition: involves both explicit and tacit knowledge and is being done to create the initial body of knowledge of the SPEAKER environment, by recording it as mind maps. Later on, as the environment is used by the organisation, this activity should be undertaken by professionals in order to capture their understanding of performance analysis (from lessons learned) or as a result of the maintenance activity;
Organization and Storage: the knowledge should be organised and stored so to provide easy access and understanding to the professionals. For that the SPEAKER environment will adopt different ways to present the knowledge; in this first version, the knowledge is organized as: process (in terms of activities and tasks shown during the execution of performance analysis), textual description and mind maps; posteriorly, more formats will be allowed, as glossary and concept maps;
Retrieval and Utilization: this activity allows the knowledge to be used by the professionals to assist them in the execution of performance analysis, as shown in Fig. 5.
Maintenance: this activity is done in the specific domain of an organisation where the SPEAKER environment is being used. It allows the professional to record, modify or remove knowledge items according to one's needs. The knowledge maintenance is made in the same way as the knowledge record.
The Reusable Process Element Library, which is a part of the A2M environment as defined in [20], presents an approach to define processes based on reuse with the use of two definition strategies: bottom-up e top-down. This approach adapts concepts on software product reuse to the domain of process definition and relies on the support of tools to define process lines and process elements.
At this point, the library, which consists of two types of items, software process lines and process elements, is populated with process lines and elements (as defined in [32] and [33]) in the context of software development with acquisition.
This work defines and provides process lines and elements in this library for the process of software process performance analysis. Table 2 shows some of the process elements that were defined, their variability (when applicable) and the justification for defining the process element as required by MR-MPS-SW and CMMI-DEV maturity models and by ISO/IEC 15504 standard.
]]> Table 2: Some Process Elements for Process Performance AnalysisIn A2M, the process elements have the basic information of a process, such as: name, description, input and output criteria, responsible for execution, participants, support tools, and artefacts required and produced. The process components and process lines (detailed in [36]) was defined by following a methodology that consists mainly, in four steps:
Step 1: Define/Select process features for process line - The first step of the methodology is to define/select process features for process lines. These features serve to guide the definition of reusable elements and were generated from the set of needs that must be satisfied by the processes. The set of needs for the processes was based from the literature: General Guide MR-MPS-SW [4], CMMI-DEV [3], Wheeler and Chambers [17], Florac and Carleton [6]. From the set of needs were defined the features and the types of features associated to process lines and the process components.
Step 2: Define/select and characterize process elements of the process line - After defining the features process, the process elements have been defined and selected, when existing, for process lines. This step contains three activities: (i) define or select (if there are components available in Process Reusable Component Library) the process elements that are used to answer the features that have been defined; (ii) identify similarity and variability in these process elements, in other works, identify which parts that are common (concrete components or activities) for derived processes from the process line, and which parts may vary (abstract components); (iii) characterize the process components according with the process features selected in the step 1.
Step 3: Structure and characterize the process line - This step consists in structuring process lines from the process elements (process components and activities) defined in the previous step. For this step the following activities were carried out: (i) choice of optional components in the process line; (ii) definition of the connections between the process elements; (iii) determination of the mandatory or optionality of the connection; and (iv) mapping process characteristics directly to the process line.
Step 4: Verify and approve process line - The last step was to evaluate the process components and process lines defined are adequate and answer the established needs. In addition to assessing whether the definition applied correctly the concepts of the approach [20], for example, that all mandatory information has been fulfilled, if only abstract components have variations, etc.
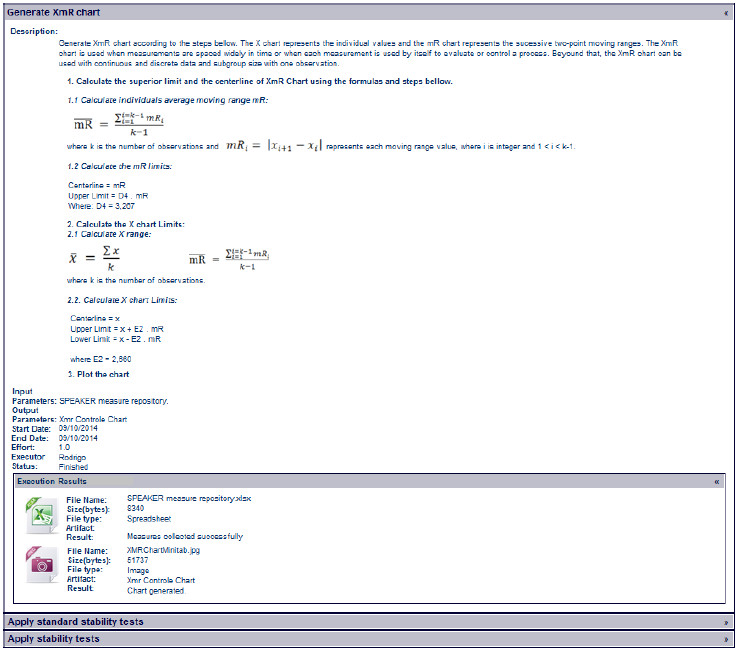
In this work, apart from the information mentioned earlier, the process components have a script that is related to the execution of such components and that will be used by the Process Instantiation and Execution Tool of the SPEAKER environment. Figure 6 gives a partial example of the concrete process component “Construct the XmR Control Chart with Minitab”.
To execute the script mentioned above, Statistica [34] and Minitab [35] tools were chosen at first, as they have functionalities related to the methods and techniques needed for process performance analysis. The script allows the generation and displaying of information that is important for performance analysis to the user, according to the needs at hand.
The process elements and process lines defined were evaluated in a peer review, to which was invited an experienced MPS evaluator, accredited with SOFTEX for high maturity. The result of the review showed non-conformances related to the internal structure of the components and to the description of components and activities. Besides these non-conformances, the reviewer presented some suggestions for improvements, which caused the definition of new process components and activities.
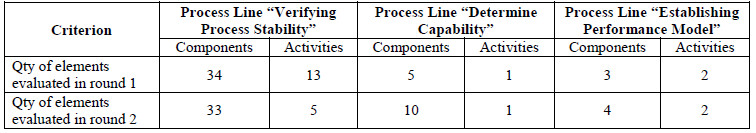
]]> Figure 6: Process component “Construct XmR Control Chart with Minitab” [36]The main suggestion for improvement refers to the description of process components and activities, adding new information to the components related to the control charts. A summary of the quantity of process elements evaluated is provided in Table 3.
Table 3: Process Elements Evaluated in Peer Review
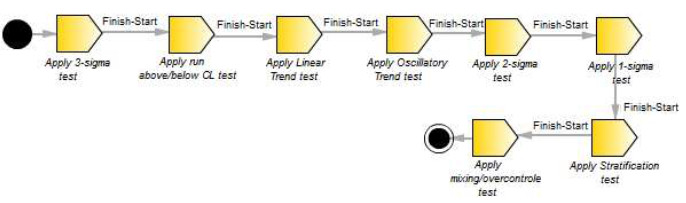
The first peer review round evaluated 42 process components, 16 activities, and 3 process lines. Of the 13 activities part of process line “Verifying Process Stability”, 8 activities were part of a component (Fig. 7) that described stability tests for a type o specific chart and were re-structured in the process component format. These activities were re-structured in the process component format to better attend the concepts for the reuse of the approach used, as the stability tests are the same for different chart types.
Figure 7: First version of process component “Apply Tests on Chart X”
In the new format (process component) the information from the stability tests are shown in the component description. Apart from these components, an additional component “Apply complementary stability tests” was created as a way to cover all the stability tests identified in the literature.
For the “Determine capability” process line, 5 new components were defined to represent the new variants of the “Determine capability” abstract component. Apart from that, for the “Establishing performance model” process line the “Calibrate and test the performance model” process component was defined. The version evaluated in the second round of the review, which is the present version, has 47 process components, 8 activities, and 3 process lines, as shown in Table 2.
The SPEAKER environment also provides a tool support for the instantiation and execution of the process of performance analysis. This tool receives requests from the KBS regarding the technique that should be used in the next step of the performance analysis, selects the adequate process element from the Reusable Process Element Library to build the process line, and executes the process defined.
The tool for the instantiation and execution of the process (FIE) aims at supporting the instantiation and execution of the process of software processes performance analysis. For that, the tool meets the following requirements [35]:
R01 – The FIE tool must support the instantiation of the software process performance analysis based on process elements available in the Reusable Process Elements Library, and according to the analysis made by the KBS;
]]> R02 – The FIE tool must support the execution of the performance analysis activities and store the results of such execution;R03 – The FIE tool must provide the results of the execution of the activities to the KBS.
R04 – The FIE tool must control the execution of one single activity more than once, according to the characteristics of the subprocess analysed.
R05 – The FIE tool can only execute concrete process components. If the KBS send an execution request for an abstract component, the FIE tool will send an error message to inform about this problem.
R06 – The FIE tool only implement two levels of execution to the internal architecture of a component. This means that if a concrete component have another concrete component in your internal architecture and this second one have also another concrete component in your internal architecture the FIE tool will only execute the first and second component. This rule was created to avoid too many levels of execution.
R07 – Every process element executed in a specific execution of a process line analysis has to have a value for the attribute related to the use of the execution results to define the analysis result. This rule was created to support the generation of final version of the process executed.
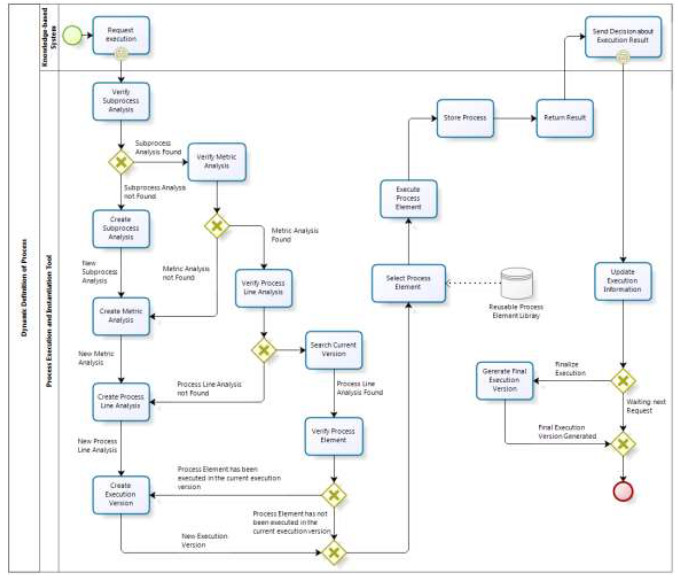
In order to meet the requirements, the FIE has a workflow activities, shown in Fig. 8. In the context of the execution of the workflow for dynamic definition of the processes, the activities are under the responsibility of the FIE and the events are carried out by the KBS.
Figure 8: Workflow of FIE activities
After defining the FIE tool requirements, we defined the structure need to store the information about the process performance analysis and functionalities supported by the FIE tool (more detail can be checked on [37]). The three main functionalities are: (i) follow process execution, where the user can register the information about the execution and results of a process element; (ii) consult realized analysis, where the user can find all the information about the execution, and; (iii) consult final version executed, where the user can find the information about the final version executed from a specific analysis executed.
]]> The next step was to define the methods to support the integration with KBS. The methods are: (i) insertProcessElement, responsible to generate all the structure need to store the information; (ii) updateExecutionResult, responsible to update the information about the attribute related to the use of the execution results, and; (iii) consultExecuteResult, responsible to return a list with the execute results of a process element specific.The execution of this workflow allows the performance analysis process to be defined dynamically, according to the organisational context and in line with the characteristics of the process under analysis. This also allows the iteractivity needed for the process of performance analysis. The workflow was modelled so that the process has more than one version executed. This happens when there is a need to execute one same process element more than once.
Apart from the workflow of activities, the functionalities of the tool were also defined. For the implementation of the functionalities and for the running of the communications made with the KBS, the FIE expects receiving the following information, as required to identify the software process to be analysed, and the choice of process element to be executed: (i) the company responsible for the definition of the software development process to be analysed; (ii) the subprocess in the software development area that will be analysed; (iii) the measure that will be analysed as related to the subprocess under study; (iv) the library element that will be executed by the FIE.
The process execution begin with a request sent by KBS, after that, the FIE tool will evaluate if the information of subprocess sent (organization, subprocess, metric and process line) are already registered on the tool base. Using the information sent by KBS, the FIE tool will also verify the need to instantiate a new execution version or continue in the current version. After the evaluation, the FIE tool selects the information of process element from a database of reusable process elements and organizes then, to help the user executes the process element and store the execution results. The next step is to deliver the execution results to KBS.
After those steps the FIE tool wait the answer from KBS about the use of the execution results to define the analysis result, and then update this information on its base. This information is used to generate the final version executed of the process performance analysis.
Amongst the functionalities of the tool the following can be pointed:
Receiving and evaluating the data for process execution: Responsible for receiving and evaluating the information that will be sent via the KBS. The evaluation relates to the control of execution of the same process element, more than once. This functionality has three different outputs, as shown in Fig. 7.
Creating a new Analysis and/or Version of the execution: Responsible for creating a new Analysis of the information items, that is, instantiating the process of performance analysis. The version is related to the instantiated process and will be used to control the versions of the process elements executed.
Selecting a process Element: Responsible for seeking and select the process element in the Library, according to the information sent by the KBS.
Executing a process Element: The execution of the process element provides the information recorded in the reusable process element library to help the execution of the task, such as: Name, Description, Input and Output Criteria, Input and Output Parameters, and the script associated to the element. From this information the user of the tool will be able to execute and record the information on the results obtained.
]]> Informing script parameter values: Responsible for storing the values of the parameters defined for the scripts associated to the elements. At the end of the registration the FIE provides the script with the parameter values filled in and ready for execution in the defined tool.Storing the result of the execution and sending the information to the KBS: Responsible for grouping the results from the execution of process element activities, storing them and then sending them to the KBS.
Generating baseline for the process executed: At the end of the process for performance analysis for a specific analysis, this functionality will be executed to store the baseline of the process executed. The process baseline will be based on the versions created for the control of process execution.
The evaluation of the FIE tool was carried out using an example adapted from the literature. Three scenarios were executed, as can be seen in [37], based on three process lines defined by [36]: (i) Verifying Process Stability; (ii) Determine Capability, and; (iii) Establishing Performance Model. We simulated the integration with the KBS, because at this moment its development is not finished yet. Despite of the scenarios are fictitious, they are very similar with the reality found on software organizations.
An example of use in a hypothetical setting is provided in order to show how the SPEAKER environment can help the execution of a performance analysis in a software development organisation. The presented scenario derived from the professional experience of the authors as well as from the results provided by the literature review. The presented example covers only the “Verifying Process Stability” activity (as shown in Table 1).
The Alfa organisation develops corrective and evolutive improvements for its software products. Each project has a mean duration of a month. The organization is appraised in CMMI level 3 and its high management decided to start the efforts to implement CMMI level 4. As the Alfa organisation has no consultant to support the improvements needed to get to CMMI level 4, some members of its Software Process Expert Group (SEPG) should start studying the concepts needed to execute performance analysis and to implement the process. To assist in this task, the SPEAKER environment is used.
We assume that the “Prepare for Performance Analysis” activity has already been executed and therefore the organisation has already identified a set of critical subprocesses and that the adequacy of the measures of these subprocesses has already been checked. To carry out the “Verifying Process Stability” activity, the topmost priority subcritical process was selected (Develop software), as well as its most relevant measure (Effort to code per requirement).
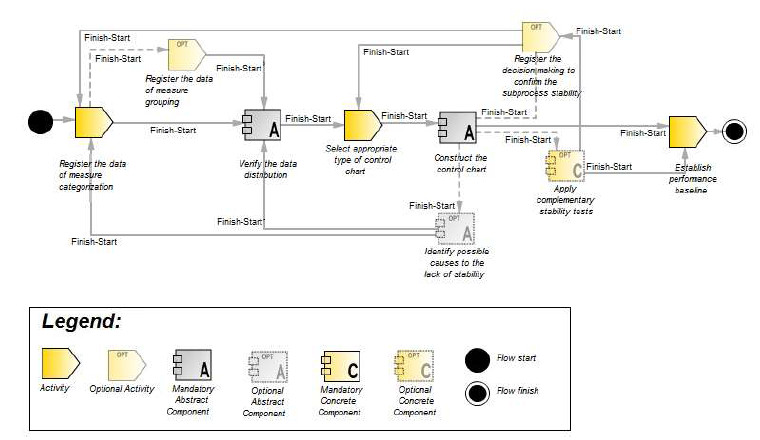
Table 3 shows the tasks and examples of the knowledge items to be made available by the SPEAKER body of knowledge to the “Verifying Process Stability” activity. Fig. 9 shows the process line related to this activity.
“Effort to code per requirement” is usually collected in a spreadsheet supplied by the SPEAKER environment. The spreadsheet has data of all organisations’ projects. The following attributes are collected at each measurement: project name, data for project characterisation (project size, version of the development process used, development technology used, team profile, project complexity, client, life cycle stage), activity in the development process, artefact produced by the activity, name of the measure collected, scale of measure, type of measure (variable or attribute), date of collection and value of collection. Depending on the characteristics of the organisation, some of these attributes do not need to be advised. In the case of the Alfa Organisation, the "client" attribute does not have to be filled in as the organisation keeps a product, therefore, not developing it specifically for a client.
]]> Table 3B: Tasks and Knowledge Items for the “Verifying Process Stability” activityFigure 9: Process Line for the "Verifying Process Stability” activity
After the user indicates the start of the “Verifying Process Stability” activity in the SPEAKER environment, the KBS presents the knowledge items required to execute the first task (“Group data from similar projects”), and signals the FIE on the start of process execution. The FIE, on its turn, starts the process line instantiation. For this task, the KBS assists the process group members to identify the need to create subgroups (presenting the concept of homogeneous subgroups and examples of when their creation is needed), and assists in the identification of similar projects (presenting concepts and techniques on project similarity).
Based on the indications provided by the KBS, the process group chose not to create subgroups, the analysis goal is to check Develop Software subprocess behaviour as a whole. However, a need was found to conduct the analysis in separate for projects that use the desktop technology from projects that use a Web technology. This way, the data was split into two groups and the data on the projects that use desktop technology was studied first (as shown in Table 3C). This information was recorded by the user with the FIE.
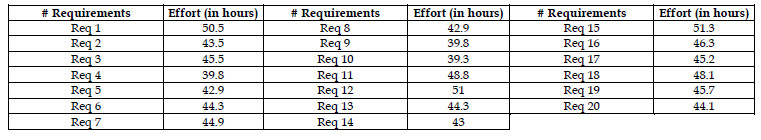
Table 3C: “Effort to code per requirement” values for desktop projects
In order to execute the next “Select appropriate type of control chart” task it is necessary to know the measures distribution. For that, the Library provides a reusable process element, which contains a script to assist its execution. As the Alfa Organisation uses the Minitab tool, the process element chosen was the one related to this tool. By running the Minitab script, it was found that the data followed a normal distribution. Based on the data distribution information and on the scale and type of the measure (interval and variable, respectively, already indicated in the Measure Spreadsheet), the KBS presents the control chart type adequate to that context (i.e., XmR chart), informing its applicability and examples of use.
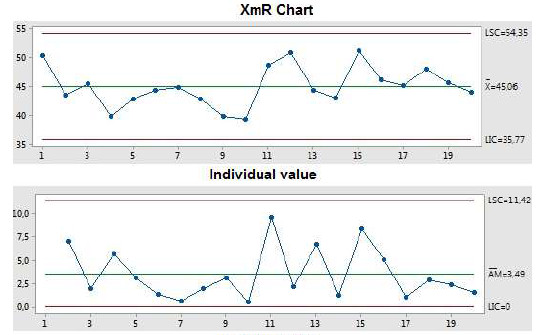
After choosing the XmR chart to carry on with the analysis, the process group member execute the tasks “Construct a Control Chart” and “Apply Stability and Trend Tests”. For that, the reusable process element specific for the XmR chart provided by the Library is executed by FIE. This execution involves the calculation of the control limits and the generation of the control chart, as well as the running of the stability tests appropriate for the chart at hand. The chart generated is shown in Fig. 10 and the result of the stability tests is presented in a spreadsheet. In the future, the presentation of the stability tests will be streamlined to allow a better understanding.
Figure 10: XmR control chart for the “Develop Software” subprocess
According to the results of the stability tests there are signs that the “Develop Software” subprocess is stable. This way, the next activity to be executed by the process group member is “Confirm Stability”. KBS may suggest the data to be analysed based on other control chart, according to analysis’ goal and to the data characteristics. From the suggestions presented, the process group member chooses not to carry out other analyses, as he/she did not see it as feasible for this data set.
Given that the subprocess is stable, the last activity to be executed is “Establish Performance Baseline” from which the control limits and the centerline are stored for later use both in the remaining performance analysis activities and in the quantitative management of the organisation’s projects .
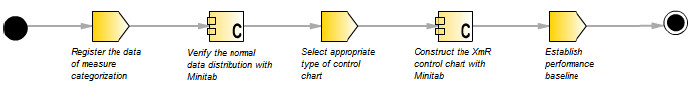
]]> Figures 11 and 12 show the support offered by FIE in the execution of the performance analysis. Fig. 12 shows the workflow of process elements executed, the subprocess and the measure analysed. Fig. 13 shows the result of executing the “Construct XmR Chart” component, which is a process element executed by the “Construct XmR control Chart with Minitab” component (Fig. 6).Each process element shown in the workflow depicted in Fig. 12 was executed separately according to the need of information (as described in the example of use). The results from all the executions are stored in FIE, in the format shown in Fig. 12, thus allowing KBS to access this data to carry on with the workflow execution.
Figure 11 shows the final workflow version instantiated from the process line “Verifying Process Stability”. It is worth notice the differences from the original version shown on Fig. 9, which presents all the possible components variations. The final version depicted in Figure 11 presents all the concrete components and activities executed according with KBS.
In order to characterise in the literature the use of knowledge management practices to support the performance analysis for software processes, a systematic mapping was conducted. A systematic mapping study is designed to provide a wide overview of a research area [38]. The main goal of this systematic mapping study was to identify papers that (i) report difficulties, problems or challenges regarding knowledge issues in the process performance analysis, and (ii) suggest or describe the use of knowledge management methods or techniques to deal with these difficulties, problems, or challenges. The study’s planning and results are fully presented in [16], in this paper we present only a summary due to space limitations.
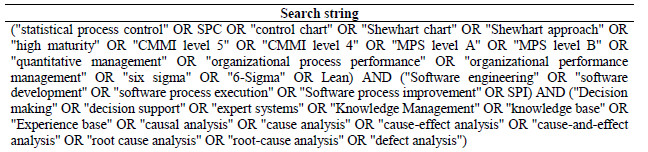
In order to help the definition of the search string that led us to identify potential relevant publications we identified control papers. After executing several tests, the final search string was established as presented in Table 4.
Table 4: Search string used during the mapping study
]]> The selection of studies was performed in three phases. In the first phase, we selected publications based on the application of the search string to the selected sources (Compendex http://www.engineeringvillage.com, IeeeXplore http://ieeexplore.ieee.org/, Scopus http://www.scopus.com/, Web of Science http://www.isiknowledge.com/) and manually (a manual search was also conducted in order to include some conferences and magazines that usually present works about process performance analysis, and are not indexed by a search engine.) In the second phase, the abstracts of the publications retrieved were read and analysed according to established inclusion and exclusion criteria. In the third phase, all remaining publications in scope were entirely read, for checking whether, in fact, they meet at least one of the inclusion criteria and any of the exclusion criteria.The execution of the protocol was performed in two rounds: the first one between February and April 2012, and the second in March 2013. In the first execution, we were able to identify 77 publications by using the search engines and 2 publications from manual research. After the selection phase, only 6 publications met at least one of the inclusion criteria and, thus, they were considered relevant to the study.
In March 2013, we performed the same protocol for the second time, to check the existence of new publications in the area. We decide to use only the search engines due the low cost-benefit of the manual search. In this round, 13 new publications we retrieved but none met at least one of the defined criteria.
Four of the publications considered relevant to the study describe the same approach applied in different contexts ([39][40][41][42]). This approach is the only one identified that deals with knowledge management practice to support process performance analysis. The SPC-Framework [39] was the only approach identified in the software area that proposes some knowledge management practices to assist in the execution of performance analyses. This approach offers: (i) a set of tests to be applied to the control charts; (ii) the interpretation of the tests from a software standpoint; (iii) an inquiry process to guide the stability analysis; and (iv) a database to collect the experiences during the use of the process, by implementing decision tables.
The other two publications selected in this study have provided no details about supporting knowledge in process performance analysis. In [43], an example of statistical decision-making is presented to determine when to stop software testing (also known as optimal release problem). The proposed method uses control charts (moving average), but the publication lacks information about how the control charts are interpreted or the decision is made.
In [8], there is no description of using a specific approach. However, the authors describe the deployment of statistical analysis techniques in a software organization and summarize some associated difficulties. Among these difficulties, we highlight: (i) the need to supply training to all stakeholders; (ii) the identification of good processes as targets for statistical management; and (iii) the potential chances for mistakes and misunderstandings associated with statistical analysis.
Based on the systematic mapping study limited results, non-structured literature reviews were executed to better ground the proposed system. These reviews considered non-related software areas. We identified some works, especially in the manufacturing area. One of these works is an expert system, proposed by Bag et al. [44], which aims to assist in the identification of instability patterns in the control charts. According to the authors this specialist system can plot control charts, identify instability patterns, calculate the capability index, identify possible root causes, and suggest actions.
Another work in the manufacturing area, focused on the capture and provision of the knowledge needed to carry out a process performance analysis is the tutor system presented in [45]. The tutor system provides knowledge to assist in the selection, construction, and interpretation of the control charts, having as its main focus the selection of the most appropriate control chart. The tutor system is based on pre-set rules that direct the user to make the selection and interpret the control charts.
Besides the low number of works in this area, the works identified have some important drawbacks that can harm the execution of process performance analysis. Among the limitations are: most of them support the analysis with only one type of control chart; they not deal with the process of performance analysis as a whole but only for some activities; and they do not take into consideration the context information during the analysis. The use of the SPEAKER environment aims at supplying or minimizing these limitations.
We expect the SPEAKER environment to support software development organisations to undertake the performance analysis of their software processes in an adequate way, considering their organisational settings and correctly applying the associated concepts and techniques. This way, the SPEAKER environment will work as a guide/assistant that will lead the professional in the execution of the performance analysis activities. In addition, with the availability of the body of knowledge from the SPEAKER environment, we expect to facilitate the learning process on performance analysis in the software domain.
]]> In this paper, we described each SPEAKER environment module. Also we presented an example of its use in executing process performance analysis. The KSB module guides the user to properly execute the activities and tasks of performance analysis based on the results of previous activities. Besides that, during the process performance analysis, it provides the knowledge needed to execute each activity and task, in a way that the professional in charge can access the knowledge in the adequate detail level needed. The Reusable Process Elements Library module contains definitions of process elements that support the instantiation of a performance analysis process based on its variability. FIE, other SPEAKER module, allows dynamic definition of the performance analysis process based on the process elements from the Library and the knowledge provided by KBS. Besides that, FIE stores the results of activities execution, allowing the KBS to decide which knowledge needs to be presented at that moment, according to the result of each execution.All SPEAKER modules are totally developed, but their integration is not completed yet; so, the integration of these modules is the main next step in this work. Furthermore, it is necessary to finalise the collection, organisation and storage of tacit and explicit knowledge in the body of knowledge. As future work, we consider the idea of generate the control charts and run the stability tests automatically in the FIE tool, instead of use externals tools.
The SPEAKER environment evaluation has been carried out via individual evaluations of its modules. Posteriorly, when the environment is entirely integrated, evaluations of the environment as a whole will be executed.
As regards the evaluation of the KBS, a first assessment was done via a peer review with specialists in performance analysis for software processes to check the level of adequacy and correctness of the activities and tasks identified in this work. Following the full organisation and structuring of the body of knowledge, peer reviews will be conducted by specialists in the corresponding areas. We aim to evaluate aspects such as (i) the sufficiency of the knowledge provided when supporting non-experts in executing process performance analysis, and (ii) the adequacy of the knowledge presentation with respect to the stakeholders’ needs. The specialists will be selected due to their participation in the implementation of high maturity levels in Brazilian organisations or among the qualified assessors able to perform appraisals of such maturity levels.
Also SPEAKER environment will be evaluated as a whole to verify whether it attains the goal of assisting non-specialist people in the execution of process performance analysis. To this end, SPEAKER will be used in the real context of a software development organisation that is preparing to execute performance analysis of its software processes. We aim at qualitatively evaluating the perception of different user profiles (as regards their knowledge of process performance analysis) when executing the performance analysis activities as assisted by SPEAKER. At this end, in a specific organisational context, we will invite software process improvement consultants (who support organizations to attain of high maturity levels) and Software Engineering Process Group members (who are responsible to implement high maturity levels practices) to execute some performance analysis activities supported by SPEAKER. We will qualitatively evaluate, according the users’ perceptions: (i) the feasibility of the environment, i.e. if the time spent to execute these activities is reasonable and if the activities result is suitable; and (ii) the usability of the environment, especially due the knowledge presentation and the integration with external tool (e.g. Minitab and Statisitca).
Acknowledgements
Authors would like to thank CNPq, CAPES and FAPERJ (project E-26/110.438/2014) for their financial support.
References
[1] A. Fuggetta, “Software Process: A Roadmap”. In: The Future of Software Engineering, ICSE 2000, Ireland, 2000.
[2] ISO/IEC, ISO/IEC 15504: Software Engineering – Process Assessment – Part 2: Performing an Assessment, International Organization for the Standardization and International Electrotechnical Commission, 2003.
[3] CMMI Product Team, CMMI® for Development (CMMI-DEV), V1.3, Software Engineering Institute, 2010. Available from http://www.sei.cmu.edu/ . Accessed in October 2014.
[4] SOFTEX, Brazilian Software Excellence Promotion Association, MR-MPS-SW – General Guide, 2013, Available from http://www.softex.br/mpsbr . Accessed in October 2014.
[5] G. H. Travassos, M. Kalinowski, “iMPS 2012: Evidências sobre o Desempenho das Empresas que Adotaram o Modelo MPS-SW desde 2008”, Campinas, SP, 2013. (in Portuguese)
[6] W. A. Florac, and A. D. Carleton, Measuring the Software Process: Statistical Process Control for Software Process Improvement, Addison Wesley, 1999.
[7] R. Mahanti, J. R. Evans, “Critical success factors for implementing statistical process control in the software industry”, Benchmarking: An International Journal, vol. 19(3), pp.374 – 394, 2012.
[8] D. Card, K. Domzalski, and G. Davies, “Making Statistics Part of Decision Making in an Engineering Organization”, IEEE Software, 25(3), pp. 37-47, 2008.
[9] C. Hale, and M. Rowe, “Do not Get Out of Control: Achieving Real-time Quality and Performance”, CrossTalk, v. 25 (1), pp. 4-8, 2012.
[10] Softex (2014) “Avaliações MPS Publicadas”, available from www.softex.br/mpsbr/ .
[11] CMMI Product Team. “Maturity Profile Reports – CMMI® for SCAMPI v1.2/v1.3 – Class A Appraisal Results”, Software Engineering Institute, Carnegie Mellon University Pittsburgh, 2013. Available from http://cmmiinstitute.com/resource/process-maturity-profiles/ .
[12] A.Tarhan, and O. Demirörs, “Investigating Suitability of Software Process and Metrics for Statistical Process Control”, Software Process Improvement, LNCS, vol. 4257, pp. 88-99, 2006.
[13] J. L. Boria, “What’s Wrong With My Level 4?”, Personal Communication, 2007.
[14] C. Simões, M. Montoni, J. Silva, T. Anginho, V. Barbosa, “Aplicando Controle Estatístico de Processo em Projetos Evolutivos de Pequeno Tamanho: Resultados e Lições Aprendidas na Implementação do Nível 5 do CMMI-DEV na Synapsis”, In: XII Simpósio Brasileiro de Qualidade de Software (SBQS), pp. 286-293, 2013.
[15] Z. Xiuxu, M. Yu-Bao, C. Rui, B. Xiao-Li, N. Lin-Yan, “Research and Application of Intelligent Quality Control System Based on FMEA Repository”. In Proceedings of the 2009 International Conference on Information Technology and Computer Science (ITCS '09), Vol. 2, pp. 514-517, Washington, DC, USA, 2009.
[16] N. C. L. Schots, “Um Ambiente Baseado em Conhecimento para Análise de Desempenho de Processos de Software”, Exame de Qualificação, Universidade Federal do Rio de Janeiro, 2013. (in Portuguese)
[17] D. J. Wheeler and D. S. Chambers, Understanding Statistical Process Control, 2ª ed., SPC Press, Inc, 1992.
[18] J. A. Clark, and F. Soliman, “A Graphical Method for Assessing Knowledge-based Systems Investments”. Logistics Information Management, 12(1/2), pp. 63-77, 1999.
[19] A. Abecker, A. Bernardi, K. Hinkelmann et al. “Toward a Technology for Organizational Memories”. IEEE Intelligent Systems, 13(3), pp.30-34, May, 1998.
[20] M. J. Eppler, R. A. Burkhard, “Visual representations in knowledge management: framework and cases”, Journal of Knowledge Management, v.11 (4), pp. 112-122, 2007.
[21] R. A. Burkhard, “Knowledge Visualization: The Use of Complementary Visual Representations for the Transfer of Knowledge”, Dsc dissertation, Swiss Federal Institute of Technology Zurich, 2005.
[22] L. P. Gonçalves, “Apoio ao Controle Estatístico de Processos de Software integrado a um ADS”, MSc Dissertation, Universidade Federal do Pará, 2012. (in Portuguese)
[23] A. Barreto, “Uma Abordagem para Definição de Processos Baseada em Reutilização Visando à Alta Maturidade em Processos”, Dsc Dissertation, Universidade Federal do Rio de Janeiro, 2011. (in Portuguese)
[24] N. C. L. Schots, T. G. Gonçalves, R. F. Magalhães, A. R. C. Rocha, G. Santos, K. Oliveira, “Supporting Software Process Performance Analysis through a Knowledge-based Environment”. In: Proceedings of the XL Latin American Computing Conference (CLEI 2014), p. 286-297, Montevideo, Uruguay, 2014.
[25] A. S. Barreto, “Definição e Gerência de Objetivos de Software Alinhados ao Planejamento Estratégico”, Dsc Dissertation, Universidade Federal do Rio de Janeiro, 2011. (in Portuguese)
[26] C. A. Simões, “Repositório de Medidas para Organizações de Alta Maturidade em Processos de Software”, MSc Dissertation, Universidade Federal do Rio de Janeiro, 2011. (in Portuguese)
[27] H. Huang, “Designing a Knowledge-based System for Strategic Planning: A Balanced Scorecard Perspective”. Expert Systems with Applications, v. 36, pp. 209–218, 2009.
[28] N. C. L. Schots, A. R. C. Rocha, G. Santos, “A Body of Knowledge for Executing Performance Analysis of Software Processes”. In: Proceedings of the Twenty-Sixth International Conference on Software Engineering & Knowledge Engineering (SEKE 2014), p. 560-565, Vancouver, Canada, 2014.
[29] N. C. L. Schots, A. R. C. Rocha, G. Santos, “An Evaluation of Software Process Performance Analysis Activities: Insights from Different Viewpoints”. In: Euromicro Conference series on Software Engineering and Advanced Applications (SEAA 2015), Funchal, Madeira, Portugal. (to appear)
[30] R. H. Busquet, “Uma Ferramenta para Gerência do Conhecimento no Ambiente SPEAKER”, Undergraduate Project, Universidade Federal do Rio de Janeiro, march/2015. (in Portuguese)
[31] M. Bostock, “D3.js - Data Driven Documents”, Available from: http://d3js.org . Acessed in may/2015.
[32] E. D. Nunes, “Definição de Processos de Aquisição de Software para Reutilização”, MSc Dissertation, Universidade Federal do Rio de Janeiro, 2011. (in Portuguese)
[33] F. S. Cardoso, “Definição de Processos Reutilizáveis para Projetos com Aquisição”, MSc Dissertation, Universidade Federal do Rio de Janeiro, 2012. (in Portuguese)
[34] StatSoft, “Statistica”, available from http://www.statsoft.com . Accessed on April 2014.
[35] Minitab Inc, “Minitab”, available from http://www.minitab.com/ . Accessed on April 2014.
[36] T. G. Gonçalves, “Componentes de Processo para Análise de Desempenho de Processos de Software”, MSc Dissertation, Universidade Federal do Rio de Janeiro, july/2014. (in Portuguese)
[37] R. F. Magalhães, “Instanciação e Execução do Processo de Análise de Desempenho de Processos de Software no Ambiente SPEAKER”, MSc Dissertation, Universidade Federal do Rio de Janeiro, march/2015. (in Portuguese)
[38] Kitchenham, B., Charters, S. 2007. Guidelines for performing Systematic Literature Reviews in Software Engineering, Technical Report EBSE 2007-001, Keele University and Durham University Joint Report.
[39] T. Baldassarre, N. Boffoli, D. Caivano, G. Visaggio, “Managing Software Process Improvement (SPI) through Statistical Process Control (SPC)”, In: Proceedings of 5th International Conference on Product Focused Software Process Improvement (PROFES’04), pp. 30-46, 2004.
[40] T. Baldassarre, N. Boffoli, D. Caivano, G. Visaggio, "Improving dynamic calibration through statistical process control", In: Proceedings of the 21st IEEE International Conference on Software Maintenance Software Maintenance ( ICSM'05), pp. 273- 282, 2005.
[41] D. Caivano, “Continuous Software Process Improvement through Statistical Process Control”. In: Proceedings of the Ninth European Conference on Software Maintenance and Reengineering (CSMR '05), pp. 288-293, Manchester, UK, 2005.
[42] N. Boffoli, “Non-Intrusive Monitoring of Software Quality”. In: Proceedings of the Conference on Software Maintenance and Reengineering (CSMR'06), pp. 319-322, Bari, Italy, 2006.
[43] M. Kimura, and T. Fujiwara, "A New Criterion for the Optimal Software Release Problems: Moving Average Quality Control Chart with Bootstrap Sampling", Communications in Computer and Information Science (CCIS), vol. 59, pp. 280-287, 2009.
[44] M. Bag, S. K. Gauri and S. Chakraborty, “An Expert System for Control Chart Pattern Recognition”. International Journal of Advanced Manufacturing Technology, v. 62 (1-4), pp. 291-301, 2011.
[45] S. M. Alexander, and V. Jagannathan, “Advisory System for Control Chart Selection”, Computers & Industrial Engineering, v. 10 (3), pp. 171-177, 1986.