 (1)
(1)
Thelma Elita Colanzi, Wesley Klewerton Guez Assunção, Aurora Trinidad Ramirez Pozo
Federal University of Parana (UFPR), Computer Science Postgraduate Program
Curitiba, Paraná, Brazil
{thelmae, wesleyk, aurora}@inf.ufpr.br
Ana Cristina B. Kochem Vendramin1,2, Diogo Augusto Barros Pereira2
]]> Federal Technological University of Parana (UTFPR),1Informatics Department (DAINF)
2Graduate School of Electrical Engineering and Computer Science (CPGEI)
Curitiba, Paraná, Brazil
cristina@dainf.ct.utfpr.edu.br, diogoutfpr@gmail.com
Carlos Alberto Zorzo
Alto Vale do Rio do Peixe University (UNIARP), Informatics Department
Caçador, Santa Catarina, Brazil
]]> zorzo@uniarp.edu.br
and
Pedro Luiz de Paula Filho
Federal Technological University of Parana (UTFPR), Informatics Department
Medianeira, Paraná, Brazil
Abstract
Clustering analysis includes a number of different algorithms and methods for grouping objects by their similar characteristics into categories. In recent years, considerable effort has been made to improve such algorithms performance. In this sense, this paper explores three different bio-inspired metaheuristics in the clustering problem: Genetic Algorithms (GAs), Ant Colony Optimization (ACO), and Artificial Immune Systems (AIS). This paper proposes some refinements to be applied to these metaheuristics in order to improve their performance in the data clustering problem. The performance of the proposed algorithms is compared on five different numeric UCI databases. The results show that GA, ACO and AIS based algorithms are able to efficiently and automatically forming natural groups from a pre-defined number of clusters.
]]>Resumo
A Análise de Agrupamento inclui um número de diferentes algoritmos e métodos para agrupamento de objetos em categorias a partir de suas características similares. Recentemente, um esforço considerável tem sido realizado visando à melhoria de desempenho de tais algoritmos. Neste sentido, este artigo explora três diferentes meta-heurísticas bioinspiradas no problema de agrupamento, sendo elas: Algoritmos Genéticos (AG), Otimização por Colônia de Formigas (OCF) e Sistemas Imunológicos Artificiais (SAI). Este artigo propõe alguns refinamentos a serem aplicados a estas meta-heurísticas visando melhorar seu desempenho no problema de agrupamento de dados. O desempenho dos algoritmos propostos é comparado usando cinco diferentes bases de dados numéricas da UCI. Os resultados mostram que os algoritmos são capazes de formar grupos automática e eficientemente a partir de um número pré-definido de clusters.
Keywords: clustering problem; genetic algorithms; ant colony optimization; artificial immune systems
Palavras-chave: problema de agrupamento de dados; algoritmos genéticos; otimização por colônia de formigas; sistemas imunológicos artificiais
Received: 2011-03-30 Revised: 2011-10-06 Accepted: 2011-10-06
]]> 1 Introduction
Many researchers from different areas face a general question of how to organize observed data into meaningful structures, that is, to develop taxonomies; this question is answered by clustering analysis. Clustering analysis is an exploratory data analysis tool which aims at sorting different objects into groups in a way that the degree of association between two objects is maximal if they belong to the same group and minimal otherwise. Then, clustering analysis can be used to discover structures in data without any prior knowledge. The resulting taxonomies must meet the following properties: homogeneity within the clusters and heterogeneity between clusters [1][2]. Thus, it is desirable to obtain the greatest similarity between data points into a cluster and the greatest dissimilarity between data points from different clusters. One of the approaches used to solve clustering problems is the use of cluster centers that are imaginary points in the search space. Each point is classified using Euclidean distance metric to the nearest center.
Metaheuristics, such as Genetic Algorithms (GA), Ant Colony Optimization (ACO), Artificial Bee Colony (ABC) algorithm, and Artificial Immune System have been efficiently used to achieve optimal or approximately optimal solutions without requiring prior knowledge about the data set to be clustered [3][4][5][6][7][8]. In a previous work [9], GA and ACO algorithms were refined using local search in order to improve the clustering accuracy. Experimental results on five different databases provided evidences that GA and ACO are suitable metaheuristics to deal with this problem.
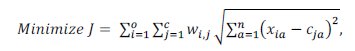
This paper extends the study in [9] by adding a third group of algorithms: Artificial Immune Systems (AIS) [10]. AIS cover algorithms inspired by the principles and processes of the vertebrate immune system. These algorithms represent a new approach and its application to clustering deserves to be studied. Here, GA and ACO algorithms and their refinements through local search, and AIS algorithms were developed to solve clustering problem. This paper presents them and their results on five databases corroborate that these metaheuristics are effective to deal with the problem. The objective function aims at minimizing the square root of the sum of the squares of the differences between each object and its respective center.
The rest of this paper is organized as follows. Section 2 presents the data clustering problem and related works. Section 3 addresses the bio-inspired metaheuristics: GA, ACO and AIS. Section 4 explains empirical studies performed using these metaheuristics on data clustering and Section 5 compares the different approaches. Finally, concluding remarks are given in Section 6.
2 Clustering Algorithms
Clustering is concerned with grouping together objects that are similar to each other and dissimilar to the objects belonging to other clusters. Clustering techniques explore similarities between patterns and group similar patterns into categories or groups. In many fields there are obvious benefits to be had from grouping together similar objects. For example, in a medical application we might wish to find clusters of patients with similar symptoms. Grouping objects into categories is a fairly common activity and it has been intensified due to the large number of information that is currently available [1][2]. There are many important issues and research trends for cluster algorithms and a comprehensive overview can be found in [11]. This section focuses on related works.
Although, there is no consensus, most researchers describe a cluster by considering the internal homogeneity and this proximity measure directly affects the formation of the resulting clusters. Once a proximity measure is chosen, the construction of a clustering criterion function makes the partition of clusters an optimization problem.
]]> In this paper the data clustering problem is modeled as a clustering optimization problem. Given an instances set with a attributes and a predetermined number of clusters (c), the objective function aims to find out an optimal cluster setting such that the sum of squared Euclidean distances between each object and the center of the belonging cluster is minimized (see Equation (1)), and the following constraints have to be satisfied: each data object belongs to only one cluster, and no cluster is empty.where xi is the vector of data objects; xia is the value of ath attribute of ith data object, cj is the vector of jth cluster centers; cja is the value of ath attribute of jth cluster center, wij is the associated xi-ci pair value, such that wij is 1 if object i is grouped into cluster j, and 0 otherwise.
The k-means algorithm is one of the most popular algorithms for clustering; it is algorithmically simple, relatively robust and gives good results over a wide variety of data set. However, the algorithm is known to suffer from local convergence and depends on initial values [12]. Although, a large variety of clustering algorithms have been developed over the last years, there is no single algorithm that can meet and handle all the clustering requirements [12]. Metaheuristics, such as GA, ACO, ABC, and AIS have been efficiently used to achieve optimal or approximately optimal solutions without requiring prior knowledge about the data set to be clustered [3][4][5][6] [7][8][13]. This paper explores three different bio-inspired metaheuristics: GAs, ACO and AIS. At following, related works for each of these bio-inspired metaheuristics are described and a complete review of evolutionary algorithms for clustering can be found in [13].
Some studies showed that GA is a viable technique for solving the clustering problem [3][14][15][16][17]. A genetic algorithm for classical clustering is the Genetic K-means Algorithm (GKA) [14]. It combines the simplicity of the K-means algorithm with the robustness of the GAs to find a globally optimal partition for a data set into a specific number of clusters. The purpose of the GKA is to minimize the total intracluster variance, also known as the measure of squared error. However, its crossover operator is expensive, so some changes were proposed for this algorithm as in the Fast Genetic K-Means Algorithm [15] and in the Incremental Genetic K-means Algorithm [16]. They reach a global optimum and are faster than GKA. Another algorithm proposed to solve the same problem is the GA-clustering algorithm [17]. Its clustering metric is the sum of the Euclidean distances of the points from their respective cluster centers, as defined in Equation (1). The Genetic Algorithm for Clustering (GAC) developed in this work is based on the GA-clustering algorithm [17] because it reaches satisfactory results to solve the clustering problem.
The first ACO algorithm for data clustering problems was presented by Shelokar et al. [6]. It mainly relies on pheromone trails to guide ants to group objects according to their similarity, and on a local search that randomly tries to improve the best iteration solution before updating pheromone trails. Their local search is performed as follows: the cluster number of each object is altered with a predefined probability (pls = 0.01); A random number (r) is generated for each object; If r ≤ pls the object is moved to other cluster. After the local search, the quality of the solution is obtained and it is compared to the quality of the ant, if it is better, then the ant is replaced. The ACO algorithm proposed by Kao and Cheng [5], called Ant Colony Optimization for Clustering (ACOC), attempts to improve the Shelokar’s algorithm by introducing the concept of dynamic cluster centers in the ant clustering process, and by considering pheromone trails and heuristic information together at each solution construction step. The ACO for Clustering presented in this paper is based on the ACOC algorithm proposed by Kao and Cheng [5].
The interest on AIS algorithms have been growing in the last years and many algorithms have been proposed to solve clustering problems, as discussed in [8]10[][18][19][20][21][22]. Some of the founders of these algorithms are Timmis et al. [18] and Castro & Von Zuben [19][20]. In Timmis et al. [18] the authors compare the AIS with Kohonen Networks. Castro & Von Zuben [19] presented ClonalG (CLONal selection ALGorithm), originally proposed to solve machine learning and pattern recognition problems and later adapted to solve optimization problems. Castro & Von Zuben [20] presented the aiNet (Artificial Immune Network) algorithm that incorporates the ClonalG as part of the training process of a network. Furthermore, some works have been proposed to optimize the aiNet algorithm, like in Tang et al [8], where the authors use the aiNetpca to cluster documents; another example can be found in Liu et al [21]. Castro & Timmis [22] presented the opt-aiNet (Artificial Immune Network for Optimization) algorithm, as an optimization-aimed extension for aiNet. In this paper, the ClonalG [19] and opt-aiNet [22] algorithms proposed were chosen once the first is the simplest AIS algorithm while the second is the enhanced version that can effectively perform global and local search.
This Section describes the different algorithms and its application to the Clustering problem. All these bio-inspired algorithms use a particular type of objective function that prescribes the optimality of a solution so that the particular solution may be ranked against all the other solutions. In this work, the Equation (1), described in Section 2, is used for all the algorithms. In GA and Memetic algorithm the term “fitness function†is equivalent to the objective function described above. In the same way, “affinity measure†in AIS refers to the objective function.
3.1 Genetic and Memetic Algorithms
Genetic algorithms are inspired by the theory of natural selection and genetic evolution and they have been successfully applied to the optimization of complex processes. From an initial population, basic operators are applied consisting of selection, crossover and mutation [23]. These operators evolve the population generation to generation. Through the selection operator more copies of those individuals with the best fitness (best values of the objective function) are probabilistically allocated. The crossover operator combines parts of two parent solutions to create a new solution. The mutation operator modifies randomly the solution created by crossover (child). The descendent population created from the selection, crossover and mutation replaces the parent population. There are various techniques of substitution, for example, elitism [23].
The hybridization is an extremely effective way to increase performance and efficiency of GAs. The most common form of hybridization is to integrate into GAs a technique of local search as a decisive part in the evolution, and also to incorporate the domain specific knowledge in the search process. Such approaches of hybridization are called Memetic Algorithms (MA) [23]. The local search can be characterized as a local refinement within a search space. Therefore, MA is related to the cultural evolution as individuals are adapted to meet the needs of the problem. On the other hand, GA is based on the biological evolution of individuals, in such a way that the offspring will inherit many skills and characteristics present in their progenitors.
The main idea of a MA is to explore the neighborhood of the solutions obtained through GA by searching local optima solutions before returning to the GA and continue the process. All steps of GAs, such as selection, crossover and mutation are present in MAs. In summary, the difference between these two classes of algorithms is the inclusion of an optimization step of the individuals, through the addition of local search operators that specialize the learning for each individual [24].
The operators of crossover and mutation can generate individuals of the population that are located near unexplored local optima. Thus, a new solution should be explored for a minimization problem. However, this improvement in the quality of the solution usually leads to a significant increase in computational time.
GAC developed in this work is based on the GA-clustering algorithm [17] because it reaches satisfactory results to solve the clustering problem and it also models the problem as we described at the beginning of this section. The GAC was developed in Java from Bigus and Bigus’ code [25] and its pseudocode is shown in Figure 1. The problem is represented by chromosomes consisting of a dynamic array of c cluster centers. In an n-dimensional space, each center is composed of n coordinates (n genes). The data structure includes, in addition to the centers, a reference to the data of those clusters, although they do not participate in the evolutionary process.
]]>
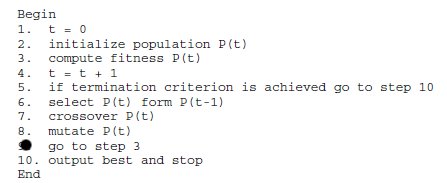
Figure 1: Pseudocode of GA-clustering algorithm [17]
The initial population of GAC is formed by chromosomes with c centers randomly obtained from the data set. Initially, the centers are the data set points. After the generation of new populations, the centers become imaginary points obtained in the evolutionary process.
The fitness function of the GAC is given by Equation (1). The selection operator of individuals for each new population is the roulette method. Three types of crossover operators were implemented: (a) one-point intercluster, (b) one-point intracluster and (c) multi-point intracluster, as depicted in Figure 2. The first two operators are based on a one-point crossover operator, in which a position of the chromosome is randomly selected (cut point) and the genes of one side of the chromosome are exchanged between individuals [23]. The one-point intercluster operator is an adaptation of the intercluster operator specific to the problem of clusters implemented in the GAC, wherein the cut point is the end of a center, and whole centers are exchanged between individuals. The third operator implemented is the multi-point intracluster based on uniform crossover operator, where each gene is exchanged between a pair of chromosomes randomly selected with a certain probability of exchange [23]. In GAC, the exchange between genes occurs whenever the value of the gene is greater than or equal to 0.5.
Two types of mutation operators were implemented: (a) one-gene and (b) gene to gene. The first operator performs the mutation in a single gene of the center, randomly selected according to the probability of mutation. The latter operator can perform the mutation in all genes of a randomly selected center, according to the probability of mutation. Regardless of the type of operator, the centers are represented by a floating point, the mutation changes the gene value within a fixed percentage p, called here as the movement of the mutation. For this, a number d in range [0..1] is generated with uniform distribution. Thus, if the value of a gene is v, after mutation it will be v * d * ± p%. The signs of movement ('+' or '-') occur with equal probability. Since the algorithm works on data values normalized in the range [0..1], it was implemented the reflect for the cases in which v exceeds the limits of that range after mutation.
]]> Each new population is generated with the same size of the parent population. To adjust the GAC, three alternatives of elitism were evaluated. In the first alternative of elitism, a new population is composed only by the best individuals between the parent and descendant populations, called in this paper as "the best". In the second alternative, 50% of the new population consists of best solutions from parent population and 50% for the best solutions generated by the evolutionary process. Finally, the last alternative of elitism preserves only the best solution of the parent population, as occur in [17]. The stopping criterion of the algorithm is the maximum number of iterations or the maximum number of generations without improvement (15 generations).
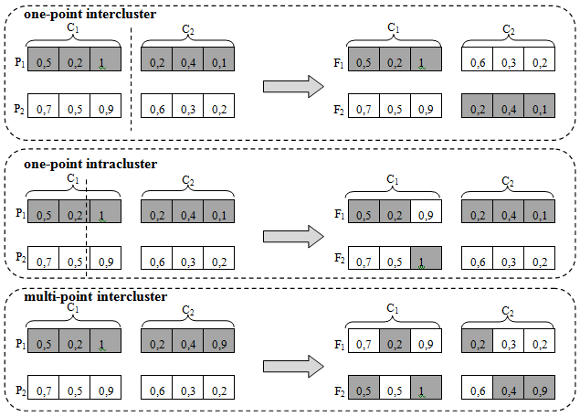
Figure 2: Illustration of crossover operators one-point intercluster, one-point intracluster and multi-point intracluster in GAC
3.1.1 Local Search – Memetic Algorithm
The Memetic Algorithm for Clustering (MAC) is a version of the GAC with local search. The local search method implemented in the MAC is the First Improvement. This is a refinement heuristic, a kind of Hill Climbing, which stop the exploitation of the neighborhood when a better neighbor is found. Thus, only in the worst case the whole neighborhood is explored [26].
]]> MAC is based on GAC. So, the implementation of MAC from GAC needs to perform the local search after the creation of each new individual in order to explore its neighborhood (after line 8 in Figure 1). Each neighbor is generated by a movement of up to ± 5% in a gene (dimension) of the chromosome, similarly to mutation operator. This process is followed from the first to the last gene of a chromosome until a better neighbor is found. First, the movement is accomplished by adding. Then, the movement is performed by subtraction. In the worst case it is generated a neighbor for each gene with movements of until +5% until -5%. If there is no better neighbor, the individual is not replaced.
3.1.2 Number of Objective Function Evaluations
The number of fitness function evaluations performed by GAC and MAC was analyzed as a computational cost measure. The exact complexity of each algorithm was not calculated but in this kind of algorithms is accepted as computational cost the number of evaluations [27].
In GAC algorithm the evaluation of the fitness function is calculated after the creation of each new individual. So, the number of evaluations will be equal to the number of new individuals created in each generation multiplied by the number of generations. In MAC algorithm the number of objective function evaluations increases exponentially due to the inclusion of the local search where each neighbor explored must be evaluated. This indicates that, in the worst case, 2*c*n neighbors for each chromosome will be generated and evaluated, where c is the number of clusters and n is the number of dimensions.
3.2 Ant Colony Optimization
ACO metaheuristic is an example of an artificial swarm intelligence which is inspired by the collective behavior of social insects [28] [29]. In the ACO algorithm, an artificial ant simulates the pheromone trail following the behavior of real ants to find the shortest route between a food source and their nest. Each artificial ant collects the necessary information about the problem, stochastically make its own decision, and constructs solutions in a stepwise way. The behavior that emerges is a group of relatively "not intelligent" ants that interact through simple rules and dynamically self-organize maintaining their positions around the shortest trails: ants leave their nest without information about the location of food sources, move randomly at initial steps, and deposit a substance called pheromone on the ground. The pheromone marks a trail, representing a solution for a problem, which will be positively increased to become more attractive in subsequent iterations. So, the pheromone concentration indicates how useful was a solution serving as a history of the best ants’ previous movement. Besides the pheromone concentration, ants can use heuristic function values that generally indicate an explicit influence toward more useful local information.
]]> The ACO for Clustering presented in this paper is based on the ACOC algorithm proposed by Kao and Cheng [5]. In the ACOC, the solution space is represented by an object-cluster matrix containing o rows (objects) and c columns (clusters). Ants can stay in only one of the c clusters for each object. A vector (S) of size o is used to represent each solution built by ants. Each element of the vector corresponds to one of the o objects and its attributed value represents the cluster number assigned to it. Each ant moves from one node to other, deposits pheromone on nodes, and constructs a solution in a stepwise way. At each step, an ant selects an ungrouped object and adds it to its partial solution by considering both pheromone intensity and heuristic information. Nodes with stronger pheromone and heuristic values would be more likely to be selected by ants. The heuristic information indicates the desirability of assigning a data object to a particular cluster. It is obtained by calculating the reciprocal of the Euclidean distance between the data object to be grouped and each cluster center (see Equation (1)). Each ant carries a centers matrix (Ck) and updates it right after each clustering step.The following steps are performed by ACOC [5]:
Initialize the pheromone matrix to small values ();
Initialize all ants: initialize cluster centers matrix (Ck) and the weight matrix (Wk) that associates each object with a center. Initially, each matrix position is set to -1 indicating ungrouped objects. Eventually, each matrix position will be set to 0 if the object does not belong to the corresponding center or, otherwise, it will be set to 1;
Select an object i: each ant selects an object i;
Select a cluster j: to determine j for a selected object i, two strategies, exploitation and exploration, can be applied depending on the result of Equation (2): (a) Exploitation: allows ants to move in a greedy manner to a node whose product of pheromone level and heuristic value is the highest (see Equation (2)); (b) Exploration: allows probabilities to candidate nodes, and then let an ant chooses one of them in a stochastic manner according to Equation (3). The more promising a node is, the higher its probability;
Update ants’ matrices: update weight matrix (Wk) and cluster centers matrix;
Check each ant’s solution: if the ant’s solution vector (Sk) is complete, then go to step 7, otherwise, go back to step 3;
Calculate the objective function value of each ant (Jk) by using Equation (1). After that, rank the solutions of ants in the ascending order of Jk values. The best solution is called iteration-best solution (elite solution). It is compared with the best-so-far solution, and the better one will be the new best-so-far solution;
Update pheromone trails: the global updating rule is applied, and only the elitist ants are allowed to add pheromone at the end of each iteration. The pheromone trail is updated by Equation (6);
Check termination condition: if the number of iterations exceeds the predefined maximum iteration number, then it is stopped and the best-so-far solution is returned. Otherwise, go to step 2.
The Equations used by ACOC are presented bellow.
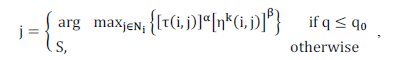 , (2)
, (2)
where is a predefined probability; is a randomly generated probability; Ni is the c clusters set; S is selected according to Equation (3).
where represents the probability of assigning the object i to cluster j; represents the pheromone trail between i and j indicating how useful this pair was in the past; represents the heuristic function for ant k defined in Equation (4).
where represents the Euclidian distance between object i and center j by using Equation (5):
The positive constants and are used to indicate the influence of the pheromone concentration and the heuristic, respectively. The constant is not used in ACOC [5], but it will be used here to show the influence of the pheromone concentration on solutions construction.
]]>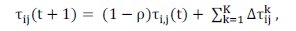 (6)
(6) where Ï is the pheromone evaporation rate, 0 < Ï < 1; t is the iteration number; K is the number of elite ants; is obtained by calculating the reciprocal of the objective function Jk. Different from ACOC, in this paper is obtained by calculating the reciprocal of the objective function Jk divided by the existent objects number (m) (see Equation (7)).
3.2.1 Local Search
The present paper aims to analyze the performance of ACOC, in terms of objective function and computational cost, when applied a local search at the end of each solution constructed by an ant. The proposed local search is applied after the six step of the ACOC. Different from the local search proposed by [6] that randomly alters the cluster of an object and only on the best solution of each iteration, our proposed local search is applied after each ant completes a solution and the change of cluster number is applied only when necessary, i.e., when it exists other center more similar to the object.
The following steps are performed by our local search after the ACOC’s step 6: (6a) Cover all o objects of the Sk vector (ant’s final solution); (6b) Compare the o object with each cluster centers to verify which center is more similar to it; (6c) If the o object is more similar to a center for which it was not assigned by ant k, then an exchange to this new center is performed. After that, the S solution vector and the W matrix is updated; (6d) If the local search covers all the objects of the Sk vector, the algorithms goes to step (6e), otherwise it goes back to step (6b); (6e) After completing all the necessary exchanges, the algorithm calculates the objective function (see Equation (1)); If the new found solution is better than the ant’s solution (Jk), the new solution is accepted, the ACOC variables are replaced by the new local search variables: Ck, Wk, Sk, and Jk, and the algorithm goes to ACOC’s step 7.
An important aspect that needs to be analyzed in relation to the computational effort spent on runs of the two algorithms (Pure ACOC and ACOC with local search) is the number of objective function evaluations. In pure ACOC after each ant constructs the complete solution vector and evaluates its value in terms of the objective function, the evaluations counter is incremented by one. When ACOC uses local search, it receives each ant’s solution vector, and after switching the objects’ centers, the counter is also incremented by one.
3.3 Artificial Immune Systems
AIS have been defined as adaptive systems inspired by immunology theoretical, with its principles and models applied in problem solving [10]. CLONALG and opt-aiNet algorithms are examples of AIS implementations [30].
The CLONALG algorithm is inspired by clonal selection theory which establishes the idea that only those cells (antibodies) that recognize the antigens proliferate, generating copies (clones). Then genetic mutations occur in the clones, generating antibodies with higher affinity for the antigen that through the natural selection process becomes memory cells, which implies in better adapted individuals and more quickly and efficiently future responses to similar antigens. The goal of the algorithm is to develop a memory pool of antibodies that represents a solution to a problem, while an antigen represents an element of the problem space. Initially, the algorithm provides a local search via affinity maturation (hypermutation) of cloned antibodies and more clones are produced for better matched (selected) antibodies, though the scope of the local search is inversely proportional to the selected antibodies rank. Then, a second mechanism provides a global scope and involves the insertion of randomly generated antibodies to be inserted into the population to further increase the diversity and provide a means for potentially escaping local optima [31].
The CLONALG algorithm was originally proposed by de Castro & Von Zuben [20] and presented in two versions: the first to solve machine learning and pattern recognition problems and, the second, for optimization problems. With the evolution of CLONALG algorithm an artificial immune network model, called aiNet has been proposed specifically to solve machine learning, pattern recognition, data compression and clustering problems [31]. Some studies showed the application of aiNet in clustering [19] [20] [22]. Later, the aiNet principles were extended to solve optimization problems, generating the opt-aiNet algorithm [19].
The implementation of CLONALG algorithm implies four key decisions: encoding of antibodies and antigens, definition of the affinity measure between antibodies and antigens, and configuration of selection and mutation processes.
The implementation moves through an antibodies population Abi, i=1,...,n, each one representing a candidate solution (c centers of clusters), and a set of elements to be grouped, represented by the antigens population Agj, j=1,...,m. The antigens population is represented by an array Agml, where m is the amount of antigen and l the number of features of each one. The antibodies population also is represented by an array Abnkl, where n is the amount of antibodies, k the number of clusters and l the number of features.
]]> The affinity measure f between antibodies and antigens is given by the Euclidean distance as in Equation (1), and as shorter the distance, the greater the measure of affinity between them.The amount n of antibodies to be cloned corresponds to a parameter of the algorithm. The amount of clones generated from each antibody selected is proportional to its affinity to the antigen (as higher the affinity of the antibody to the antigen, more clones will be generated), according to Equation (8):
where ï¢ is a clonal multiplication factor, n is the total amount of antibody, i ϵ [1,n] is the antibody current ranking based on its affinity and round (.) is a rounds operator.
The generated clones suffer a mutation process at an inversely proportional rate to its affinity to the antigen (as higher the affinity, lower the mutation rate) which consists of a perturbation in the value of some characteristics of the antibody. The amount of antibody characteristics that suffer the perturbation is given by Equation (9):
where Ï is a parameter of the algorithm that defines the mutation rate of an antibody and f is the normalized affinity function of the antibody to the antigen.
Then, antibody characteristics are randomly selected and they will be perturbed by adding or subtracting a percentage, defined as a parameter of the algorithm, respecting the normalization of the features values.
The CLONALG algorithm for clustering presented in this work is based on the optimization version proposed by de Castro [30] and its pseudocode is shown in Figure 3.
]]>
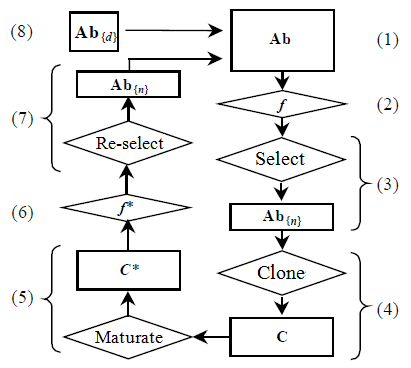
Figure 3: Flowchart of CLONALG [30]
The algorithm begins with the generation of an antibodies population. Each antibody corresponds to a candidate solution, containing the centers of data sets randomly generated and it performs the following steps:
A set of antigens Ag is presented to the antibodies population Ab;
The affinity measure f of the antibodies in relation to the antigens is calculated;
The n highest affinity antibodies to the antigens are selected to be cloned, generating the antibody subset Ab{n};
The antibodies selected will be cloned according to their affinity to the antigens (as higher the affinity more clones it will generate) by using Equation (8), producing a C clones population;
The C clones population is subjected to an affinity maturation process at an inversely proportional rate to the affinity of the clone (as higher the affinity, lower the mutation rate), by using Equation (9), and a new population of clones C* is produced;
The C* clones population is evaluated and its affinity measure f* in relation to the antigens is calculated;
The n matured antibodies of the highest affinity are selected to compose the next population generation, since its affinity is greater than its original antibodies;
The d worst antibodies are removed from the population and replaced by new randomly generated antibodies.
This process repeats until a stop condition (number of generations) is reached.
3.3.1 opt-aiNet algorithm
The opt-aiNet algorithm is based on the clonal selection and immune network theories. The synergy of these principles produces an evolutionary method that can effectively perform local and global search, and also has mechanisms to control the population size and maintenance of diversity. It can be considered an extension of the CLONALG algorithm, differing by the inclusion of antibody-antibody interactions and presenting a set of characteristics that make it an important engineering immune tool. Such characteristics includes: (i) an elitist and deterministic mechanism for selection of clones to decide which cell will be part of the next generation, and correspond to a tournament between the parent cell and its clones; (ii) automatic determination of the cardinality of the population through the suppression and diversity introduction mechanisms; (iii) local (searching the neighborhood through the mutation operator) and global search combination; (iv) automatic convergence criterion and (v) the ability to locate and maintain stable and optimal solutions [19].
The opt-aiNet algorithm for the clustering problem presented in this paper is based on the de Castro and Timmis algorithm [22] and it differs from the CLONALG algorithm by the inclusion of antibody-antibody interactions, rather than just antibody-antigen interactions.
The algorithm works with two cycles that are executed until a number of population generations is reached. An internal cycle of the algorithm, similar to the CLONALG, is responsible for the network stabilization through a process of clonal expansion and affinity maturation. The stabilization occurs when the population reaches a stable state, measured through the stabilization of its affinity measure (fitness). The selection of which clones will be part of the next generation antibodies corresponds to a tournament between the parent cell and its clones; and if the affinity measure (fitness) of clones is greater than their parents, they will replace them.
]]> At the end of the internal cycle, the antibody-antibody interaction happens and some of the similar cells are eliminated to avoid redundancy, more specifically those that are below a suppression threshold. In addition, a number of randomly generated antibodies are added to the antibodies current population and the internal cycle of local optimizing re-starts.As the CLONALG algorithm, this implementation represents the antigens population as an array Agml, where m is the amount of antigen and l the number of features of each one and the antibodies population by an array Abnkl, where n is the amount of antibodies, k the number of clusters and l the number of features. The affinity measure (fitness) f between both antibody-antigen and antibody-antibody is given by the Euclidean distance (see Equation (1)).
Unlike CLONALG algorithm, the number of clones generated for each antibody and selected for clonal expansion is fixed and it is a parameter of the algorithm. The affinity proportional mutation is performed according to the following expression:
where c’ is a mutated cell c, N(0,l) is a Gaussian random variable of zero mean and unitary standard deviation, β is a parameter that controls the decay of the inverse exponential function and f* is the individual normalized fitness.
3.3.2 Number of Objective Function Evaluations
The number of affinity measure function evaluations can be used as a measure of the computational cost analysis of the CLONALG and opt-aiNet algorithms. In CLONALG algorithm, when an antigen is presented to antibodies population, an affinity measure (fitness) is calculated for each antibody against the antigen presented (step 2 of the algorithm). Also, an affinity measure is calculated for each matured clone in relation to the antigen being presented (step 6 of algorithm). Then, for each antigen there are (N + tClones)*Ngen fitness function evaluations where N is the number of antibodies, tClones is the number of clones generated and Ngen is the number of generations. In opt-aiNet algorithm, the fitness function evaluations are performed when each antigen is presented to the antibodies population and also when clones are generated from antibodies, like CLONALG algorithm. However, unlike that, the number of evaluations depends on the execution of a number of generations or the network stabilization, measured by the stability of the affinity measure. Also, after the network stabilization fitness function evaluations are performed for all antibodies in order to suppress elements of the antibodies population.
]]>
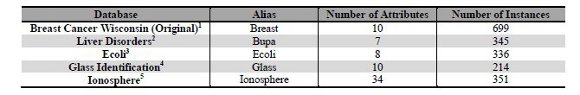
This section presents an empirical analysis to investigate the performance of each bio-inspired metaheuristic in the clustering problem. GAC and MAC algorithms were compared in Sub-section 4.1, ACOC with and without local search were compared in Sub-section 4.2, and CLONALG and opt-aiNet comparisons were presented in Sub-section 4.3. The best algorithms, in terms of the objective function described in Section 2, was chosen from each of these comparisons and the selected ones are compared in Section 5. The best algorithms are evaluated using five numeric databases (previously used by the authors [32]), normalized between the range [0..1]. All the databases were obtained from [33] and they are presented in Table 1. In order to improve the text readability, we use an alias for each database (column 2 of Table 1).
As our objective is to compare the performance of the metaheuristics we chose databases composed of two clusters and with different number of attributes. So, it is possible to analyze the behavior of each metaheuristic with simple databases, such as Bupa that has only seven dimensions (attributes), and with more complex databases, such as Ionosphere that has 34 dimensions. The last attribute of each database represents the classification of each instance in a cluster. So, this attribute is not considered in the experiments. The last column of Table 1 presents the number of instances, although this number does not bring impact on the complexity of the clustering process.
Table 1: Information about the used databases
4.1 GAC and MAC empirical studies
Before any evaluation, the parameters of the algorithm need to be set. So, GAC was executed with varied parameters values on the Breast database in order to choose the best setting among the existing possibilities, such as, mutation operator, crossover operator, mutation and crossover rates and elitism strategy. In all executions the number of generations was 50 and one parameter was chosen to be replaced. Also, the parameters proposed by GA-clustering algorithm [17] were evaluated. For each setting, 10 executions of the algorithm were performed and the average of the best fitness was evaluated. Here, we were looking for a good set of parameters but we were aware that this process must be enhanced to obtain the best parameters for each database. We did not focus on finding the optimum set for each metaheuristic.
]]> The best parameters were: population size: 800; crossover probability: 0.8; mutation probability: 0.1; generations: 50; executions: 10. It was used the crossover operator with one-point intercluster, i.e., whole centers are exchanged between individuals. This operator is specific to the clustering problem. It had better performance than the other crossover operators because it does not fragment the center during crossover, allowing a better convergence of the algorithm. The mutation operator used can perform the mutation in all genes of a random selected center. The mutation changes the gene value from -5% until +5%. GAC has an elitism strategy where only the best individual between the parent and child populations survive. GAC stops when the number of generations is reached or when 15 generations without improvement are executed. In this setting, GAC converged to the best result about 15th generation.After finding the best setting, GAC and MAC were executed on the other four databases using that setting. The synthesis of the results is showed in Table 2. This synthesis contains the best, the worst and average of fitness regarding of all solutions found. It also has the standard deviation among 10 best results and average of fitness evaluation of GAC. The number of fitness evaluations is presented like GAC’s computational cost measure. The standard deviation of results was relatively small. It shows that GAC obtained results very close in each execution.
The MAC parameters were also adjusted empirically by using Breast database. The execution of MAC was performed using the same parameters of GAC. However, we decided to use populations with 100 individuals for MAC due to its high number of fitness evaluations related to the local search. Table 2 also presents the results achieved by MAC on five databases. MAC standard deviation is greater than GAC standard deviation, even though it is a small number.
In these experiments the following data were analyzed: (a) Best solution; (b) Worst solution; (c) Average of the best solutions; (d) Standard deviation; (e) Average number of objective function evaluations.
Table 2: Results of GAC and MAC
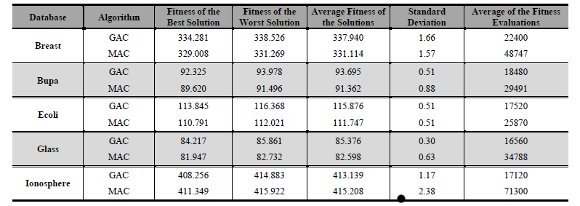
Ionosphere database has the highest number of attributes. So, in this case, MAC was executed with a population size equals to 100 and 200 varying the mutation probability between 10% and 20%. Nevertheless, the increase of both population size and mutation probability increased the computational cost of the search and it did not improve the resulting fitness value. For example, with a mutation probability of 10% and a population of 100 individuals: the best fitness average was 413.956962 and the number of fitness evaluations was 96,000. In a population of 200 individuals, the best fitness average was 411.356 with 215,858 fitness evaluations. Therefore, we concluded that a population size of 100 is more feasible than a population size of 200 considering the trade-off computational cost and benefit on performance.
MAC was configured with the same parameters of GAC except the population size set to 100, while in GAC it was 800. Although MAC obtained better fitness than GAC with a significantly smaller population, it had a greater computational cost because it needed a significantly higher number of fitness evaluations. The only exception is Ionosphere database, where GAC had better fitness than MAC.
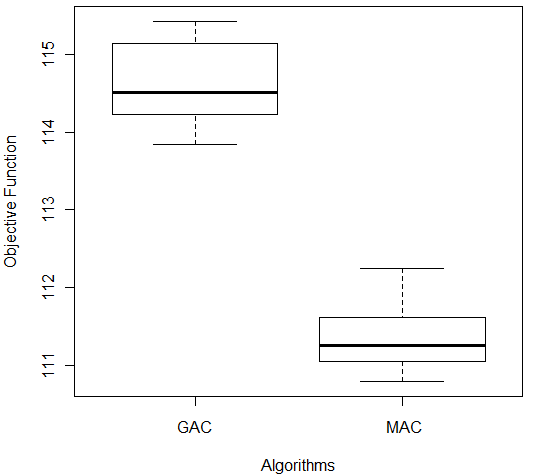
In order to compare the results obtained, we used the Wilcoxon test [27] provided by the software R [34]. The test received as input the values obtained from the output of 10 repetitions of each algorithm and returned the p-value. In this study, it was considered a significance level (α = 0.05) so, a p-value greater than α indicates that the algorithms compared are statistically identical. Otherwise, there is a difference in the algorithms performances. The Wilcoxon test indicated that there was a significantly difference among results of both algorithms on Ecoli database (p-value = 1.083 e-05). Figure 4(a) shows the results of comparison between GAC and MAC on Ecoli. MAC had better fitness values (lowest values in terms of the objective function) (lower trace) and the lowest median value (line in box).
]]>| | |
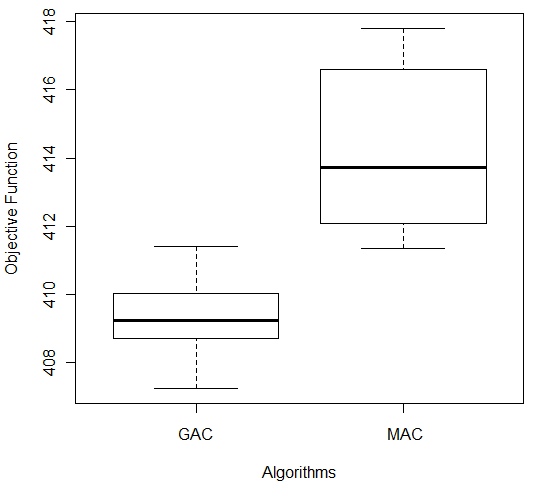
| (a) | (b) |
Figure 4: Comparison of GAC and MAC on (a) Ecoli and (b) Ionosphere Databases
In the case of Ionosphere database there was also difference among algorithms results, according to the Wilcoxon test (p-value = 0.00002165). But in this case, GAC had the better results than MAC and smaller variance among data (Figure 4 (b)). Despite this, we applied Wilcoxon test to compare MAC and GAC on all databases used in this empirical study, we do not present all boxplots due to space limitation. Nevertheless, the analysis of boxplots showed that MAC had better performance than GAC on Glass, Ecoli and Bupa databases with significance level greater than α (Breast: p-value = 1.083e-05, Bupa: p-value = 1.083e-05 and Glass: p-value = 2.165e-05).
ACOC without local search was executed with varied parameters values on the Breast database in order to choose the best setting among the following possibilities: (1) Pheromone Concentration Influence: variable α (A) assumes 0.5 and 2; (2) Heuristic Influence: variable β (B) assumes 1 and 5; (3) Pheromone Evaporation Influence: variable Ï (R) assumes 0.1 and 0.7; (4) Exploitation Probability: qo (Q0) assumes 0.4 and 0.8. The following parameters are fixed: (a) Number of Iterations: 100; (b) Number of Ants: 10; (c) Number of Elite Ants (K): 1; (d) Number of Repetitions: 10. Sixteen different parameters variations were executed and the best setting found was (refer to [35] for more details on the parameters settings): (a) B = 5, high influence of the heuristic function; (b) A = 2, high influence of the pheromone concentration; (c) R = 0.7, high pheromone evaporation; (d) Q0 = 0.8, high exploitation probability. It can be noted that the heuristic function is acting positively in the clustering process. The pheromone deposited by each elite ant, at the end of the iteration, is also acting positively in the process, helping future ants to find the way to the best solutions. The greater the likelihood of exploitation, lower the probability of the algorithm to find different solutions (diversification) for the clustering problem. Due to the exploitation, the algorithm tends to follow the best solutions ever found.
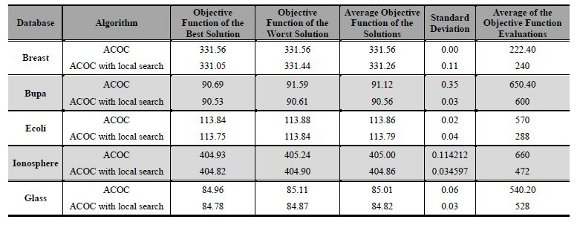
Table 3 presents the results of the executions of ACOC without and with the local search proposed. All executions used the best parameters found when running the ACOC on Breast database (B 5, A 2, R 0.7, Q0 0.8). In these experiments the following data were analyzed: (a) Best solution; (b) Worst solution; (c) Average of the best solutions; (d) Standard deviation; (e) Average number of objective function evaluations. With the latest result one can note the aspect of diversity versus convergence and the computational cost in terms number of objective function evaluations.
As can be seen in the last column of Table 3, ACOC with local search provided less computational cost in terms of the average number of objective function evaluations for the following databases: Bupa (600), Ecoli (288), Ionosphere (472) and Glass (528). The exception was for the Breast database, whose number of evaluations was lower with ACOC (222.40) against the 240 evaluations on ACOC with local search. One can also see that ACOC with local search showed better solutions than the ACOC without local search for all databases: Breast (331.05), Bupa (90.53), Ecoli (113.75); Ionosphere (404.82) and Glass (84.78). Regarding the worst solutions and the average of the best solutions, the ACOC without local search showed the worst values for all databases. When the requirement was examining the standard deviation from the average of the solutions, the two algorithms showed similar values. Finally, we conclude that for all the databases the use of ACOC with local search was advantageous. It is possible to notice that ACOC with local search obtained better clustering quality in terms of the objective function.
Table 3: Results of ACOC and ACOC with local search
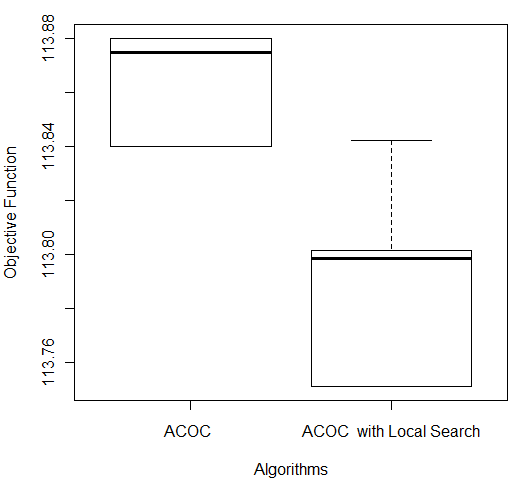
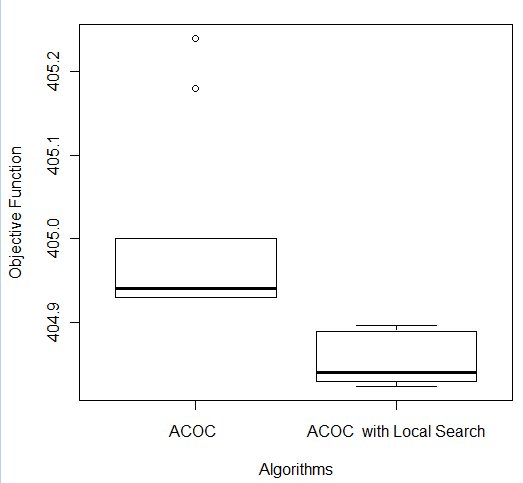
In order to compare the results obtained, a Wilcoxon test [27] was performed for each of the five databases. The following p-values were obtained: Breast (6.386 e-05), Bupa (0.0001766), Ecoli (0.001427), Glass (0.0001494), and Ionosphere (0.0001575). For all the databases, the pure ACOC and ACOC with local search were considered statistically different. Then, it is necessary to consider the boxplot graph (see Figure 5) to determine which technique provides better performance. We do not present all boxplots due to space limitation. Nevertheless, the analysis of boxplots showed that ACOC with local search had better performance than ACOC for all databases as had been analyzed in Table 3. Figure 5 shows the comparison of both ACOC and ACOC with local search results on Ecoli and Ionosphere. ACOC with local search obtained the best performance (lowest values in terms of the objective function) and the lowest median value.
]]>| | |
| (a) | (b) |
Figure 5: Comparison of ACOC and ACOC with Local Search on (a) Ecoli and (b) Ionosphere Databases
4.3 CLONALG and opt-aiNet empirical studies
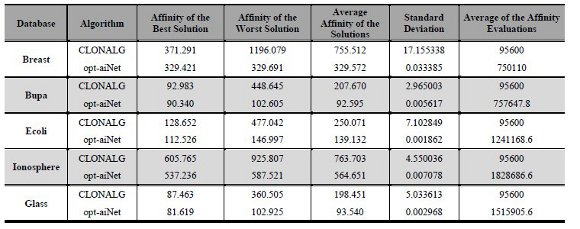
]]> The parameters of CLONALG and opt-aiNet algorithms were configured using the same methodology explained before. The algorithms were executed with varied input parameters values on the Breast database. The parameters proposed by de Castro and Timmis [22] were the initial set and 16 different parameters were tried, each one with 10 executions of CLONALG and opt-aiNet algorithms. The following parameters for CLONALG algorithm were defined: number of generations (Ngen=100), antibody population size (N=200), number of antibodies with greatest affinity selected for cloning (n=25), clonal factor (β=1) and number of lowest affinity antibodies to replace with random antibodies (d=40). For the opt-aiNet algorithm the following values of input parameters were defined: number of generations (Ngen=100), antibody population size (N=50), number of clones generated for each antibody (n=50), suppression threshold (σ=0,2), average error value (0,001), scale of the affinity proportional selection (β=100) and number of lowest affinity antibodies to replace with random antibodies (d=20). After finding the best parameters, both CLONALG and opt-aiNet algorithms were executed on the databases and the results are shown in Table 4.From the results shown in the Table 43, it is possible to note that opt-aiNet algorithm was better than CLONALG algorithm for all databases. The analysis of the Best Solution column showed an improvement of the fitness function value from 128.652 to 112.526 on Ecoli database, approximately 12.53%. In other databases this improvement was 11.31% on Ionosphere, 11.28% on Breast, 6.68% on Glass and 2.84% on Bupa. However, this improvement in fitness function value was achieved through a large increase in the number of fitness function evaluations, which can be seen in the last column of the table. This can be explained by the increased antibody-antibody interactions in the opt-aiNet algorithm, beyond those iterations antibody-antigen, present in CLONALG algorithm. In addition, the analysis showed a significant reduction in the standard deviation for the opt-aiNet algorithm, which concluded that it gets very close results in each execution.
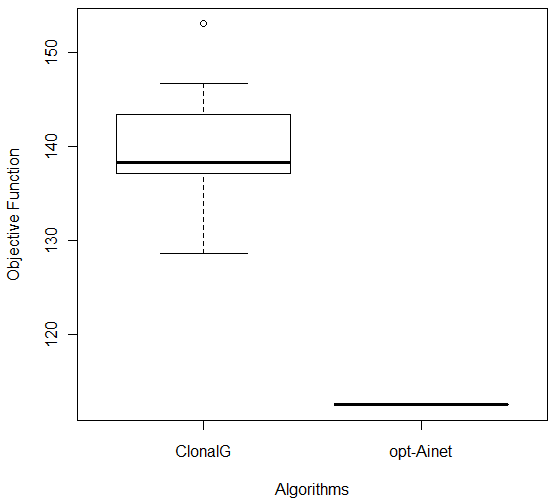
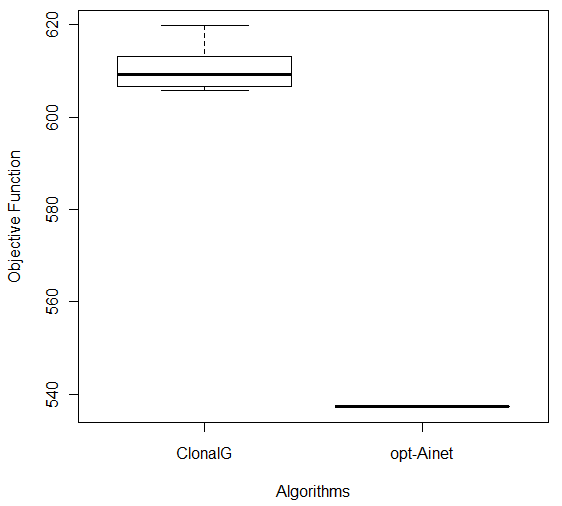
In order to compare the results of the experiments with CLONALG and opt-aiNet algorithms, the Wilcoxon test [27] was used. The obtained p-values were: Breast (1.083e-05), Bupa (1.083e-05), Ecoli (0.0001817), Ionosphere (0.0001817) and Glass (1.083e-05) indicating that the algorithms were statistically different (for a significance level of 0.05). Considering the boxplot graphs for each database, shown in Figure 6, it can be concluded that opt-aiNet algorithm was better than CLONALG algorithm.
Table 4: Results of CLONALG and opt-aiNet
| |
Figure 6: Comparison of CLONALG and opt-aiNet on (a) Ecoli and (b) Ionosphere Databases
]]>
5. Comparing the different approaches: MAC, ACOC with local search and opt-aiNet
This section presents the comparison among the three Bio-inspired metaheuristics proposed for the clustering problem that achieved the better results: MAC, ACOC with local search and opt-aiNet.
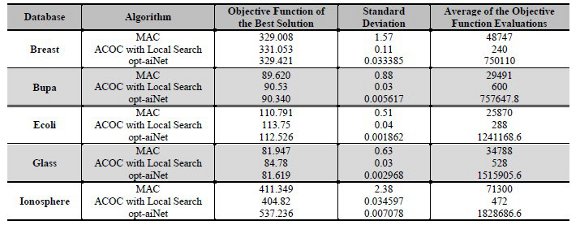
Table 5 presents the best solution, the standard deviation and the average of the number of objective function evaluations for each algorithm in all databases. The MAC obtained the best solutions for the three databases Breast, Bupa and Ecoli, although these values were not so different. Other important aspect to be notice is that the MAC presented a much higher computational cost if compared with ACOC with local search. The computational cost of opt-aiNet is even higher than the cost of ACOC with local search and MAC. For example, for the Breast database, MAC performed 48747 objective function evaluations to obtain a fitness of 329.008; opt-aiNet performed 750110 objective function evaluations to obtain a solution with affinity of 329.454, while the ACOC with local search performed only 240 objective function evaluations to obtain a solution with objective function value equals to 331.053. For the other databases the same comparisons can be made by analyzing Table 5. This high computational cost can be explained considering that GAs, in general, are more probabilistic than ACO metaheuristics. So, GAs’ convergence is slower and, consequently, it performs a higher number of fitness evaluations. The high number of objective function evaluations in opt-aiNet algorithm occurred because it needed to evaluate the antigens population in relation to the antibodies population, as well as, the evaluation of each antibody of the antibodies population with each other. Nevertheless, opt-aiNet was the algorithm that achieved the lowest standard deviation.
For the Glass database, opt-aiNet found the best solution despite having both the highest average of solutions and computational cost. For the Ionosphere database, the computational simulations revealed that the ACOC with local search proved to be the best algorithm in terms of the quality of solutions found and computational cost.
Table 5: Results of MAC, ACOC with local search and opt-aiNet
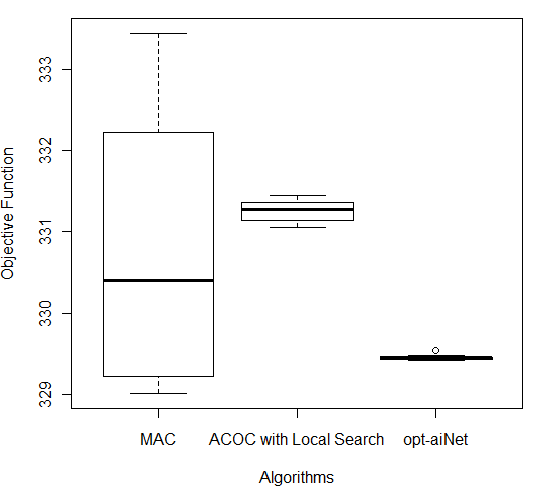
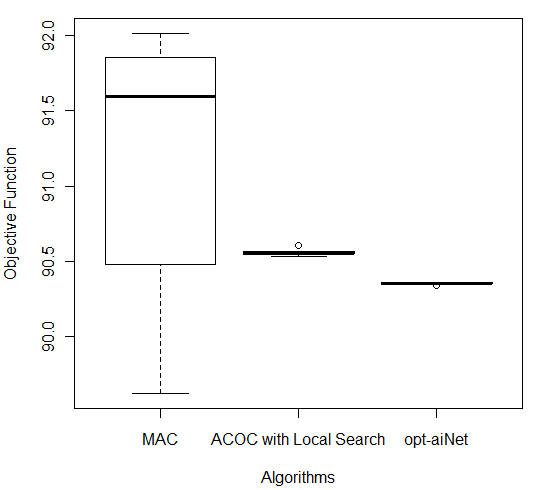
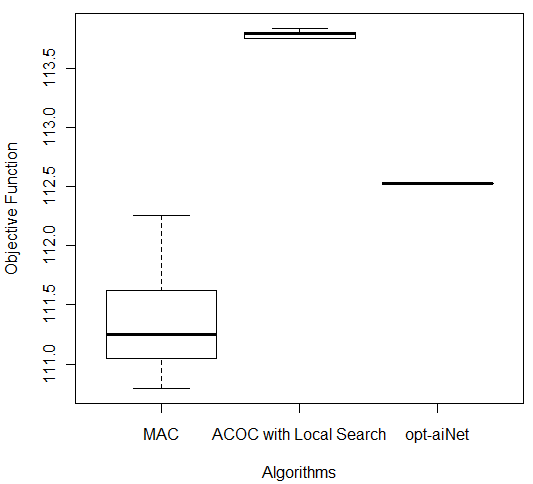
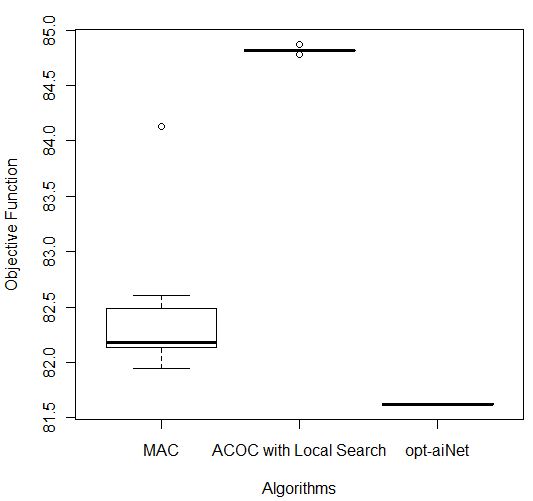
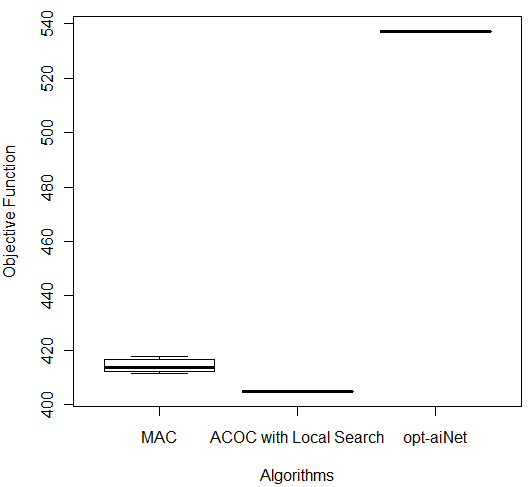
In order to compare the results of these three better algorithms (MAC, ACOC with local search and opt-aiNet), the Kruskal–Wallis one-way analysis of variance by ranks (KW) [36] was performed for each of the five databases by using the 10 better results obtained by each algorithm. KW is a non-parametric method for testing equality of population medians among the algorithms. The data from all the executions was first combined and ranked from smallest to largest. The average rank was then computed for the data at each algorithm. Since the p-value is less than 0.05, there was a statistically significant difference amongst the medians at the 95.0% confidence level. To determine which medians were significantly different from each others, it was necessary to analyze the boxplots graphs for the five databases in Figure 7.
]]> The following p-values were returned by the Kruskal-Wallis test: Breast (0.00387), Bupa (0.001783), Ecoli (2.392e-06), Glass (2.399e-06), and Ionosphere (2.447e-06). According to these p-values, for all databases, the algorithms were considered statistically different, so there was difference among the algorithms’ performance. It is easy to see from Figure 7 (c) that for Ecoli database MAC obtained better performance than the other two algorithms in terms of the objective function and the lowest median value. On the other hand, ACOC with local search outperformed MAC and opt-aiNet on Ionosphere database as shown in Figure 7 (e). Although the MAC had presented the best solution for the Breast and Bupa databases as shown in Table 5, the algorithms were statistically different and considering all the best solutions obtained in the 10 repetitions opt-aiNet had the best performance for these databases (Figure 7 (a) and (b)) especially in terms of smaller variance among the objective function. In addition, opt-aiNet had the lowest median for Glass database as shown in Figure 7 (d).Despite ACOC with local search achieved the best solution only for one database (Ionosphere), its results for the other databases are close to the results of MAC and opt-aiNet. In addition, ACOC with local search had the lowest computational cost for all databases with a satisfactory standard deviation. Opt-aiNet algorithm executed a higher number of objective function evaluations than MAC and ACOC with local search, but it achieved the best median for three databases.
6 Conclusion
This paper analyzed the performance of the GA, ACO and AIS metaheuristics for solving data clustering problem in an experiment with five numeric databases. Experimental results provided evidences that GA, ACO and AIS are suitable metaheuristics to deal with this problem in the context of our experiment. The six algorithms presented in this paper (GAC, MAC, pure ACOC, ACOC with local search, CLONALG and opt-aiNet) were able to effectively discover clusters for the five databases used. These results also showed that, in our experiment, the algorithms with local search (MAC and ACOC with local search) had better performance than their pure metaheuristic-based versions (GAC and ACOC). With respect to immune algorithms, opt-aiNet presented better results than CLONALG since it is an extension that considers interaction of the network cells with each other.
| | |
| ]]> (a) | (b) |
| | |
| (c) | (d) |
| | |
| (e) | |
Figure 7: Comparison of ACOC with Local Search, MAC and opt-aiNet on (a) Breast, (b) Bupa, (c) Ecoli, (d) Glass and (e) Ionosphere Databases
]]>
MAC, ACOC with local search and opt-aiNet were considered statistically different. Opt-aiNet had better performance on three databases and ACOC with local search and MAC achieved better fitness on one database. Despite, ACOC with local search performed fewer objective function evaluations than opt-aiNet and MAC. This is mainly due to two important characteristics of ACOC: it uses two information to guide the ants during solutions search: a history of the best ants' previous movement (pheromone concentration) and an explicit influence toward more useful local information (heuristic function); it allows, besides an exploration transition rule, the ants to move in a greedy/deterministic manner to a node whose product of pheromone and heuristic value is the highest, that is, when selecting a cluster to an object, the most similar one is generally chosen.
Other observed behavior was that GAs based algorithms presented more variability on the results than the other algorithms. This behavior can be due to its crossover and mutation operators and need to be better analyzed in future works. Other aspects to be noticed here is that the substitution strategies of population in AIS algorithms are more elitist than GA where the best individual is always selected. ACO is also more elitist than GA once only the best ant adds pheromone at the pheromone matrix. An interesting characteristic of the opt-aiNet algorithm, when compared with other evolutionary algorithms, such as GA, is the dynamic variation of population size at run time by suppression of the similar solutions and the generation of new random individuals (antibodies).
Some limitations of our study are: the algorithms need to know the number of clusters and the experiment were not performed using a fixed computational cost. Future works are going to focus on these issues.
7 Acknowledgments
This work was supported by Fundação Araucária, CAPES/Reuni and CNPq.
]]>
References
1. M. Bramer. “Principles of Data Miningâ€. Springer, 2007.
2. J. Han and M. Kamber. “Data mining: Concepts and Techniquesâ€. Morgan Kaufmann Publisher, San Francisco, 2001.
3. R. H. Sheikh, M. M. Raghuwanshi, and A. N. Jaiswal. “Genetic Algorithm Based Clustering: A Surveyâ€. Proceedings of the 2008 First International Conference on Emerging Trends in Engineering and Technology (ICETET), pp. 314-319, 2008.
4. G. Garai and B. B. Chaudhuri. “A Novel Genetic Algorithm for Automatic Clusteringâ€. Pattern Recognition Letters, vol. 25, n.2, pp.173-187, 2004.
5. Y. Kao and K. Cheng. “An ACO-Based Clustering Algorithmâ€. Lecture Notes in Computer Science, vol. 4150, pp. 340-347, Springer, 2006.
6. P. S. Shelokar, V. K. Jayaraman and B. D. Kulkarni. “An Ant Colony Approach for Clusteringâ€.Analytica Chimica Acta 509, pp. 187–195, 2004.
7. D. Karaboga and C. Ozturk. “A Novel Clustering Approach: Artificial Bee Colony (ABC) Algorithmâ€. Applied Soft Computing, vol. 11, n. 1, pp. 652–657, 2011.
8. N. Tang and R. Vemuri. “An Artificial Immune System Approach to Document Clusteringâ€. Proceedings of the 2005 ACM symposium on Applied computing, pp. 918-922, 2005.
]]> 9. T. E. Colanzi, W. K. G. Assunção, A. C. B. K. Vendramin, D. A. B. Pereira, and A. T. R. Pozo. “Empirical Studies on Application of Genetic Algorithms and Ant Colony Optimization for Data Clusteringâ€. Proceedings of XXIX International Conference of the Chilean Computer Science Society (SCCC), Antofagasta/Chile, pp. 1-10, 2010.10. L. N. de Castro and J. Timmis. “Artificial Immune Systems: A New Computational Intelligence Approachâ€. Springer-Verlag, 2002.
11. R. Xu and D. Wunsch II . “Survey of Clustering Algorithmsâ€. IEEE Transactions on neural networks, vol. 16, n. 3, pp. 645- 678, 2005.
12. W. A. Barbakh, Y. Wu, and C. Fyfe. “Non-Standard Parameter Adaptation for Exploratory Data Analysisâ€. vol. 349, Springer, 2009.
13.. E. R. Hruschka, R. J. G. B. Campello, A. A. Freitas, and A. C. P. L. F. de Carvalho. “A Survey of Evolutionary Algorithms for Clusteringâ€. IEEE Transactions on Systems, Man, and Cybernetics, Part C: Applications and Reviews, vol. 39, n. 2, pp. 133-155, 2009.
14.. K. Krishna and M. N. Murty. “Genetic K-Means Algorithmâ€. IEEE Transactions on Systems, Man, and Cybernetics, vol. 29, n. 3, pp.433-439, 1999.
15. Y. Lu, S. Lu, and F. Fotouhi. “FGKA: A Fast Genetic K-means Clustering Algorithmâ€. Proceedings of ACM SIG Symposium on Applied Computing (SAC’04), Nicosia, Cyprus, pp. 622-623, 2004.
16. Y. Lu, S. Lu, F. Fotouhi, Y. Deng, and S. J. Brown. “Incremental Genetic K-means Algorithm and its Application in Gene Expression Data Analysisâ€, BMC Bioinformatics, vol. 5, n. 172, 2004.
17. U. Maulik and S. Bandyopadhyay. “Genetic Algorithm Based Clustering Techniqueâ€. Pattern Recognition, vol. 33, n. 9, pp. 1455-1465, 2000.
18. J. Timmis; M. Neal; J. Hunt. “Data analysis with artificial immune systems, cluster analysis and Kohonen networks: some comparisonsâ€. Proceedings of the International Conference on Systems, Man and Cybernetics, p. 922-927, 1999.
]]> 19. L. N. de Castro and F. J. Von Zuben. “The Clonal Selection Algorithm with Engineering Applications,†GECCO 2000, Workshop on Artificial Immune Systems and Their Applications, Las Vegas, USA, pp. 36-37, 2000.20. L. N. de Castro and F. J. Von Zuben. “An Evolutionary Immune Network for Data Clusteringâ€. Proceedings of the Sixth Brazilian Symposium on Neural Networks, Rio de Janeiro, Brazil, pp. 84-89, 2000.
21. L. Tao; Z. Yan and H. Zhifeng. “A New Clustering Algorithm Based On Artificial Immune Systemâ€, Fuzzy Systems and Knowledge Discovery, vol. 2, pp. 347-351, 2008.
22. L. N. de Castro and J. Timmis. “An Artificial Immune Network for Multimodal Function Optimizationâ€. Congress on Evolutionary Computation. IEEE World Congress on Computational Intelligence, Honolulu, Hawaii, USA, 2002.
23. K. Sastry, D. Goldberg, and G. Kendall. “Genetic Algorithmsâ€. In: E. K. Burke and G. Kendall. Search Methodologies: Introductory Tutorials in Optimization and Decision Support Techniques, Springer, pp. 97-125, 2005.
24. A. M. Coelho. “A Memetic Approach to School Timetable Problemâ€. 2006. Dissertação (Mestrado). Centro Federal de Educação Tecnológica de Minas Gerais, Belo Horizonte: CEFET-MG. 115p (In Portuguese).
25. J. Bigus and J. Bigus. “Constructing Intelligent Agents using Javaâ€. New York: Wiley, 2001.
26. S. J. Russell and P. Norvig. “Artificial Intelligence: A Modern Approachâ€. 2nd ed., Upper Saddle River, New Jersey: Prentice Hall, 2003.
27. S. Gárcia, D. Molina, M. Lozano, and F. Herrera. “A Study on the Use of Non-parametric Tests for Analyzing the Evolutionary Algorithms’ Behaviour: a case study on the CEC’2005 Special Session on Real Parameter Optimizationâ€. Journal of Heuristics, vol. 15, n. 6, 2009, pp. 617–644.
28. M. Dorigo. “Optimization, Learning and Natural Algorithmsâ€. PhD thesis, Politecnico di Milano, 1992.
]]> 29. M. Dorigo. “Learning by Probabilistic Boolean Networksâ€. Proceedings of the IEEE International Conference on Neural Networks, pp. 887-891, 1994.30. L. N. de Castro. “Immune Engineering: Development and Application of Computational Tools Inspired Artificial Immune Systemsâ€. Thesis (Doctoral). Federal University of Campinas, School of Computer and Electrical Engineering, 2001 (in Portuguese).
31. J. Brownlee. “Clonal Selection Theory and Clonalg: the Clonal Selection Classification Algorithm (CSCA)â€. Swinburne University of Technology, 2005.
32. A. B. de Carvalho and A. T. R. Pozo . “Mining Rules: A Parallel Multiobjective Particle Swarm Optimization Approachâ€. In: Coello Coello, Carlos A.; Dehuri, Satchidananda; Ghosh, Susmita. (Org.). Swarm Intelligence for Multi-objective Problems in Data Mining. Springer Berlin / Heidelberg, v. 242/09, pp. 179-198, 2009.
33. A. Frank and A. Asuncion. UCI Machine Learning Repository [http://archive.ics.uci.edu/ml]. Irvine, CA: University of California, School of Information and Computer Science, 2010.
34. R-Project. The R Project for Statistical Computing. <http://www.r-project.org/>. Access: June 11th, 2010.
35. A. C. B. K. Vendramin, D. A. Pereira, and A. Pozo. “A Local Search Technique to Improve the Ant Colony Optimization Metaheuristic in Database Instances Clusteringâ€. V SULCOMP - Congresso Sul Brasileiro de Computação, 2010, Criciúma. Anais do V Sulcomp, 2010 (in Portuguese).
36.K. D. Maxwell. “Applied Statistics for Software Managersâ€. Prentice Hall PTR, 2002.
]]>
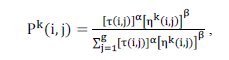 , (3)
, (3) 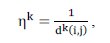 , (4)
, (4)  (5)
(5)  (7)
(7)  (8)
(8)  (9)
(9) , (10)
  , (11)