Correlaciones policóricas y tetracóricas en estudios factoriales exploratorios y confirmatorios
POLYCHORIC AND TETRACHORIC CORRELATIONS IN EXPLORATORY AND CONFIRMATORY FACTORIAL STUDIES
Agustín Freiberg Hoffmann
Universidad de Buenos Aires
Juliana Beatriz Stover
[Universidad de Buenos Aires
Universidad de Buenos Aires
Consejo Nacional de Investigaciones Científicas y Técnicas (CONICET)
Mercedes Fernández Liporace
Universidad de Buenos Aires
Consejo Nacional de Investigaciones Científicas y Técnicas (CONICET)
Resumen: El incremento de estudios exploratorios y confirmatorios en psicometría debido al avance tecnológico obliga a revisar su metodología. Generalmente estos estudios utilizan el coeficiente de correlación r de Pearson, diseñado para variables continuas y extendido posteriormente a las categóricas (dicotómicas o politómicas). Los paquetes estadísticos actuales permiten aplicar procedimientos robustos ideados específicamente para variables categóricas, entre los que se destacan las correlaciones tetracóricas y policóricas, cuya relevancia metodológica radica en que la mayoría de las escalas psicométricas se compone de reactivos dicotómicos y politómicos (principalmente formatos Likert). El presente trabajo expone en primer lugar particularidades vinculadas al uso de estos estadísticos, softwares que facilitan su ejecución, problemas asociados a su aplicación y posibles soluciones a los mismos. En segundo término se ejemplifican ambas metodologías tanto en análisis factorial exploratorio como confirmatorio.
Palabras Clave: correlaciones tetracóricas, correlaciones policóricas, análisis factorial, variables categóricas, ítems ordinales, ítems dicotómicos.
]]>Abstract: Scientific advances and software development have increased the amount of exploratory and confirmatory studies in psychometric research. Regularly these studies use Pearson´s correlation coefficient, which was originally conceived to be used with continuous variables, and later was extended to categorical items (dichotomous or polytomous). Currently, improved statistical packages allow scientists to carry on robust procedures, designed specifically for categorical variables, among which stand out tetrachoric and polychoric correlations. Since most of psychometric scales consist in dichotomous and polytomous items (mainly Likert formats), the analysis of such correlations becomes methodologically relevant. This paper presents some peculiarities about the use of these statistics, different software packages to facilitate their implementation, as well as the usual problems associated with its employment, and the possible solutions are discussed.
Keywords: tetrachoric correlations, polychoric correlations, factor analysis, categorical variables, ordinal items, dichotomous items
Este estudio se enmarca en una investigación subsidiada por la Universidad de Buenos Aires, y presenta el avance parcial de una beca de doctorado otorgada por esa casa de estudios.
Correspondencia: Agustín Freiberg Hoffmann. Facultad de Psicología, Universidad de Buenos Aires.
Correo Electrónico: afreiberg@psi.uba.ar
]]> Recibido: 05/2013
Revisado: 08/2013
Aceptado: 09/2013
Introducción
Los últimos avances en análisis factorial en psicometría se encuentran ligados en buena medida al desarrollo de tecnologías informáticas, especialmente en relación al acceso masivo a programas personales para cálculos estadísticos específicos. Dentro de los paquetes más difundidos puede mencionarse el IBM SPSS Statistics 21 (IBM Corporation, 2012a), el SYSTAT 13.1 (SYSTAT Software, 2010), el IBM AMOS 21 (IBM Corporation, 2012b), el EQS 6.2 (Multivariate Software, 2012), LISREL 8 (Scientific Software International, 2006) y MPLUS 7 (Muthén & Muthén, 2012), entre otros. Estos aplicativos permiten examinar cuantiosos datos y acceder a niveles cada vez más profundos y precisos de análisis. A partir del acelerado avance informático emergen ciertas limitaciones que llevan a los investigadores a poner en tela de juicio el cálculo de algunos estadísticos tradicionalmente utilizados, proponiendo su reemplazo por otros procedimientos más adecuados a las características de las variables. Es así como desde aquellas falencias metodológicas que limitan el alcance de los resultados surgen constantes alternativas tendientes a mejorar la calidad de los análisis y de los soportes estadísticos.
El presente trabajo recoge los aportes de diversos teóricos abocados al análisis metodológico de variables categóricas. De este modo, se expone sintéticamente el tratamiento que debe aplicarse ante este tipo de reactivos en estudios factoriales exploratorios y confirmatorios. Se describe en primer lugar la modalidad utilizada tradicionalmente para el abordaje de elementos dicotómicos y politómicos, aludiendo a la propuesta metodológicamente apropiada en cada caso. Luego se pone el foco en los procesadores y procedimientos estadísticos que mejor se ajustan a las características de los datos recogidos, abordando posibles dificultades y soluciones. Finalmente se analizan dos casos, uno con variables dicotómicas y otro con ordinales, a fin de confrontar los resultados entre correlaciones tetracóricas y policóricas con las de Pearson mediante análisis factorial exploratorio y confirmatorio.
Dado que la mayoría de los instrumentos psicométricos cuenta con variables categóricas en su sistema de respuestas, se espera aportar información útil vinculada al adecuado tratamiento de aquellas en procedimientos factoriales.
Estudios exploratorios y confirmatorios con variables categóricas
Los diseños factoriales deben su origen a las ideas iniciales de Galton en 1883, ulteriormente retomadas y puestas en marcha por Pearson y Spearman. Este último fue el iniciador de los procedimientos factoriales exploratorios en el ámbito de la psicología, habiendo sentado las bases de la teoría clásica de los tests. Por su parte, los análisis factoriales confirmatorios se originaron a partir de los trabajos de Lawley y Maxwell en 1971; en la actualidad Jöreskog es uno de los autores más destacados en esta área (Martínez Arias, 2005).
Como es sabido, todo análisis factorial es entendido como un método que busca explicar mediante un pequeño número de variables latentes (factores) un conjunto de variables observadas (Kline, 2000). De este modo cada factor verifica empíricamente la covariación entre las respuestas a los reactivos de una escala correspondiente a una dimensión del comportamiento propuesta para un constructo que, teóricamente, le diera origen (Yela, 1966).
El proceso de factorización relaciona todas las respuestas dadas por los sujetos a los reactivos. La modalidad de respuesta es determinada a través del proceso de escalamiento, que se describe como las reglas adoptadas para vincular los estímulos a los números (Stevens, 1951). De este modo la ponderación de un atributo depende del nivel de medición elegido (nominal, ordinal, intervalar, razón) y sus reglas intrínsecas, que establecen los tipos de análisis adecuados para ser aplicados en cada ocasión.
Los diferentes instrumentos construidos en psicología para evaluar una diversidad de rasgos (personalidad, aptitudes, estilos de aprendizaje, entre otros) responden en su mayoría a algún tipo de escala ordinal (Likert) o bien nominal (dicotómica).
En psicometría clásica los estudios exploratorios -análisis factorial exploratorio (AFE) y análisis de componentes principales (ACP)- y el análisis factorial confirmatorio (AFC), constituyen métodos que tienen por objeto establecer evidencias de validez de constructo. Para que estos procedimientos tengan lugar se debe partir de matrices de correlaciones que permitan estimar las covariaciones entre los elementos que componen la herramienta (Choi, Peters, & Mueller, 2010), siendo las más utilizadas por los profesionales las correlaciones de Pearson (para variables que cumplen con los supuestos de continuidad y paramétricos). El difundido uso de este estadístico en la disciplina asume implícitamente que las variables de naturaleza categórica (ordinal y dicotómica), responden a un nivel de medición intervalar (Christoffersson, 1975; Morales Vallejo, 2006). La medición de atributos a partir de estas escalas categóricas, cuyas propiedades métricas carecen de toda justificación es catalogada por la teoría de la medición como medidas por mandato o medidas por definición (Pfanzagl, 1968; Torgerson, 1958).
Actualmente este tratamiento intervalar de las variables se encuentra bajo la lupa, proponiéndose el reemplazo de la convencional matriz de correlaciones de Pearson por la que corresponda al caso.
De acuerdo con ciertos autores los tipos de correlaciones que deben aplicarse a cada estudio (AFE, ACP, AFC) dependen del nivel de medición de las variables que participen del mismo (Lévy Mangin, Martín Fuentes y Román González, 2006; Manzano Patiño y Zamora Muñoz, 2009; Ogasawara, 2011). De esta manera si todas ellas son continuas la matriz debe responder al modelo de Pearson. Si todas son dicotómicas se utiliza una matriz de correlación tetracórica (TCC). Si la totalidad es ordinal o algunas son ordinales y otras dicotómicas, corresponde el uso de una matriz de correlación policórica (PCC). Por otro lado, si algunas son continuas y otras son ordinales se emplea una matriz de correlación poliserial. De igual modo se trabaja con una matriz de correlación punto biserial si se trata de variables continuas y dicotómicas.
Debido a que la mayoría de los instrumentos psicométricos son diseñados con escalas categóricas, se pondrá el acento sobre el tipo de matrices poli y tetracóricas para su tratamiento factorial.
En estudios exploratorios y confirmatorios las correlaciones TCC y PCC son utilizadas para el tratamiento de variables puramente dicotómicas (TCC), puramente ordinales (PCC) y para el análisis de la interacción entre dicotómicas y ordinales (PCC) (Richaud, 2005).
Ambos tipos de estadísticos comparten los mismos supuestos y fórmulas, diferenciándose particularmente en el número de categorías que compone sus escalas. Esta clase de correlaciones parte de la idea de que existe una serie de variables inobservables o latentes de naturaleza continua, sobre las cuales se construyen las variables observables (ítems) ya sean estas dicotómicas o politómicas. De acuerdo con este supuesto las opciones de respuesta de las observables establecerían una suerte de umbrales sobre el continuo de las latentes (Christoffersson, 1975; Juras & Pasaric, 2006; Muthén, 1984). De este modo los dos valores de las dicotómicas simbolizarían ambos polos del continuo, y las distintas chances de respuesta de las politómicas indicarían matices intermedios hasta alcanzar los extremos (Ferrando Piera y Lorenzo Seva, 1993; Maydeu Olivares, Forero, Gallardo Pujol, & Renom, 2009).
Supuestos que subyacen al empleo de correlaciones PCC y TCC
La aplicación de correlaciones PCC y TCC exige tener en cuenta una serie de supuestos propios de variables paramétricas, que de no cumplirse requieren de la adopción de ciertas precauciones metodológicas. Pueden mencionarse los de normalidad y continuidad por un lado, y la relación entre amplitud de la muestra y número de variables observadas por el otro (Byrne, 2006).
Supuesto de Normalidad y Continuidad
Si bien las correlaciones PCC y TCC operan bajo el supuesto de normalidad multivariada de los ítems en análisis, distintos autores destacan que la violación del mismo no trae aparejadas consecuencias estadísticamente significativas sobre los resultados (Holgado Tello, Chacón Moscoso, Barbero García, & Vila Abad, 2010; Muthén & Hofacker, 1988). Según Jöreskog (2001), las estimaciones obtenidas a partir de variables con distribución asimétrica no son severamente alteradas si los valores del índice de ajuste root mean square error (RMSEA) se mantienen dentro de los estándares aceptados (0 - 0.08). Resulta ser este un dato útil ya que en ciencias sociales y humanas el supuesto de normalidad multivariada no siempre se cumple.
Respecto del criterio de continuidad, se torna importante destacar que si bien las variables observables categóricas (nominal y ordinal) por su propia naturaleza quedan excluidas del nivel de medición continuo (intervalar y razón), esto no constituye un impedimento para la ejecución de los análisis debido a que las correlaciones TCC y PCC son calculadas a partir de las variables latentes (a las que sí se supone continuas), que subyacen a las observables.
Amplitud de la Muestra y Número de Reactivos
Según estos supuestos el tamaño de la muestra reviste gran importancia en cuanto a la estimación de parámetros, de cara a evitar inconvenientes. El número de casos necesarios se encuentra estrechamente relacionado con la cantidad de reactivos incluidos en el análisis, así como con su número de categorías. Cuantas más variables y opciones de respuesta se incluyan en el estudio, más grande debe ser la muestra de datos que se recoja (Byrne, 2006). Si bien no existen amplitudes predeterminadas se establece como mínimo un N≥150 (Schumacker & Lomax, 2004). Es también importante destacar que si bien no hay un límite consensuado para la cantidad de ítems, se recomienda en el caso de utilizarse estadísticos no paramétricos, no superar los 30 debido a que los análisis que subyacen al procedimiento revisten gran complejidad. Solo es posible exceder esa cantidad si se emplean métodos robustos (Muthén & Kaplan, 1985).
La recurrente violación de los supuestos mencionados y la ocurrencia de datos anómalos (casos outliers) en la investigación con variables categóricas mediante procedimientos paramétricos y no paramétricos produce en la mayoría de casos estimaciones imprecisas (Ortiz León, 1988). Con el objeto de mejorar estos resultados la comunidad científica propone revisar ambos métodos a fin de mejorar sus estimaciones sobre variables no paramétricas. A partir de las modificaciones efectuadas tendientes a adecuar los procedimientos a las características de las variables surgen los métodos robustos, que permiten eliminar de forma relativa la influencia de observaciones extremas, conservar inalteradas las estimaciones de las tasas de error tipo I manteniéndolas dentro de los valores nominales y a la vez salvaguardar una adecuada potencia estadística (Erceg Hurn & Mirosevich, 2008). Cabe destacar que si bien esta modalidad es más demandante a nivel computacional, a diferencia de otras autoriza a trabajar con muestras pequeñas (Hoyle, 1995).
Dos aspectos motivan el creciente uso de métodos robustos en psicometría en los últimos tiempos. Por una parte más investigadores eligen esta clase de estadísticos debido a que los softwares comienzan a incluirlos permitiendo obtener estimaciones más potentes (Méndez Alonso, 2001). Por otro lado se advierte la necesidad de adecuación a las normas internacionales de publicación exigidas por la American Psychological Association, que recomiendan ciertas líneas de construcción de los apartados al trabajar con variables categóricas (American Psychological Association [APA], 2010).
Métodos de estimación de parámetros
Los estudios factoriales confirmatorios basan sus análisis en la comparación de la matriz de covarianza muestral con una matriz de covarianzas estimadas, propuesta por el modelo que se intenta reproducir. El cotejo entre ambas se realiza a través de una función de ajuste que es determinada a partir del método de estimación de parámetros que se elija para representar lo más fielmente que resulte posible la matriz de covarianza muestral (Bentler, 2006).
Si bien existen diversos métodos de estimación, hay algunos que se ajustan mejor a los requerimientos de las matrices de covarianzas que se originan a partir de correlaciones TCC y PCC. Cabe destacar que la disponibilidad de métodos de estimación con la que cuenta el investigador dependerá del tipo de programa que decida utilizar. Los métodos más adecuados para este caso serían los no paramétricos -como por ejemplo los de distribución libre asintótica (ADF)-, los robustos -tales como el de máxima verosimilitud robusto (ML Robusto) y mínimos cuadrados ponderados robustos (WLS robusto)-, y otros menos apropiados pero pasibles de ser utilizados -como mínimos cuadrados no ponderados (ULS) y mínimos cuadrados generalizados (GLS)- (Bollen, 1989; Brown, 2006; Christoffersson, 1975; Flora & Curran, 2004; Holgado Tello et al., 2010; Jöreskog & Sörbom, 1999; Kline, 2005).
Los métodos más difundidos de distribución libre asintótica (ADF) son los de mínimos cuadrados ponderados (WLS), mínimos cuadrados ponderados diagonales (DWLS) y mínimos cuadrados generalizados asintóticos (AGLS). Su uso se sustenta en que los resultados no sufren alteraciones sustanciales aún cuando se viole el supuesto de normalidad (Manzano Patiño y Zamora Muñoz, 2009). No obstante esta ventaja su aplicación requiere contar con muestras suficientemente amplias para obtener estimaciones consistentes (N > 200) (Bollen, 1989; Kline, 2005; Schermelleh-Engel, Moosbrugger & Müller, 2003).
Los métodos robustos de máxima verosimilitud (ML Robusto) o de mínimos cuadrados ponderados robustos (WLS robusto) son algunos de los más difundidos. Estos se adecuan a las necesidades de las variables categóricas y, a diferencia de los métodos de distribución libre asintótica, no requieren de muestras grandes (Byrne, 2006; Flora & Curran, 2004).
Las estimaciones por mínimos cuadrados no ponderados (ULS), por su parte, pueden ser utilizadas con muestras pequeñas (N=200) y en especial cuando se poseen pocos elementos por cada factor. Si bien este procedimiento es aplicable a todo tipo de variables categóricas, sus mejores resultados se observan con reactivos dicotómicos (Forero, Maydeu Olivares y Gallardo Pujol, 2009; Muthén, 1983).
El método de mínimos cuadrados generalizados (GLS), al igual que los métodos ADF es empleado con muestras amplias y es susceptible de aplicarse con distribuciones no normales (González Álvarez, Abad González y Lévy Mangin, 2006). Asimismo este estimador es muy demandante en cuanto al nivel de procesamiento de datos, desaconsejándose su uso cuando el número de variables a analizar supera el valor de 30 (Muthén, 1989).
Consistencia interna
La consistencia interna constituye uno de los métodos más utilizados para estimar una medida de confiabilidad de las dimensiones aisladas en estudios exploratorios y confirmatorios. Comúnmente su cálculo se efectúa sobre las variables observadas siendo el procedimiento mayormente utilizado -independientemente del nivel de medición- el índice alfa de Cronbach (mediante correlaciones de Pearson). Pese a la generalizada aplicación de esta metodología, cada vez se emplea con mayor frecuencia el estadístico alfa ordinal, diseñado específicamente para el tratamiento de variables categóricas (dicotómicas y politómicas) con el fin de evitar infraestimaciones de los resultados (Gadermann, Guhn, & Zumbo, 2012). Para estos casos son utilizadas también las correlaciones TCC y PCC.
Las matrices TCC y PCC ofrecen una valoración indirecta de la consistencia interna a través del denominado alfa ordinal, que la calcula ya no sobre las variables observadas, sino sobre las latentes, que se suponen continuas. En otras palabras la confiabilidad de cada escala se pondera a partir de la relación entre las respuestas dadas a cada ítem y su variable latente. Según se afirma, este procedimiento se aproxima a la idea de modelización de variables ordinales, aportando como principal beneficio la invariancia de las estimaciones, puesto que las mismas al obtenerse a partir de las variables latentes guardan independencia respecto del número de categorías de las escalas (Elosua Oliden y Zumbo, 2008).
Software estadístico para estudios exploratorios y confirmatorios
En el presente apartado se consideran tanto los estudios factoriales exploratorios (AFE y ACP) como los confirmatorios (AFC), describiéndose dos programas para cada uno. Tales utilitarios permiten el tratamiento de los datos mediante matrices de correlaciones TCC y PCC en computadoras personales.
Estudios Exploratorios
Uno de los softwares más utilizados en estudios exploratorios con variables dicotómicas es el SYSTAT 13.1 (SYSTAT Software, 2010). Permite importar matrices en diversos formatos incluyendo las confeccionadas en SPSS. Su lógica exige que para llevar a cabo los análisis el numeral asignado al menor valor sea el cero. Este programa posee la opción de calcular una multiplicidad de matrices de correlaciones entre las que se encuentra la tetracórica, ubicada dentro de la opción de datos binarios. Por otra parte el tratamiento de variables ordinales mediante matrices de correlaciones policóricas, por el momento, no es posible. El SYSTAT habilita a efectuar análisis exploratorios a partir de la matriz de correlaciones tetracóricas estimada previamente, sin necesidad de abrir la base de datos que le diera origen.
Un programa que sí admite la realización de análisis exploratorios tanto de variables dicotómicas como politómicas, es el FACTOR 8 (Lorenzo Seva y Ferrando Piera, 2012). Posee la ventaja adicional de ser más accesible que el SYSTAT, dado que es de distribución gratuita. Este paquete sólo reconoce bases de datos con extensión .dat, que pueden ser obtenidas de los programas SPSS y SYSTAT a través de la opción guardar como, “ASCII fijo” o “ASCII texto”, respectivamente. Este soporte lógico necesita para su ejecución importar la base de datos, especificar el número de variables contenidas en la misma y el número de casos. Una vez explicitada esta información es posible acceder al análisis exploratorio de un modo sencillo. Luego de seleccionar las variables a analizar se debe fijar la opción que permite analizar los datos mediante una matriz de correlaciones tetracórica/policórica. Otra de sus ventajas es que como resultado del análisis presenta un reporte detallado que incluye información sobre la medida de adecuación muestral de Kaiser-Meyer-Olkin y la prueba de esfericidad de Barttlet. Asimismo calcula la consistencia interna mediante el coeficiente alfa de Cronbach ordinal para cada una de las dimensiones extraídas a partir de la matriz de correlaciones TCC y PCC.
Análisis Factorial Confirmatorio
El EQS, dentro de las opciones mencionadas para la estimación de parámetros, permite aplicar los métodos GLS, AGLS y ML robusto. Asimismo calcula el alfa ordinal para cada una de las dimensiones que integran el modelo propuesto.
Otro soporte lógico para el análisis factorial confirmatorio a partir de matrices de correlaciones tetra y policóricas es el LInear Structural RELations (LISREL) 8 (Scientific Software International, 2006). Este aplicativo requiere que con antelación a la ejecución del AFC sea calculada una matriz de correlaciones tetra o policórica (que el programa efectúa de modo automático según las categorías de las variables introducidas). En segundo lugar se obtiene a partir de aquélla, una matriz de covarianza. Una vez finalizado este paso es posible proceder con el análisis, que puede llevarse a cabo fácilmente a través de una sintaxis. De los métodos de estimación de parámetros referenciados, en LISREL es posible aplicar GLS, WLS, DWLS y ULS.
Dificultades relacionadas con la aplicación de correlaciones TCC y PCC
En comparación con las de Pearson, el uso de correlaciones TCC y PCC suele producir con mayor frecuencia dos clases de problemas: la falta de convergencia y la ocurrencia de soluciones impropias (Cuttance, 2009). La no convergencia alude a la incapacidad de estimar valores positivos suficientemente pequeños a partir de las interacciones entre ítems, de manera que indiquen alguna similitud entre el modelo propuesto y los datos provenientes de las variables observadas. Esto provoca que en ocasiones el programa utilizado tenga dificultades para generar una matriz positiva (covariance matrix nonpositive definite), es decir que todos los valores sean superiores a cero, provocando un error de ejecución e interrumpiendo el análisis.
Las soluciones impropias más comunes se asocian con la estimación de parámetros cuyos valores se encuentran por fuera del rango permitido (entre 0 y 1). Por un lado están los denominados casos Heywood, que comprenden estimaciones negativas en algún parámetro; por otra parte se encuentran las relacionadas con valores superiores a 1 (Brown, 2006).
Distintas investigaciones han estudiado aquellos factores causales de soluciones impropias a partir del uso de matrices TCC y PCC (Ferrando Piera y Lorenzo Seva, 1994; Flora & Curran, 2004). Uno de ellos está dado por el método de estimación utilizado, siendo los de ADF (WLS y AGLS) los más problemáticos, por lo que se desaconseja su empleo. Ciertos autores sostienen que estos métodos de estimación deben aplicarse sólo con muestras amplias de un mínimo de N=800 y con N>1000, en el caso de haber más de 15 variables observadas (Boomsma, 2000; Olsson, Foss, Troye & Howell, 2000). Otros plantean la posibilidad de su empleo mediante la aplicación del procedimiento de Bootstrap (Yung y Bentler, 1994).
Si bien el número de casos necesarios para minimizar la ocurrencia de soluciones impropias se encuentra íntimamente relacionado con la cantidad de indicadores por factor y con el método de estimación que se desea aplicar, el consenso entre autores establece en cualquier caso como base un N≥ 200 (Boomsma, 1983; Katsikatsou, Moustaki, Yang-Wallentin y Jöreskog, 2012).
Es importante considerar que existen ciertas maniobras tendientes a encuadrar los valores de las ecuaciones infractoras dentro de los rangos permitidos (entre 0 y 1). Una de las soluciones más comunes propone fijar el parámetro a un valor positivo lo más cercano a cero (Kolenikov, Bollen y Savalei, 2006; Rial Boubeta, Varela Mallou, Abalo Piñeiro y Lévy Mangin, 2006). Por otro lado, si la estimación infractora corresponde a una variable observable, ésta puede ser suprimida tomando siempre los recaudos necesarios (Schumacker y Lomax, 2004). Otra alternativa propone indagar en la base de datos la presencia de casos outliers (datos extremos) que podrían estar afectando los análisis, eliminándolos consecuentemente (West, Finch y Curran, 1995).
Conviene destacar que el modelo puede exhibir adecuados niveles de ajuste aun cuando presente soluciones impropias. Algunos teóricos en sus estudios concluyen que la presencia de ecuaciones infractoras no sería un factor determinante para el ajuste de un modelo y que su no tratamiento es una alternativa a tener en cuenta (Chen, Bollen, Paxton, Curran y Kirby, 2001; Gerbing y Anderson, 1987).
Este apartado expone los resultados derivados de la aplicación de los procedimientos desarrollados, a fin de detectar diferencias entre ellos. Se excluye asimismo la posibilidad de compararlos, debido a que esto último solo sería posible a través de la aplicación de técnicas de simulación (que permiten determinar qué método funciona mejor en base a la comparación de las distancias muestrales respecto de las propiedades poblacionales de los datos), cuestión que excede los objetivos planteados en este estudio.
Para esto se analizaron, a partir de correlaciones Pearson, TCC y PCC, datos recogidos mediante dos instrumentos -uno con escala de respuesta dicotómica y el otro, politómica-.
La información recolectada en cada caso se examinó mediante un procedimiento factorial exploratorio en un primer momento, y tras la toma de datos en una nueva muestra se practicaron los respectivos análisis factoriales confirmatorios.
Método
Instrumentos
Cuestionario Honey-Alonso de Estilos de Aprendizaje (CHAEA) (Alonso, Gallego y Honey, 1994), Adaptación UBA (Freiberg Hoffmann y Fernández Liporace, 2013). Evalúa mediante una modalidad de respuesta dicotómica cuatro estilos o dimensiones: convergente, asimilador, adaptador y pragmático.
Coping Responses Inventory - Youth Form (Moos, 1993), Adaptación UBA-CONICET (Rial Boubeta, de la Iglesia, Ongarato y Fernández Liporace, 2011). La herramienta evalúa mediante una escala tipo Likert de cuatro posiciones, cuatro dimensiones de afrontamiento: aproximación cognitiva, aproximación conductual, evitación cognitiva, evitación conductual.
Participantes análisis factorial exploratorio
Para el Cuestionario Honey-Alonso de Estilos de Aprendizaje (CHAEA) (Alonso et al., 1994), Adaptación UBA (Freiberg Hoffmann y Fernández Liporace, 2013): 443 estudiantes universitarios de Buenos Aires (41.3% varones y 58.7% mujeres), ![]() edad = 22.7; D.T.= 3.32.
edad = 22.7; D.T.= 3.32.
Participantes análisis factorial confirmatorio
Para el Cuestionario Honey-Alonso de Estilos de Aprendizaje (CHAEA) (Alonso et al., 1994), Adaptación UBA (Freiberg Hoffmann y Fernández Liporace, 2013): 692 estudiantes universitarios de Buenos Aires (39.1% varones y 60.9% mujeres), ![]() edad= 21.7; D.T.= 3.32.
edad= 21.7; D.T.= 3.32.
Coping Responses Inventory - Youth Form (Moos, 1993; Rial Boubeta et al., 2011): 1131 estudiantes (33.8% varones y 66.2% mujeres) 43.2% de educación media, ![]() edad = 15.41; D.T.= 1.48, y 56.8% de nivel universitario,
edad = 15.41; D.T.= 1.48, y 56.8% de nivel universitario, ![]() edad = 24.41; D.T.= 5.77, de Buenos Aires.
edad = 24.41; D.T.= 5.77, de Buenos Aires.
Análisis de datos
Los análisis factoriales exploratorios fueron realizados mediante el software FACTOR 8, mientras que los confirmatorios se efectuaron a través de las aplicaciones LISREL 8 y EQS 6.2, a fin de practicar diferentes métodos de estimación.
Resultados
Análisis factorial exploratorio correlaciones Pearson, Tetracóricas y Policóricas
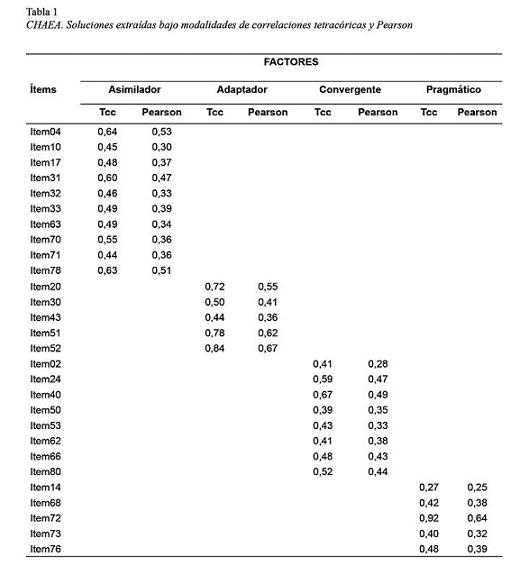
En primer lugar se analizó el Cuestionario Honey-Alonso de Estilos de Aprendizaje (CHAEA) (Alonso et. al.,1994), Adaptación UBA (Freiberg Hoffmann y Fernández Liporace, 2013). Se fijó la extracción a cuatro factores y se aplicó el método de mínimos cuadrados no ponderados (ULS) con rotación Varimax y normalización Kaiser, observándose un regular ajuste y balance entre el número de sujetos y de ítems, tanto en la metodología tetracórica (KMO=.621 Test de Esfericidad de Bartlett: X²=4595.45 gl; 378 sig<.01) como en la de Pearson (KMO=.721 Test de Esfericidad de Bartlett: X²= 1576.2 gl; 378 sig<.01). Por otra parte, si bien es aconsejable eliminar todos los reactivos cuya carga en un factor no hubiera superado el valor de .40 (Nunnally & Bernstein, 1994), a los fines didácticos perseguidos por el presente estudio se decidió conservarlos.
La Tabla 1 muestra las saturaciones de los ítems respecto de los factores. Como puede advertirse, independientemente de la metodología empleada, (TCC o Pearson) los reactivos analizados por ambas mantuvieron sus cargas en las mismas dimensiones, aunque difiriendo en sus magnitudes.
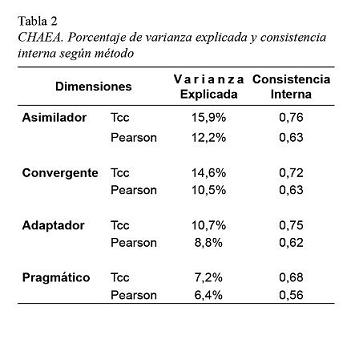
]]>Por otro lado, de la lectura de la Tabla 2 se desprende que el uso de correlaciones tetracóricas difiere de las de Pearson también respecto del porcentaje de varianza explicada por cada factor, así como también en cuanto a los índices de consistencia interna.
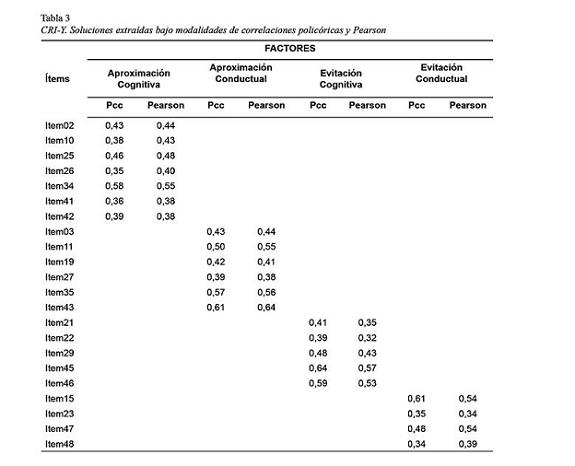
En segundo lugar se aplicó el mismo análisis al Coping Responses Inventory - Youth Form (Moos, 1993; Rial Boubeta et. la., 2011). La extracción fue fijada en cuatro factores, aplicándose posteriormente el método de mínimos cuadrados no ponderados (ULS) con rotación Varimax y normalización Kaiser, observándose un moderado ajuste y balance entre el número de sujetos y de ítems, tanto en la metodología policórica (KMO=.789; Test de Esfericidad de Bartlett: X²=3025 gl; 231 sig<.01) como en la de Pearson (KMO=.791; Test de Esfericidad de Bartlett: X²=2832.3 gl; 231 sig<.01). Procediendo con idéntico criterio didáctico que en el paso anterior, se conservaron todos los reactivos cuya carga en un factor no superara el valor de .40.
La Tabla 3 permite apreciar que todos los elementos saturan en los mismos factores, independientemente del método aplicado (PCC o Pearson), sin hallarse grandes diferencias en sus magnitudes.
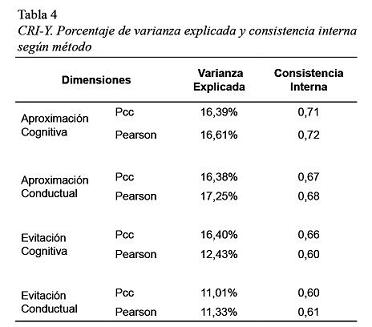
La Tabla 4 muestra diferencias en los porcentajes de varianza explicada por cada factor entre ambas modalidades (PCC y Pearson), así como también entre los índices de consistencia interna.
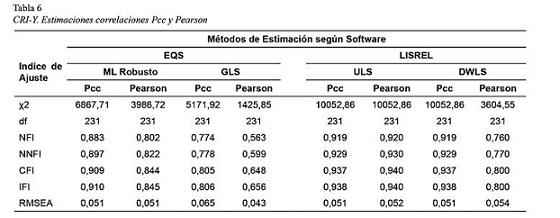
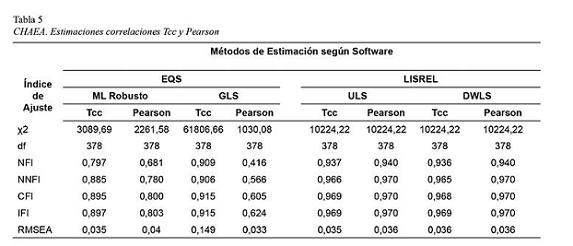
Análisis factorial confirmatorio correlaciones Pearson vs. Tetracóricas y Policóricas
Para evaluar la calidad del ajuste de los modelos se tomaron para todos los casos los índices χ2, NFI (Normed Fit Index), NNFI (Non Normed Fit Index), CFI (Comparative Fit Index), IFI (Incremental Fit Index) y RMSEA (Root Mean Square Error of Approximation) (Schumacker & Lomax, 2004).
Asimismo se practicaron distintos métodos de estimación a partir de los programas explicitados: ML Robusto y GLS mediante el EQS, y ULS y DWLS a través del LISREL.
La Tabla 5 detalla los índices obtenidos mediante correlaciones tetracóricas y mediante Pearson, mostrando diferencia entre los valores resultantes de la aplicación de todos los métodos de estimación.
Por otro lado la Tabla 6, que da cuenta de índices calculados a partir de correlaciones policóricas y Pearson, también presenta diferencias de igual clase.
Discusión
Hasta aquí se han expuesto de manera sucinta algunos aspectos relevantes sobre el cálculo de las correlaciones tetra y policóricas en estudios factoriales exploratorios (AFE y ACP) y de análisis factorial confirmatorio (AFC). Si bien el empleo de estos procedimientos para el tratamiento de variables categóricas resulta más complejo que el habitual (mediante correlaciones de Pearson), debido a las dificultades mencionadas en los párrafos anteriores su utilización se torna relevante ya que aparece como el más adecuado desde el punto de vista metodológico (Choi, Kim, Chen, & Dannels, 2011).
El examen aquí desarrollado pone en evidencia la existencia de diferencias entre los resultados obtenidos a partir de las distintas metodologías (tetracóricas, policóricas y Pearson). Para el caso de los estudios exploratorios se observó, en primer término, que las soluciones a las que se arribó fueron las mismas en todos los casos. Por otro lado en las correlaciones tetracóricas pudieron apreciarse diferencias en cuanto a las magnitudes de las estimaciones (cargas factoriales de los ítems, porcentaje de varianza explicada y el grado de consistencia interna para cada factor) que resultaron notablemente superiores a las obtenidas a través del procedimiento de Pearson. Respecto de las policóricas, salvo escasas excepciones, tales diferencias fueron levemente mayores en los índices obtenidos a partir de su aplicación.
En relación al análisis factorial confirmatorio aplicado a partir de correlaciones tetracóricas, no se hallaron grandes diferencias obteniéndose ajustes superiores respecto de la metodología de Pearson en el caso de las estimaciones alcanzadas mediante ML Robusto y GLS. No obstante para este último caso, si bien el valor de los índices de ajuste resultó notablemente mayor, la medida del índice RMSEA fue muy superior a los estándares admitidos ]]>
(< 0.08) (Lévy Mangin y González, 2006).
En cuanto al contraste entre correlaciones policóricas y Pearson, las diferencias más notables se observaron en las estimaciones efectuadas mediante ML Robusto, GLS y DWLS donde los valores obtenidos a través de la metodología policórica fueron superiores a los arrojados por Pearson. Sin embargo cabe aclarar que de los tres procedimientos mencionados solo la aplicación policórica de DWLS alcanzó valores de ajuste aceptables (> 0.90) (Kelloway, 1998).
Cabe destacar que por cuestiones vinculadas a la extensión del trabajo han sido dejados de lado otros aspectos igualmente importantes al momento de analizar diferencias entre los resultados de los modelos puestos a prueba por ambas metodologías en los análisis factoriales confirmatorios. En términos generales se omitieron todos los exámenes vinculados a los parámetros estimados y las covarianzas entre variables latentes que permitirían, en primera instancia determinar la presencia de ecuaciones infractoras; en segundo término valorar el nivel de significación de los parámetros con el fin de observar si todos ellos cumplían con los estándares establecidos (< 0.05); y en tercer lugar, inferir el porcentaje de varianza explicada por cada reactivo hacia el factor al que se encontraba asociado (Kline, 2005).
Las diferencias detalladas parecerían estar indicando, en términos generales, una mejora en las estimaciones obtenidas a partir de la ejecución de los análisis mediante matrices de correlación tetracórica y policórica. No obstante los datos derivados del presente estudio no permiten afirmar taxativamente la superioridad de dichas metodologías por sobre la de Pearson debido a que no se llevaron a cabo estudios de simulación que posibiliten la comparación de resultados. Habiéndose planteado ello como una de las limitaciones del estudio, queda para desarrollos ulteriores acometer tal objetivo, que excede los límites de este trabajo.
De todos modos, parece pertinente mencionar que otras investigaciones que sí han efectuado estudios comparativos entre las distintas metodologías, han encontrado evidencias favorables para las correlaciones TCC y PCC (Choi et. al., 2010; Holgado Tello et. al., 2010; Saris, Scherpenzeel & Wijk, 1998), en cuanto a mejor ajuste de los modelos, mayor robustez y mejores niveles de significación de las relaciones entre variables, así como también mejores estimaciones en análisis de fiabilidad (en el caso de las correlaciones TCC). Todo esto hace pensar, al menos inicialmente, que la aplicación de la metodología tetracórica y policórica permite arribar a resultados cuyas características se adaptan mejor a las propiedades poblacionales de los datos.
Recapitulando, esta revisión tuvo por finalidad divulgar algunos conocimientos referidos al uso de las correlaciones TCC y PCC para variables dicotómicas y politómicas entre los investigadores que deben emplear este tipo de análisis en su quehacer diario. El uso metodológicamente apropiado de esta clase de matrices facilitaría una lectura e interpretación de los resultados acorde al nivel de medición de las variables. Si bien la aplicación de estos procedimientos presentaría algunas dificultades, distintos investigadores se encuentran trabajando en la actualidad en aras de perfeccionar esta metodología, así como también los softwares que facilitan su ejecución. Se espera, de este modo, que en un futuro no muy lejano la mayoría de los estudios exploratorios y confirmatorios basen sus análisis en matrices de correlaciones TCC y PCC.
Más allá de la importancia de ajustar los análisis al tipo de datos que se maneje, vale recordar la actitud cautelosa que todo investigador debe asumir a la hora de examinar y discutir sus resultados. Si bien la naturaleza de las variables debe ser considerada, es requerido no olvidar contemplar los modelos teóricos a partir de los que se han construido los datos en análisis. Y al momento de decidirse por una solución factorial dada, jamás debe perderse de vista que, teóricamente hablando, un conjunto de datos dado admite infinitas estructuras latentes (Hair, Anderson, Tatham y Black, 1999). Así, es fundamental guardar el delicado y sensible equilibrio entre la parsimonia científica y la representatividad teórica, en conjunción con apropiados tratamientos de los datos, sin perderse de vista ninguna de estas aristas en detrimento de las demás. Ulteriores desarrollos continuarán ampliando el horizonte investigativo de cara a la mejora de la calidad de los análisis de los datos relevados, con el fin último de mejorar la calidad de los instrumentos que se elaboren y se adapten en la disciplina, así como de poner a prueba los modelos que a ellos subyacen.
Referencias
Alonso, C.M, Gallego, D.J. y Honey, P. (1994). Los estilos de aprendizaje. Procedimientos de diagnóstico y mejora. Bilbao:Mensajero.
American Psychological Association (2010). Publication manual of the American Psychological Association (6a. ed.) Washington, DC: Author.
Bentler, P.M. (2006). EQS 6 Structural equation program manual. Encino, CA: Multivariate Software, Inc.
Bollen, K.A. (1989). Structural Equations with Latent Variables. New York: Wiley
Boomsma, A. (1983). On the robustness of LISREL (máximum likelihood estimation) against small sample size and non-normality (Tesis Doctoral). Recuperado de http://dissertations.ub.rug.nl/faculties/gmw/1983/a.boomsma/
Boomsma, A. (2000). Reporting analyses of covariance structures. Structural Equation Modeling, 7(3), 461-483.
Brown, T. (2006). Confirmatory Factor Analysis for Applied Research. New York: Guildford Press.
Byrne, B. (2006). Structural Equation Modeling with EQS. New Jersey: Lawrence Erlbaum Associates, Inc., Publishers.
Chen, F., Bollen, K.A., Paxton, P., Curran, P.J., y Kirby, J.B. (2001). Improper solutions in structural equation models. Sociological Methods & Research, 29(4), 468-508.
Choi, J, Peters, M., & Mueller, R. (2010). Correlational analysis of ordinal data: from Pearson´s r to Bayesian polychoric correlation. Asia Pacific Educ.Rev., 11, 459-466. doi: 10.1007/s 12564-010-9096-y
Choi, J., Kim, S., Chen, J., & Dannels, S. (2011). A comparison of máximum likelihood and Bayesina estimation for polychoric correlation using Monte Carlo Simulation. Journal of Educational and Behavioral Statistics, 36(4), 523-549.
Christoffersson, A. (1975). Factor analysis of dichotomized variables. Psychometrika, 40(1), 5-32.
Cuttance, P. (2009). Issues and problems in the application of structural equation models. En P. Cuttance & R. Ecob (Eds.), Structural Modeling (pp. 241-280). New York: Cambridge University Press.
Elosua Oliden, P. y Zumbo, B.D. (2008). Coeficientes de fiabilidad para escalas de respuesta categórica ordenada. Psicothema, 20(4), 896-901.
Erceg Hurn, D.M., & Mirosevich, V.M. (2008). Modern robust statistical methods. American Psychologist, 63(7), 591-601.
Ferrando Piera, P.J. y Lorenzo Seva, U. (1993). Algunas relaciones entre el modelo de un factor común y el modelo logístico de dos parámetros. Psicothema, 5(2), 403-412.
Ferrando Piera, P.J., y Lorenzo Seva, U. (1994). Recuperación de la solución factorial a partir de variables dicotomizadas. Psicothema, 6(3), 483-491.
Flora, D., & Curran, P. (2004). An empirical evaluation of alternative methods of estimation for confirmatory factor analysis with ordinal data. Psychological Methods, 9(4), 466-491.
Forero, C.G., Maydeu Olivares, A., & Gallardo Pujol, D. (2009). Factor analysis with ordinal indicators: A Monte Carlo study comparing DWLS and ULS estimation. Structural Equation Modeling, 16, 625-641.
Freiberg Hoffmann, A. y Fernández Liporace, M.M. (2013). Cuestionario Honey-Alonso de Estilos de Aprendizaje: Análisis de sus propiedades psicométricas en estudiantes universitarios. Revista Summa Psicológica UST, 10(1), 103-117.
Gadermann, A.M., Guhn, M., & Zumbo, D. (2012). Estimating ordinal reliability for likert-tipe and ordinal item response data: a conceptual, empirical, and practical guide. Practical Assessment, Research & Evaluation, 17(3), 1-13.
Gerbing, D.W. & Anderson, J.C. (1987). Improper solutions in the analysis of covariance structures: their interpretability and a comparison of alternate respecifications. Psychometrika, 52(1), 99-111.
González Álvarez, N., Abad González, J. y Leví Mangin, J.P. (2006). Normalidad y otros supuestos en análisis de covarianzas. En J.P. Lévy Mangin y J. Varela (Eds.), Modelización con estructuras de covacianzas en ciencias sociales (pp. 31-59). Coruña: Netbiblo.
Hair, J.F., Anderson, R.E, Tatham, R.L. y Black, W.C. (1999). Análisis multivariante. Madrid: Prentice Hall.
Holgado Tello, F., Chacón Moscoso, S., Barbero García, I., & Vila Abad, E. (2010). Polychoric versus Pearson correlations in exploratory and confirmatory factor analysis of ordinal variables. Quality & Quantity, 44(1), 153-166.
Hoyle, R.H. (1995). Structural Equation Modeling. California: SAGE Publications, Inc.
IBM Corporation (2012a). IBM SPSS Statistics (21). Recuperado de http://www-01.ibm.com/software/es/analytics/spss/
IBM Corporation (2012b). IBM SPSS Amos (21). Recuperado de http://www-01.ibm.com/support/docview.wss?uid=swg27035758
Jöreskog, K.G. (2001). Analysis of ordinal variables 2. Cross-sectional data. Taller “Structural Equation Modelling with LISREL 8.51”. Friedrich-Schiller-Universitat, Jena.
Jöreskog, K.G., & Sörbom, D. (1999). LISREL 8: user´s reference guide. Lincolnwood, IL: Scientific Software International, Inc.
Juras, J., & Pasaric, Z. (2006). Aplication of tetrachoric and polychoric correlation coefficients to forecast verification. GEOFIZIKA, 23(1), 59-82.
Katsikatsou, M., Moustaki, I., Yang-Wallentin, F., & Jöreskog, K. (2012). Pair wise likelihood estimation for factor analysis models with ordinal data. Computational Statistics and Data Analysis, 56(12), 4243-4258.
Kelloway, E.K. (1998). Using LISREL for structural equation modeling. Thousand Oaks: Sage Publications.
Kline, P. (2000). Handbook of Psychological Testing (2a. ed.). New York: Routledge.
Kline, R. B. (2005). Structural equation modeling. New York: Guilford Press.
Kolenikov, S., Bollen, K.A., & Savalei, V. (2006). Specification test with Heywood cases. Recuperado de http://web.missouri.edu/~kolenikovs/ASA06procrefs.pdf
Lévy Mangin, J.P. y González, N. (2006). Modelización y Causalidad. En J.P. Lévy Mangin y J. Varela Mallou (Eds.), Modelización con estructuras de covacianzas en ciencias sociales (pp. 155-175). Coruña: Netbiblo.
Lévy Mangin,J.P., Martín Fuentes, M.T. y Román González, M.V. (2006). Optimización según estructuras de covarianzas. En J.P. Lévy Mangin y J. Varela (Eds.), Modelización con estructuras de covacianzas en ciencias sociales (pp. 11-30). Coruña: Netbiblo.
Lorenzo Seva, U., & Ferrando Piera, P.J. (2012). Manual of the Program FACTOR. Recuperado de http://psico.fcep.urv.es/utilitats/factor/
Manzano Patiño, A. y Zamora Muñoz, S. (2009). Sistema de ecuaciones estructurales: una herramienta de investigación. Cuaderno técnico 4. Recuperado de http://www.senasica.gob.mx/includes/asp/download.asp?iddocumento=23068& idurl=45367
Martínez Arias, R. (2005). Psicometría: teoría de los tests psicológicos y educativos. Madrid: Síntesis.
Maydeu Olivares, A, Forero, C.G., Gallardo Pujol, D., & Renom, J. (2009). Testing categorized bivariate normality with two-stage polychoric correlations estimates. Europeal Joournal of Research Methods for the Behavioral and Social Sciences, 5, 131-136.
Méndez Alonso, A. (2001). Estimación robusta: Una aplicación informática con fines didácticos. Estadística Española, 43(147), 105-123.
Moos, R.H. (1993). Coping Responses Inventory - Youth Form. Odessa: Psychological Assessment Resources.
Morales Vallejo, P. (2006). Medición de actitudes en Psicología y Educación. Madrid: Universidad Pontificia Comillas.
Multivariate Software (2012). EQS (6.2). Recuperado de http://www.mvsoft.com/eqsdownload.htm
Muthén, B. (1983). Latent variable structural equation modeling with categorical data. Journal of Econometrics, 22, 43-65.
Muthén, B. (1984). A general estructural equation model with dichotomous ordered categorical, and continuous latent variable indicators. Psychometrika, 49(1), 115-132.
Muthén, B. (1989). Dichotomous factor analysis of symptom data. En Eaton, y Bohrnstedt (Eds.), Latent Variable Models for Dichotomous Outcomes: Analysis of Data from the Epidemiological Catchment Area Program (pp. 19-65), Sociological Methods & Research, 18, 19-65.
Muthén, B., & Hofacker, C. (1988).Testing the assumptions underlying tetrachoric correlations. Psychometrika, 53(4), 563-578.
Muthén, B., & Kaplan, D. (1985). A comparison of some methodologies for the factor analysis of non-normal Likert variables. British Journal of Mathematical and Statistical Psychology, 38, 171-189.
Muthén, L., & Muthén, B. (2012). MPLUS (7). Recuperado de http://www.statmodel.com/index.shtml
Nunnally, J.C., y Bernstein, I.H. (1994). Psychometric Theory (3a ed.). New York: McGraw-Hill.
Ogasawara, H. (2011). Asymptotic expansions of the distributions of the polyserial correlations coefficients. Behaviormetrika, 38(2), 153-168.
Olsson, U.H., Foss, T., Troye, S.V., & Howell, R.D. (2000). The performance of ML, GLS and WLS estimation in structural equation modeling under conditions of misspecification and nonnormality. Structural Equation Modeling, 7(4), 557-595.
Ortiz León, M.C. (1988). Inferencia estadística robusta. Revista la Ciencia y el Hombre, 2, 95-106.
Pfanzagl, J. (1968). Theory of measurement. New York: John Wiley.
Rial Boubeta, A., de la Iglesia, G., Ongarato, P. y Fernández Liporace, M. (2011). Dimensionalidad del Inventario de Afrontamiento para adolescentes y universitarios. Psicothema, 23(3), 464-474.
Rial Boubeta, A., Varela Mallou, J., Abalo Piñeiro, J. y Lévy Mangin, J.P. (2006). El análisis factorial confirmatorio. En: J.P. Lévy Mangin y J. Varela (Eds.), Modelización con estructuras de covarianzas en ciencias sociales (pp. 119-143). Coruña: Netbiblo.
Richaud, M.C. (2005). Desarrollos del análisis factorial para el estudio de ítem dicotómicos y ordinales. Revista Interdisciplinaria, 22(2), 237-251.
Saris, W.E., Scherpenzeel, A.C., & Wijk, T. (1998). Validity and reliability of subjective social indicators: the effect of different measures of association. Social Indicators Research, 45, 173-199.
Schermelleh-Engel, K., Moosbrugger, H., & Müller, H. (2003). Evaluating the fit of structural equation models: Test of significance and descriptive goodness-of-fit measures. Methods of Psychological Research Online, 8(2), 23-74.
Schumacker, R.E., & Lomax, R.G. (2004). A beginner´s guide to estructural equation modeling (2a ed.). New Jersey, London: Lawrence Erlbaum Associates.
Scientific Software International (2006). LISREL (8). Recuperado de http://www.ssicentral.com/lisrel/resources.html
Stevens, S.S. (1951). Mathematics, measurement and psychophysics. En S.S. Stevens (Ed.), Handbook of Experimental Psychology (pp. 1-30). New York: Wiley.
SYSTAT Software (2010). SYSTAT (13.1). Recuperado de http://www.systat.com/SystatProducts.aspx
Torgerson, W.S. (1958). Theory and methods of scaling. New York: John Wiley.
West, S.G., Finch, J.F., & Curran, P.J. (1995).Structural equation models with nonnormal variables: problems and remedies. En: R.H. Hoyle (Ed.), Structural Equation Modeling (pp. 56-76). California: SAGE Publications, Inc.
Yela, M. (1966). Los tests y el análisis factorial. En B. Szekeli (Ed.), Los Tests (pp. 153-178). Buenos Aires: Kapelusz.
Yung, Y.F., & Bentler, P.M. (1994). Bootstrap-corrected ADF test statistics in covariance structure analysis. British Journal of Mathematical and Statistical Psychology, 47, 63-84.
Para citar este artículo:
Freiberg Hoffmann, A., Stover, J. B., de la Iglesia, G. y Fernández Liporace, M. (2013). Correlaciones policóricas y tetracóricas en estudios factoriales exploratorios y confirmatorios. Ciencias Psicológicas VII (2): 151 - 164. [/back] [/article]