


 English (pdf)
 Article in xml format
 Article references

 Permalink
1. Introduction
Propolis, as a product of honey bees, is under study around the world, evidenced by an increasing number of published review papers on the progress made 1)(2)3)(4)5)(6) 7. These reviews delve into botanical origins, chemical compositions, and medicinal properties. However, the medicinal use of propolis is limited by the heterogeneity of its composition8. Thus, different studies attempt to determine the chemical composition of propolis by studying polyphenols and minerals with reference to vegetation and geographical area9. Regarding minerals, until the early 21st century, there were few studies on them 10)(11)12)(13) . Minerals are not extracted from crude propolis by the most commonly used alcoholic solvents and have different solubilities in water14. This fact has led some studies to determine the relationship between the minerals present in propolis tinctures and crude propolis15. Research on polyphenols is more abundant, as they are attributed with medicinal properties. For instance, there are studies on the correlation of ferulic acid in inhibiting hyaluronidase, or p-coumaric acid in the case of angiotensin-converting enzyme (ACE)16, or galangin and pinocembrin in the improvement of insulin resistance17, or rutin, myricetin, quercetin and caffeic acid phenethyl ester (CAPE) in inhibiting receptors of the covid virus 18)(19) . Specific studies on Uruguay's propolis do not specify the production location or time of year, or they are not recent 20)(21)22)(23) . Other studies compare Uruguayan propolis with others of different origins, but they aim to characterize Uruguayan propolis and do not provide information on locality or time of year 8)(24) 25. In a recent study on a collection of Uruguayan propolis, differences were found in the total polyphenol content, measured in grams gallic acid equivalent (GAE), and total flavonoids, measured in grams quercetin equivalent (QE). The values found show the importance of determining the polyphenol profile of propolis, even in those with lower contents26. Associated with this propolis collection, vegetation quantification was performed within a 2 km radius using satellite imager27 yand the QGis 3.16 software28. This quantification showed a certain ability to group propolis according to the plant environment. The objectives of this study were to evaluate a method for characterizing vegetation cover and its relationship with propolis production; to determine polyphenols and minerals present in this collection; to evaluate differences between localities and seasons, and to compare them with other propolis in the world to explore their potential uses.
2. Material and methods
2.1 Propolis
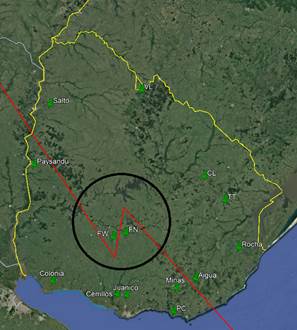
The study focused on a collection of propolis collected throughout Uruguay during the 2020-2021 season. The location of the apiaries is depicted in Figure 1. There are 14 locations with harvests in different seasons, totaling 22 propolis samples, each with 5 repetitions, as detailed in Table 1. An attempt was made to cover the diversity of soil units and environments present in the country. Thus, apiaries were located on basalt, sandstones, quaternary sediments, crystalline basement, hill ranges and coastal soils. Propolis was manually collected from beehive frames after 5 minutes of freezing at -20 °C, removing residues from wax and bees, and then preserved at room temperature26.
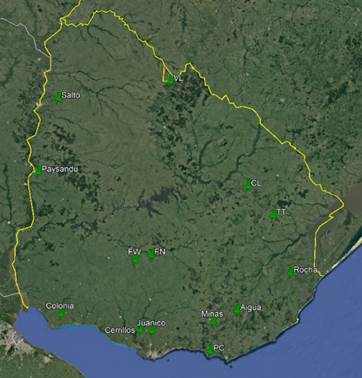
Table 1: Propolis obtained by locality and season
| Place | Spring 2020 (Nº of samples) | Summer 2021 (Nº of samples) | Autumn 2021 (Nº of samples) |
| A | 5 | ||
| Ce | 5 | 5 | 5 |
| CL | 5 | ||
| C | 5 | 5 | |
| FN | 5 | ||
| FW | 5 | 5 | |
| J | 5 | 5 | 5 |
| M | 5 | ||
| P | 5 | 5 | |
| PC | 5 | ||
| R | 5 | 5 | |
| S | 5 | ||
| TT | 5 | ||
| VL | 5 |
A Aiguá, Ce Cerrillos, CL Cerro Largo, C Colonia, FN Florida North, FW Florida West, J Juanicó, M Minas, P Paysandú, PC Punta Colorada, R Rocha, TT Treinta y Tres, VL Valle Lunarejo
2.2 Characterization of the plant environment in each locality
Using information from the Ministry of Livestock, Agriculture and Fisheries29, a radius of 2 km was established around each apiary and the surface area of each of the land use categories was measured. The locality of Punta Colorada was initially assigned 100% to the Livestock category with over 10% artificial pasture. However, Figure 2 illustrates the actual situation of this apiary. To correct this, the sea and coastal area were excluded from the total. The new 100% is distributed between 54% livestock with over 10% artificial pasture and 46% corresponding to the urban environment, which is added to Table 2. The results were expressed as a percentage of the total area, 1258 ha. The different categories and percentages are detailed in Table 2.
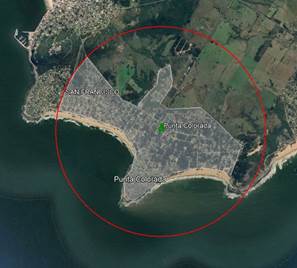
Table 2: Land use by locality as a percentage
| Place | A | A/Dp | A/L | Cp | Dp/L | F | FGp | L+10 | L-10 | Rp/L | U |
| A | 0 | 0 | 0 | 0 | 0 | 56.4 | 0 | 0 | 43.6 | 0 | 0 |
| Ce | 0 | 47.3 | 0 | 0 | 52.7 | 0 | 0 | 0 | 0 | 0 | 0 |
| CL | 0 | 0 | 0 | 0 | 0 | 6.7 | 0 | 0 | 93.3 | 0 | 0 |
| C | 0 | 100 | 0 | 0 | 0 | 0 | 0 | 0 | 0 | 0 | 0 |
| FN | 0 | 0 | 0 | 0 | 100 | 0 | 0 | 0 | 0 | 0 | 0 |
| FW | 0 | 0 | 100 | 0 | 0 | 0 | 0 | 0 | 0 | 0 | 0 |
| J | 0 | 0 | 0 | 0 | 0 | 0 | 100 | 0 | 0 | 0 | 0 |
| M | 0 | 0 | 0 | 0 | 0 | 0 | 0 | 100 | 100 | 0 | 0 |
| P | 100 | 0 | 0 | 0 | 0 | 0 | 0 | 0 | 0 | 0 | 0 |
| PC | 0 | 0 | 0 | 0 | 0 | 0 | 0 | 54 | 0 | 0 | 46 |
| R | 0 | 0 | 0 | 0 | 0 | 0 | 0 | 0 | 0 | 100 | 0 |
| S | 18 | 0 | 27.5 | 54.5 | 0 | 0 | 0 | 0 | 0 | 0 | 0 |
| TT | 0 | 0 | 0 | 0 | 0 | 0 | 0 | 0 | 100 | 0 | 0 |
| VL | 0 | 0 | 0 | 0 | 0 | 0 | 0 | 0 | 100 | 0 | 0 |
A Aigüa, Ce Cerrillos, CL Cerro Largo, Co Colonia, FN Florida North, FW Florida West, J Juanicó, M Minas, PPaysandú, PC Punta Colorada, R Rocha, TT Treinta y Tres, VL Valle Lunarejo, A Agriculture,A/Dp Agriculture and Dairy production, A/L Agriculture and Livestock, Cp Citrus production, Dp/L Dairy Production and Livestock, F forest, FGp Fruits and Grapes production, L+10 Livestock with more than 10% artificial grasses, L-10 Livestock with less 10% artificial grasses, Rp/L Rice production and Livestock, U urban category added
Table 3: Concentration of hydroxycinnamic acids in g/kg. Mean value ± standard deviation in the obtained propolis
| Place | caffeic ac | p-coumaric ac | ferulic ac | CAPE |
| A | 0.03 ± 0.02 efg | 0.33 ± 0.06 efg | 0.23 ± 0.06 def | 0.07 ± 0.04 efg |
| Cea | 0.08 ± 0.03 cdefg | 0.87 ± 0.25 cdefg | 0.32 ± 0.07 cdef | 3.15 ± 1.23 cdefg |
| Cep | 0.14 ± 0.02 abcd | 1.58 ± 0.51 bcd | 0.91 ± 0.3 ab | 3.87 ± 1.19 bcd |
| Ces | 0.12 ± 0.06abcde | 1.11 ±0.38 cdef | 0.65 ± 0.38 bcd | 3.10 ± 0.57 cdef |
| CL | 1.0 ± 1.0 g | 0.01 ± 0.01 g | 0.02 ± 0.01 f | 0.01 ± 0.01g |
| Cop | 0.16 ± 0.05 abcd | 1.58 ± 0.34 bc | 1.29 ± 0.37 a | 2.88 ± 0.84 bc |
| Cos | 0.11 ± 0.05 abcdefg | 0.95 ± 0.38 cdefg | 0.78 ± 0.34 abc | 2.21 ± 0.94 cdefg |
| FN | 0.10 ± 0.05 bcdefg | 1.14 ± 0.59 cde | 0.02 ± 0.01 f | 1.27 ± 0.8 cde |
| FWp | 0.05 ± 0.04 defg | 0.62 ± 0.5 defg | 0.01 ± 0.01 f | 0.75 ± 0.64 defg |
| FWs | 0.02 ± 0.02 efg | 0.21 ± 0.15 efg | 0.13 ± 0.13 ef | 0.38 ± 0.34 efg |
| Ja | 0.21 ± 0.11 a | 1.50 ± 0.92 bcd | 0.80 ± 0.61 abc | 5.36 ± 3.57 bcd |
| Jp | 0.21 ± 0.02 ab | 3.41 ± 0.66 a | 0.06 ± 0.02 f | 4.08 ± 0.79 a |
| Js | 0.21 ± 0.06 a | 2.23 ±0.3 b | 0.52 ± 0.15 bcdef | 6.11 ± 1.28 b |
| M | 0.12 ± 0.03 abcdef | 1.12 ± 0.29 cde | 0.75 ± 0.26 bcd | 1.85 ± 0.52 cde |
| Pp | 0.10 ± 0.04 bcdefg | 2.10 ± 0.37 b | 0.07 ± 0.01 f | 1.26 ± 0.46 b |
| Ps | 0.20 ± 0.06 ab | 1.78 ± 0.43 bc | 0.64± 0.05 bcde | 3.40 ± 0.97 bc |
| PC | 0.18 ± 0.09 abc | 0.89 ± 0.67 cdefg | 0.03 ± 0.29 f | 3.71 ± 1.82 cdefg |
| Rp | 0.02 ± 0.01 efg | 0.07 ± 0.07 g | 0.03 ± 0.02 f | 0.25 ±0.34 g |
| Rs | 8.0 ± 7.0 g | 0.03 ± 0.04 g | 0.04 ± 0.05 f | 0.10 ± 0.12 g |
| S | 0.06 ± 0.04 defg | 0.27 ± 0.2 efg | 0.12 ± 0.13 f | 0.84 ± 1.08 efg |
| TT | 0.01 ± 0.01 fg | 0.06 ± 0.06 g | 4.8 ± 10.0 f | 0.01 ± 0.02 g |
| VL | 6.0 ± 8.0 g | 0.16 ± 0.11 fg | 0.05 ± 0.04 f | 0.07 ± 0.14 fg |
CAPE: Caffeic acid phenethyl ester. Different letters in the columns mean statistical differences (p ≥ 0.05 Tukey-Kramer). A Aigüa, Ce Cerrillos, CL Cerro Largo, Co Colonia, FN Florida North, FW Florida West, J Juanicó, M Minas, P Paysandú, PC Punta Colorada, R Rocha, S Salto, TT Treinta y Tres, VL Valle Lunarejo, a autumn, p spring, s summer. In bold, values expressed in mg/kg
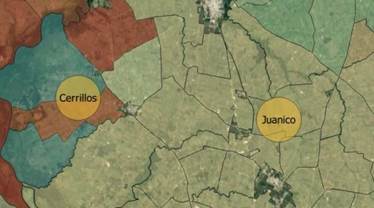
Figure 3 shows an example of the three layers of information (satellite image with apiary location, 2 km flight radius, and land use areas).
2.3 Polyphenol content
From each propolis sample, 2 g were taken and diluted in 20 ml of 80% ethanol. It was then stirred in darkness for 4 h at 30 °C, using a thermoagitator (Gyrotory® New Brunswick Scientific Co. Edison, N, J, USA). It was filtered using ashless paper filters MN 640 d N°42 (Macherey Nagel), and stored in a refrigerator (4 °C).
The following standards were used for the determination of polyphenols: apigenin (4',5,7-trihydroxyflavone), umbelliferone (≥ 98%, Sigma-Aldrich, USA), caffeic acid (≥ 98%, Sigma-Aldrich, USA), p-coumaric acid (≥ 98%, Sigma-Aldrich, USA), CAPE (≥ 97%, Merck Millipore Corp., USA), trans-ferulic acid (99%, Sigma-Aldrich, USA), boldine (natural from Peumus boldus molina, ≥ 98%, Supelco, USA), chrysin (≥ 96.5%, Sigma-Aldrich, USA), galangin (≥ 95% Sigma-Aldrich, USA), kaempferol (≥ 97%, Sigma-Aldrich, USA), morin (phyproof ® Reference Substance, ≥ 95%, Phytolab, Germany), pinocembrin (≥ 95%, Sigma-Aldrich, USA), rutin hydrate (≥ 94%, Sigma-Aldrich, USA), quercetin (≥ 98%, Sigma-Aldrich, USA) and vanillin (Reagent Plus®, 99%, Sigma-Aldrich, USA).
Propolis extracts were analyzed using high-performance liquid chromatography. The equipment used was an HPLC Prominence LC-20A (Shimadzu Corporation, Japan) equipped with autosampler, quaternary pump and diode array detector (SPD-M20A). The separation of each hydroalcoholic extract of propolis was carried out in a Luna C18 column (250 × 4.6 mm, 5 μm, Phenomenex, USA), thermostatized at 35 ºC. The total running time was 60 minutes according to the elution gradient, which consisted of two mobile phases: 1) Water with 0.1% trifluoroacetic (TFA) (Mobile Phase A), and 2) Acetonitrile with 0.1% TFA (Mobile Phase B). The following mobile phase gradients were used at a flow rate of 0.7 mL/min: 0 min 35% B, 10-15 min 50% B, 40 min 80% B, 50-60 min 35% of B. The injection volume was 10 μL. It was quantified according to the external standard method, generating calibration curves for each of the standards. MilliQ-quality water, HPLC-quality acetonitrile (Merck, Germany) and HPLC-quality TFA (≥ 99%, Fisher Chemical, USA) were used. The limit of detection (LD) was 0.04 mg/kg and the limit of quantification (LQ) was 0.12 mg/kg. Results are expressed as grams of polyphenols per kilogram of propolis.
2.4 Minerals
Propolis samples (2 g) were placed in porcelain crucibles with muffle lids with a temperature ramp and a maximum of 580 ºC until white ash was obtained30. The obtained ashes were dissolved in acid solution, according to Tosic and others12, with modifications. Ultrapure HNO3 (1M, 65% Merck, sub-boiling distillate) and HCl (6M, Merck, ACS) were used in an Erlenmeyer flask with a steam trap device, on a hot plate (Thermolyne) until complete dissolution. The solution was then filtered using ashless paper filters MN 640 d N°42 (Macherey Nagel) and brought to a volume of 25 ml with MilliQ ultrapure water in a volumetric flask31. The content of microelements: Copper (Cu), Iron (Fe), Manganese (Mn) and Zinc (Zn) in propolis was quantified with an Atomic Absorption Spectrometer (Perkin Elmer, AAnalyst 300, USA) equipped with a deuterium lamp as background corrector, with flame (air-acetylene; 8.0 l/min and 1.4 l/min) for Fe, Zn, Cu, Mn. A standard curve was prepared for each analyte from single-element solutions of Cu, Fe, Mn and Zn, containing 1000 mg/l (Perkin Elmer or Fluka). Samples and standards were diluted with deionized H20 and contained 0.5% ultrapure HNO3. The content of macroelements calcium (Ca), magnesium (Mg), sodium (Na) and potassium (K) was quantified in the same ash solution described above. A Lumina multielement lamp (Perkin Elmer, USA) was used for Ca (422.7 wavelengths) and Mg (285.2 wavelengths), while Na and K were measured with emission (589 and 404.4 wavelengths, respectively). A standard curve was prepared for each analyte from solutions of Ca, Mg, Na and K of 1000 mg/l (CertipurR, Merck, Germany). A blank (acids only) was run with the samples. Data were expressed in milligrams of each mineral per kilogram of propolis (mg/kg). The limit of quantification (LQ) was calculated as the concentration resulting from 10 times the blank deviation, and the limit of detection (LD) was calculated as the concentration resulting from 3.3 times the blank deviation. The LQ values for Ca, K, Mg, and Na were 5.43, 0.06, 0.75, and 0.11 mg/l, respectively, and the LD values were 1.79, 0.02, 0.25, and 0.04 ml/l, respectively. For Cu, Fe, Mn and Zn the LQ was 0.01, 0.03, 0.03 and 0.01 mg/l, respectively, and the LD was 0.004, 0.01, 0.01 and 0.003 mg/l, respectively. The materials used in the preparation of samples and solutions were conditioned with a combination of the four factors of the Sinner circle: mechanical action (non-metallic brushes), and chemical, with times and temperatures according to the material. Soaking was used for 24 or 48 hours in deionized H20 with 10% or 25% concentrated HNO3, and finally rinsed several times with deionized H20, following the main procedures of Ballinger & Shugar32 and EPA33. The materials were air-dried upside down on a clean basket without a towel or stove to prevent contamination. The materials were periodically renewed to reduce contamination.
2.5 Statistical analysis
To compare propolis, an analysis of variance was performed and the Tukey-Kramer test was applied. Propolis samples were compared for their similarity in both polyphenol and mineral content using multivariate analysis techniques. The localities were also compared in terms of their vegetation according to the land use categories. Dendrograms were constructed by standardizing the data using Ward's method and employing Euclidean distance. Correlations between polyphenols and between minerals were calculated. Polyphenols correlated with Pearson's p-values ≥ 0.7 were used to perform a network analysis using Louvain's algorithm34. Rstudio35 and Infostat36 were used.
3. Results
3.1 Plant environment
Ten out of the 16 categories provided by the MGAP information were detected29. The percentage values of each of them were used to create the dendrogram in Figure 4. In terms of percentages, the most similar localities are Minas, Treinta y Tres and Valle Lunarejo (100%). Cerro Largo closely resembles this group with 93%. Another similarity is observed between Cerrillos and Florida North (77%), and they are 60% similar to Colonia. The locality of Punta Colorada stands alone due to the percentage of the Urban category in land use.
3.2 Polyphenols
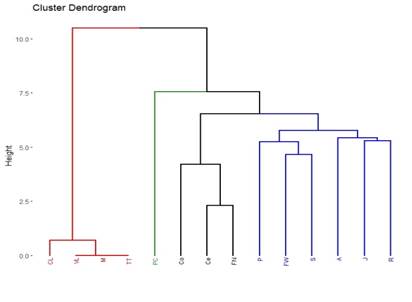
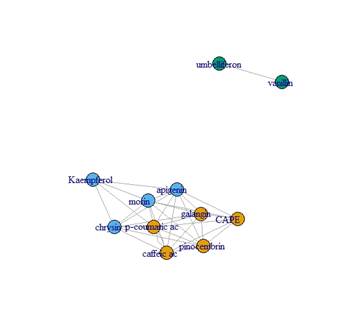
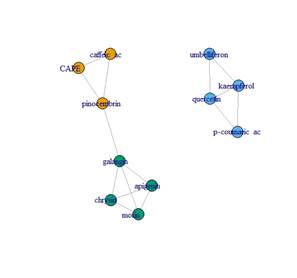
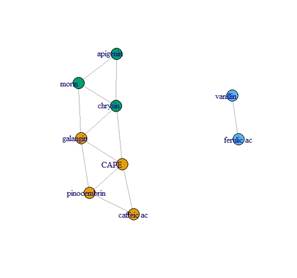
The detected and quantified polyphenols are presented in Table 3, 4, 5 and 6. Except for rutin, all others were detected and quantified in some of the 110 propolis samples. Boldine contents are 1000 times lower than other polyphenols, which is why they are expressed in mg/kg. Umbelliferone only appears in propolis from Paysandú and Cerro Largo and in some samples from Treinta y Tres and Valle Lunarejo. Other polyphenols that were not found in some of the 110 propolis include caffeic acid, ferulic acid, CAPE, morin, quercetin and vanillin. The locality with the lowest diversity was Rocha in spring, where boldine, morin, quercetin, umbelliferone or vanillin were not detected. Cerro Largo was the locality with the lowest total amount, while Juanicó presented the highest amounts, in all seasons and especially in summer. The similarity in propolis based on polyphenol content and profile is shown in Figure 5. Except for the propolis from both seasons of Paysandú (Pp and Ps) which appear in different groups, the other localities with more than one harvest (Cerrillos, Juanicó, Florida West and Rocha) present similar propolis in all harvests. In terms of percentage, propolis from Colonia were similar in 88%, those from Juanicó in 84%, Rocha 83% and Cerrillos 78%, while samples from Paysandú were only 65% similar. Graphs present the average polyphenol content of the southwest (Figure 6) and northeast (Figure 7) localities. Ten times less content is observed in the northeast, but the main polyphenols (chrysin, galangin and pinocembrin) are the same, although they decrease proportionally, while quercetin increases compared to the main polyphenols. Based on the three resulting groups (Figure 5), the correlation between the quantified polyphenols within each group was calculated. Only those values of Pearson's coefficient equal to or over 0.7 were used and are presented in Table 7, 8 and 9. Networks in Figure 8, 9 and 10 were constructed with the values obtained for each group.
Table 4: Concentration of flavonols in g/kg. Mean value ± standard deviation in the propolis obtained
| Place | Galangin | Kaempferol | Morin | Quercetin |
| A | 4.3 ± 2.3 fgh | 0.11 ± 0.05 h | 0.03 ± 0.02 g | 5.85 ± 0.08 bc |
| Cea | 27.7 ± 9.3 bcd | 1.67 ± 0.58 bcde | 0.44 ± 0.15 b | 6.32 ± 0.18 abc |
| Cep | 27.2 ± 6.5 bcd | 1.31 ± 0.45 bcdefg | 0.38 ± 0.13 bc | 6.52 ± 0.17 ab |
| Ces | 28.0 ± 6.1 bcd | 1.29 ± 0.28 bcdefg | 0.34 ± 0.09 bcde | 5.75 ±1.24 c |
| CL | 0.2 ± 0.1 h | 10.0 ± 10.0 h | 0.84 ± 1.5 g | ND |
| Cop | 25.0 ± 4.9 bcd | 0.87 ± 0.26 cdefgh | 0.24 ± 0.02 cdef | 6.26 ± 0.14 abc |
| Cos | 18.4 ± 7.8 cde | 0.68 ± 0.33 defgh | 0.18 ± 0.08 defg | 6.16 ± 0.16 abc |
| FN | 15.8 ± 6.9 defg | 1.84 ± 0.73bcd | 0.18 ± 0.07 defg | 6.18 ± 0.21 abc |
| FWp | 8.7 ± 8.6 efgh | 1.16 ± 1.38 bcdefgh | 0.11 ± 0.13 fg | 6.1 ± 0.27 abc |
| FWs | 3.3 ± 2.2 gh | 0.12 ± 0.07 h | 0.04 ± 0.02 fg | 0.06 ± 0.04 f |
| Ja | 30.1 ± 9.6 bc | 1.41 ± 0.5 bcdef | 0.53 ± 0.17 b | 0.75 ± 0.35 ef |
| Jp | 32.7 ± 3.5 b | 3.51 ± 0.42 a | 0.53 ± 0.06 b | 6. 7 ± 0.12 a |
| Js | 49.2 ± 7.7 a | 2.07 ± 0.28 b | 0.99 ± 0.16a | 1.10 ± 0.20 e |
| M | 17.4 ± 4.8 cdef | 0.62 ± 0.18 efgh | 0.18 ± 0.05 defg | 0.34 ± 0.1 f |
| Pp | 18.0 ± 3.9 cdef | 2.12 ± 0.57 b | 0.35 ± 0.09 bcd | 6.31 ±0.17 abc |
| Ps | 32.5 ± 5.3 b | 1.41 ± 0.32 bcdef | 0.43 ± 0.06 bc | 0.73 ±0.23 ef |
| PC | 18.2 ± 9.1 cde | 1.88 ± 1.0 bc | 0.15 ± 0.07 efg | 3.35 ±0.26 d |
| Rp | 2.8 ± 2.1 gh | 0.27 ± 0.15 fgh | ND | 5.8 ± 0.1 bc |
| Rs | 1.1 ± 1.2 h | 0.05 ± 0.05 h | 0.01 ± 0.01 g | 0.03 ± 0.03 f |
| S | 8.2 ± 7.3 efgh | 0.29 ± 0.25 fgh | 0.11 ± 0.09 fg | 0.15 ± 0.15 f |
| TT | 1.7 ± 1.9 h | 0.24 ± 0.3 gh | 0.02 ± 0.03 g | 2.91 ± 0.03 d |
| VL | 0.34 ± 0.24 h | 0.05 ± 0.04 h | 0.01 ± 0.01 g | ND |
1Values expressed in mg/kg. Different letters in the columns mean statistical differences (p ≥ 0.05 Tukey-Kramer). ND: Not detected. A Aigüa, Ce Cerrillos, CL Cerro Largo, Co Colonia, FN Florida North, FW Florida West, J Juanicó, M Minas, P Paysandú, PC Punta Colorada, R Rocha, S Salto, TT Treinta y Tres, VL Valle Lunarejo, a autumn, p spring, s summer. In bold, values expressed in mg/kg
Table 5: Concentration in g/kg of boldine, umbelliferone and vanillin. Mean value ± standard deviation in the propolis obtained
| Place | Boldine | Umbelliferone | Vanillin |
| A | ND | 0.07 ± 0.02 bcd | 0.23 ± 0.08 cdef |
| Cea | ND | 0.03 ± 0.01 cd | 0.26 ± 0.21 bcdef |
| Cep | ND | 0.06 ± 0.03 bcd | 0.7 ± 0.33 ab |
| Ces | ND | 0.07 ± 0.03 bcd | 0.56 ± 0.32 abcd |
| CL | 0.42 ± 0.13 b | 0.12 ± 0.1 ab | 0.53 ± 0.48 abcde |
| Cop | ND | 0.15 ± 0.05 a | 0.82 ± 0.28 a |
| Cos | ND | 0.06 ± 0.02 bcd | 0.52 ± 0.14 abcde |
| FN | ND | 0.09 ± 0.03 abc | 0.18 ± 0.11 def |
| FWp | ND | 0.02 ± 0.04 cd | 0.18 ± 0.21 def |
| FWs | ND | ND | 0.03 ± 0.02 f |
| Ja | ND | 0.03 ± 0.03 cd | 0.10 ± 0.05 ef |
| Jp | ND | 0.08 ± 0.04 | 0.32 ± 0.04 bcdef |
| Js | ND | 0.03 ± 0.05 cd | 0.26 ± 0.11 bcdef |
| M | ND | ND | 0.66 ± 0.18 abc |
| Pp | 0.45 ± 0.09 b | ND | 0.20 ± 0.14 def |
| Ps | 2.3 ± 0.4 a | ND | 0.25 ± 0.13 bcdef |
| PC | ND | 0.07 ± 0.03 bcd | 0.35 ± 0.28 bcdef |
| Rp | ND | ND | ND |
| Rs | ND | ND | 0.01 ± 0.01 f |
| S | ND | 0.01± 0.01 d | 0.02 ± 0.02 f |
| TT | 0.22 ± 0.48 b | 0.03 ± 0.06 cd | 0.04 ± 0.07 f |
| VL | 0.19 ± 0.28 b | ND | 0.05 ± 0.08 f |
Different letters in the columns mean statistical differences (p ≥ 0.05 Tukey-Kramer). ND: Not detected. A Aigüa, Ce Cerrillos, CL Cerro Largo, Co Colonia, FN Florida North, FW Florida West, J Juanicó, M Minas, P Paysandú, PC Punta Colorada, R Rocha, S Salto, TT Treinta y Tres, VL Valle Lunarejo, a autumn, p spring, s summer. In bold, values expressed in mg/kg
Table 6: Concentration in g/kg of flavones (apigenin and chrysin) and flavanone (pinocembrin). Mean value ± standard deviation in the propolis obtained
| Place | Apigenin | Chrysin | Pinocembrin |
| A | 0.2 ± 0.2 hi | 4.4 ± 2.4 jk | 11.8 ± 5.8 defg |
| Cea | 3.4 ± 1.2 bcd | 47.6 ± 13.5 bcd | 28.2 ± 9.2 bcdefg |
| Cep | 3.1 ± 1.2 bcde | 38 ± 10.2 bcde | 49.2 ± 15.2 ab |
| Ces | 2.2 ± 0.6 cdefg | 42.5 ± 7 bcde | 44.7 ± 18.7 abc |
| CL | 20.0 ± 10.0 i | 0.4 ± 0.1 k | 0.4 ± 0.2 g |
| Cop | 1.8 ± 0.38 defgh | 30.4 ± 5.8 cdefgh | 58.2 ± 15.5 a |
| Cos | 1.1 ±0.6 fghi | 27.2 ± 12.8 defghi | 35.1 ± 14.2 abcde |
| FN | 1.3 ± 0.8 fghi | 19.6 ± 7.7 fghijk | 34.9 ± 17.8 abcde |
| FWp | 1.2 ± 1.8 fghi | 12.4 ± 13.7 hijk | 19.2 ± 16.8 cdefg |
| FWs | 0.3 ± 0.2 hi | 6.4 ± 4.5 ijk | 6.2 ± 3.5 efg |
| Ja | 4.0 ± 1.0 b | 51.5 ± 11.8 bc | 45.3 ± 19.8abc |
| Jp | 3.6 ± 0.9 bc | 49.2 ± 13.4 bc | 57.7 ± 8.7 a |
| Js | 5.8 ± 0.9 a | 74.4 ± 10.6a | 59.8 ± 11.7 a |
| M | 1.0 ± 0.2 fghi | 23.9 ± 5.7 efghij | 37.0 ± 10.4 abcd |
| Pp | 2.4 ± 0.6 bcdefg | 35.5 ± 17.3 bcdefg | 32.3 ± 7.7 abcdef |
| Ps | 2.7 ± 0.4 bcdef | 34 ± 5.6 ab | 45.5 ± 10.9 abc |
| PC | 1.5 ± 0.8 efghi | 53.8 ± 7.0 bcdefg | 43.1 ± 25.5 abc |
| Rp | 0.3 ± 0.2 hi | 5.5 ± 4.5 jk | 3.9 ± 3.2 fg |
| Rs | 70.0 ± 70.0 hi | 1.7 ± 1.4 k | 2.1 ± 2.3 g |
| S | 0.9 ± 0.8 ghi | 15.1 ± 12.9 ghijk | 11.1 ± 9.9 defg |
| TT | 0.4 ± 0.4 hi | 3.7 ± 4.4 jk | 2.4 ± 2.9 g |
| VL | 30.0 ± 20.0 i | 0.9 ± 0.8 k | 1.0 ± 0.7 g |
Different letters in the columns mean statistical differences (p ≥0.05 Tukey-Kramer). ND: Not detected. A Aigüa, Ce Cerrillos, CL Cerro Largo, Co Colonia, FN Florida North, FW Florida West, J Juanicó, M Minas, P Paysandú, PC Punta Colorada, R Rocha, S Salto, TT Treinta y Tres, VL Valle Lunarejo, a autumn, p spring, s summer. In bold, values expressed in mg/kg
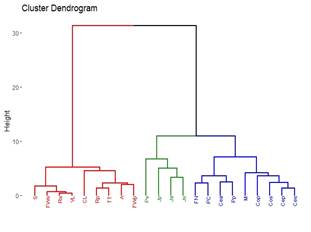
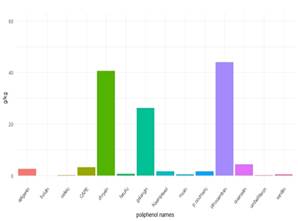
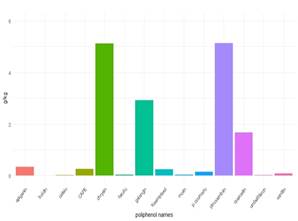
Table 7: Correlation between polyphenols and Pearson's coefficient values of group 1 (northeast)
| polyphenol(1) | polyphenol(2) | Pearson |
| caffeic ac | p-coumaric ac | 0.81 |
| caffeic ac | apigenin | 0.76 |
| caffeic ac | chrysin | 0.88 |
| caffeic ac | galangin | 0.9 |
| caffeic ac | morin | 0.84 |
| caffeic ac | pinocembrin | 0.85 |
| caffeic ac | CAPE | 0.87 |
| p-coumaric ac | apigenin | 0.78 |
| p-coumaric ac | chrysin | 0.76 |
| p-coumaric ac | galangin | 0.85 |
| p-coumaric ac | morin | 0.81 |
| p-coumaric ac | pinocembrin | 0.93 |
| p-coumaric ac | kaempferol | 0.84 |
| p-coumaric ac | CAPE | 0.71 |
| apigenin | chrysin | 0.91 |
| apigenin | galangin | 0.89 |
| apigenin | morin | 0.94 |
| apigenin | pinocembrin | 0.79 |
| apigenin | kaempferol | 0.91 |
| apigenin | CAPE | 0.71 |
| chrysin | galangin | 0.97 |
| chrysin | morin | 0.95 |
| chrysin | pinocembrin | 0.85 |
| chrysin | kaempferol | 0.76 |
| galangin | morin | 0.94 |
| galangin | pinocembrin | 0.94 |
| galangin | CAPE | 0.89 |
| morin | pinocembrin | 0.84 |
| morin | kaempferol | 0.81 |
| morin | CAPE | 0.83 |
| pinocembrin | CAPE | 0.79 |
| umbelliferone | vanillin | 0.92 |
| caffeic ac | p-coumaric ac | 0.81 |
Table 8: Correlation between polyphenols and Pearson's coefficient values of group 2 (Juanicó and Paysandú summer)
| polyphenol(1) | polyphenol(2) | Pearson |
| caffeic ac | pinocembrin | 0.78 |
| Caffeic ac | CAPE | 0.84 |
| p-coumaric ac | quercetin | 0.8 |
| p-coumaric ac | kaempferol | 0.89 |
| apigenin | chrysin | 0.83 |
| apigenin | galangin | 0.85 |
| apigenin | morin | 0.94 |
| chrysin | galangin | 0.89 |
| chrysin | morin | 0.83 |
| galangin | morin | 0.92 |
| galangin | pinocembrin | 0.76 |
| pinocembrin | CAPE | 0.76 |
| quercetin | umbelliferone | 0.75 |
Table 9: Correlation between polyphenols and Pearson's coefficient values of group 3 (southwest)
| polyphenol(1) | polyphenol(2) | Pearson |
| caffeic ac | CAPE | 0.75 |
| caffeic ac | pinocembrin | 0.89 |
| ferulic ac | vanillin | 0.78 |
| apigenin | chrysin | 0.79 |
| apigenin | morin | 0.93 |
| CAPE | chrysin | 0.72 |
| CAPE | galangin | 0.79 |
3.3 Minerals
All analyzed minerals were quantified in all propolis samples. Results are shown in Table 10. The similarity between propolis based on their mineral content is observed in Figure 11. Heterogeneity of compositions is observed, not only between localities but also within the same locality between stations. For example, the propolis from both Juanicó autumn and Cerrillos autumn appear close to each other, but distant from the propolis samples of Juanicó and Cerrillos in spring and summer. The same happens with Paysandú in spring and summer, which appear to be very different. On the other hand, there are cases of very distant localities with similar profiles (Valle Lunarejo and Cerro Largo). R2 values between minerals were calculated. Only Pearson's values over 0.7 were considered, finding a value of R2=0.81 between Zn and Fe, and R2=0.62 between Zn and Mn.
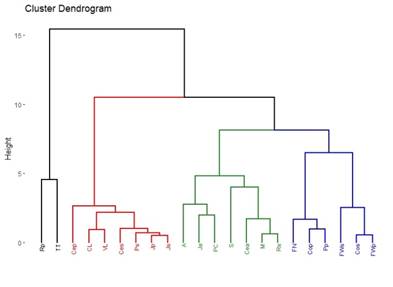
Table 10: Macromineral and micromineral content in g/kg at each locality and season
| Place | Ca | K | Mg | Na | Cu | Fe | Mn | Zn |
| A | 109.0 ± 27.7 abc | 64.2 ± 56.7 bc | 12.4 ± 4.5 de | 28.6 ± 32.6 ab | 5.3 ± 2.6 abc | 28.9 ± 8.7 c | 11.3 ± 2.9 bc | 1.4 ± 0.8 de |
| Cea | 99.3 ± 42.2 abc | 54.5 ± 20.5 c | 20.3 ± 5.0 cde | 15.0 ± 10.3 abc | 0.4 ± 0.4 d | 34.0 ± 10.2 d | 1.0 ± 0.3 c | 0.8 ± 0.2 de |
| Cep | 65.6 ± 23.4 bc | 49.2 ± 17.2 c | 12.3 ± 3.9 de | 8.9 ± 4.5 bc | 2.5 ± 1.2 bcd | 197.1 ± 83.8 bc | 8.8 ± 2.0 bc | 8.2 ± 1.7 c |
| Ces | 69.7 ± 24.5 bc | 58.7 ± 43.5 bc | 15.8 ± 6.9 de | 7.6 ±4.0bc | 0.2 ± 0.1 d | 19.3 ± 8.6 d | 0.6 ± 0.1 c | 1.0 ± 0.4 de |
| CL | 63.6 ± 9.8 bc | 7.5 ± 2.0 c | 7.7 ± 2.0 e | 1.3 ± 0.2 c | 0.2 ± 0.04 ab | 6.9 ± 3.5 c | 1.2 ± 0.3 bc | 0.4 ± 0.1 c |
| Cop | 124.8 ± 72.0 abc | 39.3 ± 19.5 c | 12.2 ± 5.3 de | 8.8 ±4.8 bc | 7.5 ±5.6 a | 36.7 ± 10.3 d | 11.3 ± 5.3 bc | 3.3 ± 1.3 cde |
| Cos | 139.7 ± 57.6 abc | 39.9 ± 17.5 c | 15.7 ± 6.7 de | 6.6 ± 2.6 bc | 0.9 ± 0.5 d | 10.6 ± 3.4 d | 1.1 ± 0.4 c | 0.4 ± 0.1 e |
| FN | 114.4 ±45.4 abc | 70 ± 42.2 bc | 18.7 ± 5.4 de | 16.8 ± 8.2 abc | 6.6 ± 3.5 ab | 65.1 ± 54.8 cd | 10.3 ±3.9 bc | 5.8 ± 2.6 cd |
| FWp | 153.4 ± 36.0 ab | 41.5 ± 27.7 c | 20.3 ± 7.4 cde | 8.0 ± 6.7 bc | 0.9 ± 0.3 ab | 10.4 ± 1.4 c | 1.5 ± 0.3 bc | 0.5 ± 0.1 c |
| FWs | 182.6 ± 96.0 a | 93.4 ± 50.3 bc | 37.8 ± 18.5 bc | 8.8 ± 4.2 bc | 0.6 ± 0.3 d | 14.0 ± 2.1 d | 1.0 ± 0.3 c | 0.5 ± 0.1 e |
| Ja | 64.9 ± 38.5 bc | 71.7 ± 34.3 bc | 9.6 ± 5.3 e | 25.2 ± 25.5 abc | 0.2 ± 0.2 b | 15.9 ± 7.5 c | 0.5 ± 0.2 c | 0.7 ± 0.3 de |
| Jp | 50.3 ± 21.6 c | 56.6 ± 24.9 bc | 9.2 ± 3.9 e | 9.5 ± 4.2 bc | 0.1 ± 0.1 d | 17.6 ± 11.4 d | 0.6 ± 0.3 c | 1.3 ± 1.1 de |
| Js | 49.0 ± 33.4 c | 36.1 ± 8.3 c | 8.2 ± 4.1 e | 8.8 ± 3.3 bc | 0.2 ± 0.2 d | 13.8 ± 3.1 d | 0.4 ± 0.2 c | 0.4 ± 0.1 e |
| M | 60.9 ± 17.4 bc | 96.3 ± bc | 28.3 ± 14.4 cd | 11.1 ± 3.4 abc | 0.2 ± 0.1 b | 13.0 ± 3.0 c | 2.1 ± 1.4 bc | 3.4 ± 2.0 cde |
| Pp | 122.2 ± 37.1 abc | 48.5 ± 21.7 c | 14.0 ± 2.9 de | 5.5 ±1.5 bc | 6.2 ± 3.8 ab | 128.2 ± 73.9 cd | 9.4 ±2.0 bc | 4.7 ±1.1 cde |
| Ps | 56.4 ± 18.5 c | 33.4 ± 7.7 c | 7.7 ± 1.4 e | 5.3 ± 1.5 bc | 0.1 ± 0.1 d | 39.8 ± 63.2 d | 0.6 ± 0.2 c | 0.4 ± 0.1 e |
| PC | 96.6 ± 28.6 abc | 95.5 ± 53.7 bc | 28.3 ± 10.8 cd | 34.1 ± 11.3 a | 0.3 ± 0.1 ab | 41.8 ± 9.2 bc | 2.4 ± 1.2 bc | 1.2 ± 0.4 de |
| Rp | 86.5 ± 16.0 bc | 167.1 ± 104.1 ab | 51.4 ± 9.9 ab | 16.7 ± 6.8 abc | 2.8 ± 1.9 bcd | 330.0 ± 105.0 b | 32.3 ± 9.9 b | 21.0 ± 8.5 b |
| Rs | 74.2 ± 10.5 bc | 89.0 ± 46.0 bc | 29.4 ± 5.0 cd | 12.9 ± 5.8 abc | 0.1 ± 0.03 d | 22.9 ± 4.1 d | 2.0 ± 0.7 c | 0.8 ± 0.3 de |
| S | 113.9 ± 30.2 abc | 210.7 ± 126.7 a | 22.6 ± 7.4 cde | 12.6 ± 6.2 abc | 0.3 ± 0.2 d | 40.2 ± 9.9 c | 1.5 ± 0.5 c | 2.6 ± 0.8 de |
| TT | 121.2 ± 36.9 abc | 103.3 ± 55.0 abc | 66.0 ± 10.3 a | 14.0 ± 7.1 abc | 3.9 ± 2.4 abcd | 640.5 ± 244.6 a | 107.8 ± 48.2 a | 29.6 ± 4.0 a |
| VL | 63.3 ± 11.7 bc | 9.5 ± 9.1 c | 8.2 ± 2.3 e | 2.8 ± 2.6 c | 1.4 ± 0.9 cd | 86.5 ± 69.4 cd | 11.2 ± 2.6 bc | 2.4 ± 1.5 c |
Different letters in the columns mean statistical differences p 0.05. A Aigüa, Ce Cerrillos, CL Cerro Largo, Co Colonia, FN Florida North, FW Florida West, J Juanicó, M Minas, P Paysandú, PC Punta Colorada, R Rocha, S Salto, TT Treinta y Tres, VL Valle Lunarejo, a autumn, p spring, s summer.
4. Discussion
4.1 Plant environment
The 10 land-use categories29 are more than the 8 generated using satellite photos26. In addition, the Urban category was added to achieve a better description of land use. However, there was no improvement in describing different environments to establish an appropriate relationship with propolis based on their polyphenol content (Figure 4 and Figure 5). In pastoral landuse (where low-polyphenol propolis is produced) it is possible to group environments and propolis by their polyphenol content, as shown in red in Figure 4 and Figure 5. Pastoral use could imply the absence of trees or shrubs that provide resins, which could explain the low polyphenol content in these propolis samples. The similarity between Juanicó and Rocha lies in both having a single category of landuse, even though they are different. This is a deficiency of the method employed as descriptive statistics, which simply takes the number as a descriptor. Although there are more categories, they do not better describe the plant landscape. Some localities correspond entirely to one land-use category (Juanicó, Valle Lunarejo, Cerro Largo) when the diversity in these same localities is greater and is better reflected using categories obtained from satellite images.
4.2 Grouping of localities by region according to polyphenols
The polyphenol content allows grouping propolis into three groups. Group 1 is in red (northeast region) in the dendrogram in Figure 4, group 2 in green (combining the three harvest seasons of Juanicó and Paysandú summer), and group 3 in blue (southwest region). Thus, it can be stated that there are two major regions of propolis in the country according to their polyphenol content and profile: the northeastern region with the lowest polyphenol content and diversity (group 1) and the southwest region with the highest content and diversity (groups 2 and 3). In a central area (localities FW and FN, groups 1 and 3, respectively) intermediate values are observed (Table 3, 4, 5 and 6), which are lower than those in groups 2 and 3 FN and higher than group 1 FW. These locations could be in a transitional zone. These regions are presented in Figure 12. The differences in polyphenol content and profile between these groups and within them are explained by variations in soils, climate, and vegetation, as reported in other studies 37)(38) . The identified correlations between polyphenols, in groups 2 and 3, may indicate similar plant sources in the southwest region and different plant sources in the northeast region. In all propolis samples, more than 70% of the polyphenols are due to the combined content of chrysin, galangin and pinocembrin, except in Cerro Largo, Rocha spring and Treinta y Tres, where they still represent more than 50%. Bees seem to have a strong selectivity for resins rich in these compounds. Similar percentage values of pinocembrin are reported in Hungary39) and Europe in general16, and in the case of Hungary, the same happens with chrysin values. In Turkey, variable percentage values of pinocembrin and galangin are observed, but not all localities have high percentages40. In Brazil, on the other hand, the share of pinocembrin and chrysin in propolis is lower, with a notable content of hydroxycinnamic acids41.
4.3 Seasonal differences
In the localities where propolis collection occurred once a year, it was not possible to measure seasonal variations. The slow deposition in these localities indicates the absence of significant plant sources for bees, making them the localities with lower polyphenol content and a poorer profile (Table 1). In Brazil (São Paulo and Minas Gerais), where the climate allows bees to work year-round, variations in resin collection were observed. There were even instances of total absence of resin collection, depending on the environmental and nutritional conditions of bees42.
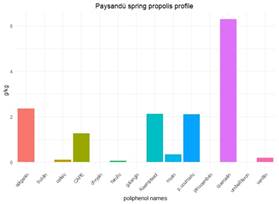
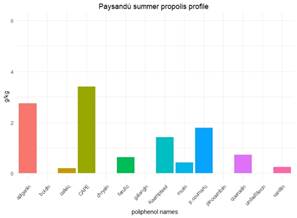
In localities with 2 or 3 harvests, propolis from spring, summer and autumn have similar polyphenol contents, ranging from 78% to 88%. These variations could be explained by changes in the annual vegetation cycle. A study on propolis from Paraná (Brazil) found similar polyphenol profiles between different seasons and years43, explained by the similarity in the vegetation. Variations observed are in the quantities of polyphenols, attributed to changes in temperature conditions affecting both bees and plant physiology in their ability to generate resins. It is also influenced by the nutritional status of colonies, dependent on climatic conditions, affecting the bees' ability to collect resins43. Similar findings were reported in Sonora, Mexico, where propolis exhibited consistent characteristics regardless of the season, with variations mainly in the quantity collected44. Generally, seasonal variations occur in cases of marked changes in temperature or rainfall that alter the flora. In Uruguay, the production of resins appears to have more continuity throughout the season than the production of nectar, which is limited to the flowering period. However, two exceptions were found in the propolis of Paysandú spring (Pp) and summer (Ps). They show a change in the profile and concentration of polyphenols, explaining their placement in different groups in the dendrogram (Figure 5) with a similarity of 65%. The polyphenol content in Ps is higher, especially in the top 3 constituents. Only p-coumaric acid, kaempferol and quercetin exhibit reduced quantities in Ps. One hypothesis would be that two different plant sources, the one that supplies p-coumaric acid and kaempferol, on the one hand, and the one that supplies kaempferol and quercetin, on the other, stop producing in summer or are replaced by other plant sources preferred by bees or a combination of these events. The Paysandú apiary is close to the Uruguay River, which acts as a route for plant species from southern Brazil (subtropical). In addition, this locality has higher temperatures than localities in the south. Exotic species can settle and bees could take advantage of them in summer. The differences between polyphenols are shown in Figure 13 and Figure 14, where the three main polyphenols were removed to facilitate the visualization of the others.
4.4 Comparison with other propolis in the world
When comparing the values found with other global propolis polyphenol content, a significant similarity in content and profile is observed with Chinese propolis originating from Populus sp.45. Chinese propolis of this origin has a higher content of hydroxycinnamic acids, but different solvents are used45, potentially resulting in different profiles. Hydroxycinnamic acids show higher maximum values in propolis from Hungary39, Turkey40) and eastern and southwestern Europe16. In the case of propolis from group 1 (northeast), the values of this family are even lower. This region borders Brazil, where propolis with very low polyphenol content is reported46. The similarity in climate, soil and vegetation with southern Brazil explains the results. In Brazil, brown, green and red propolis are analyzed for their polyphenol content,with rutin detected in all of them, unlike in Uruguay. Green propolis shows higher values of caffeic acid and p-coumaric acid, but other polyphenols exhibit similar (kaempferol) or lower (apigenin, chrysin, pinocembrin, and vanillin) values46. On the other hand, the contents of chrysin, galangin and pinocembrin cited for Chinese propolis45 and European propolis 16)(39) fall within the range with few values higher than those found in southwest Uruguay. Soil fertility and greater colonization of European species, whether ornamental or associated with crops, would explain these contents.
4.5 Correlations between polyphenols
Regarding the correlations found between polyphenols, it can be assumed that those correlated come from the same plant species. In this regard, clear associations are observed, such as umbelliferone and vanillin in group 1, or ferulic acid and vanillin in group 3, which could represent different plants in each region. The species Parkinsonia aculeata is reported as a source of umbelliferone when its methanolic extract is studied47. This species is present in Uruguay, specifically along the Uruguay River (Paysandú locality)48. Other species cited as sources of umbelliferone49) are also present in Uruguay. This study mentions, among other species, Picea abies and Platanus acerifolia, both present in Uruguay as introduced species50. It also mentions the species Hidrangea macrophylla, also present in Uruguay51. A comprehensive survey of the flora of each locality far exceeds the objectives of this study. The mention of these species is not intended to attribute the exclusive origin of the found polyphenols to them, other possible sources should be considered. Associations between apigenin, chrysin, galangin, and morin are also observed in both groups 2 and 3 (Figure 9 and Figure 10), both groups in the same region (southwest), which could be due to the same plant origin. There are other more complex associations where this cannot be asserted, requiring further investigation, such as the association between caffeic acid, CAPE, and pinocembrin, observed in group 2 but not in group 3 (Figure 9 and Figure 10). On the other hand, those polyphenols with low correlations with all others could be assumed to originate from different plant sources, such as boldine. This should be taken as an indication of plant origin and further research into polyphenolic compositions in different plants in each region should be conducted. Regarding pinocembrin, one of the most abundant polyphenols present in all the propolis obtained, plant sources of the genera Populus, Parkinsonia and Myrceugenia are mentioned52. All these families or genera are present in Uruguay supporting the idea of finding propolis similar to European ones, but with polyphenols provided by native flora. Chrysin, galangin and pinocembrin are mentioned as responsible for different medicinal properties52, especially in different types of cancer due to their involvement in apoptosis mechanisms and prevention of angiogenesis53. Group 2 and 3 propolis exhibit promising polyphenol values in terms of their medicinal potential.
4.6 Minerals
The difference between localities in concentration and mineral profile is explained by the different geological materials that originate in the soils in each locality. Additionally, the mineral content of the water that the bees bring to the hives is variable. Differences between studied regions are reported in India, Spain, and Serbia, with sometimes greater differences observed between closer localities 11)(12) 13. More difficult to explain is the variation within the same locality between seasons (Figure 11). Propolis from the same locality with the same soils and vegetation should be similar in mineral content. In Turkey, propolis from nearby regions (Ardahan and Erzurum) do not show differences in minerals, attributed to their geographical proximity54. The minerals in propolis are explained by those naturally present in resins, those added by bees in the process and others that arrive as external contaminants. The latter are variable and depend on environmental factors.
In this regard, the variation in winds and rainfall patterns could explain the arrival or absence of dust to the resins, which, depending on their physical nature, will either retain or not. Rainfall, based on its quantity, washes away these minerals, depending on their solubility. Finally, the different structures of the plants where resins are generated, whether exposed or not, can alter the retention by wind and washing by rain. In terms of concentrations, the analyzed minerals fall within the ranges reported for other propolis in the world 11)(12) 13. Calcium (Ca) and Potassium (K) are the predominant minerals in most localities, except Treinta y Tres and Rocha (Table 10). In these two localities, iron, magnesium, manganese and zinc show high values that differ from the rest of the localities but fall within reported ranges 11)(12) 13. The presence of different minerals is a reflection of the soils and plants present in the environment 12)(13) . The Treinta y Tres apiary is located on the batholith of the Cuchilla de Dionisio formation. This formation contains minerals such as quartz, feldspars and biotite, which could be the source of iron that explains the high values55. The correlation between Fe, Zn and Mn suggests a common source of origin. The Na value in Punta Colorada, while not different from others mentioned, and not statistically higher than other localities, is explained by the proximity to the sea. This element can be considered as a contaminant that arrives from the sea depending on the rainfall and wind patterns56. In some studies, the nutritional value of some elements present in propolis (Fe, Mg, Mn, Zn, among others) is highlighted 11)(12) 13. Without intending to minimize these contributions, valid in certain dietary situations, in Uruguay these minerals are obtained from other food sources. The results suggest that Fe and Zn could serve as geographical markers for the locality of Treinta y Tres.
5. Conclusions
The use of categories of land use by production items did not allow for the grouping of propolis. Differences were observed among propolis samples based on their production locality in terms of both content and polyphenolic profile. No significant differences were detected in the seasonal production of propolis. The locality of Paysandú, with greater seasonal changes, should be further investigated. The correlations found between polyphenols could indicate diverse plant origins in each region. The group of hydroxycinnamic acids exhibits low concentrations, while flavonols, flavones and flavanone (pinocembrin) present high concentrations compared to other propolis in the world. These high concentrations suggest medicinal potential that should be investigated. The mineral content in general does not serve as a reliable geographical marker. Some localities should be further studied for their Fe, Mn and Zn content.

