


 English (pdf)
 Article in xml format
 Article references

 Permalink
1. Introduction
Propolis is one of the products obtained from Apis mellifera. Bees mix plant-based resins with their own waxes1 and salivary secretions2 to achieve a product they use as varnish and sealant. Its importance for humans lies in its medicinal use. Egyptians, Greeks, Romans and Europeans since the 17th century recognize its properties in the treatment of wounds3. In the 20th and early 21st centuries, its medicinal uses expanded: antibacterial4)(5, antifungal6, antitumor7, anti-inflammatory8, antiviral9)(10, hepatoprotective3 and anti-karyogenic11. However, it has the disadvantage of not being a homogeneous product. At first glance, the different colors indicate its heterogeneity. Therefore, propolis colors are mentioned depending on its botanical origin 12. The reported color denominations are: brown, orange, dark orange and dark green13, blackish brown, orange, greenish-brown, orange-brown, greenish-brown and reddish brown14, yellow15. In all these studies, colors are associated with different chemical properties. The different colors reflect different botanical origins. They are propolis with different compositions, especially polyphenols. But colors are always mentioned from raw or crude propolis, unprocessed or undiluted with solvents. There is no official methodology to determine color in propolis13. However, color and other variables such as pH, conductivity and ash are easy, quick and inexpensive to determine. There are few studies on propolis in Uruguay, and they do not specify geographical or botanical origin or production period. These studies point out the need to continue investigating16)(17)(18. Specifically, propolis from the south has greater antioxidant power than honey and red wine19. But the study of propolis from Uruguay is not exhaustive. The diversity of soils and vegetation in the country leads to different propolis20)(21. In 2018, georeferenced propolis indicated quality differences in terms of color, concentration and polyphenols profile in two locations, North (Valle Lunarejo) and South (Los Cerrillos)22.
This study aims to measure color (CIEL*a*b*), pH, electrical conductivity, ash and polyphenol content and total flavonoids, and determine possible relationships between these variables in a collection of georeferenced propolis from different locations in Uruguay characterized by their vegetation.
2. Materials and Methods
2.1 Sampling
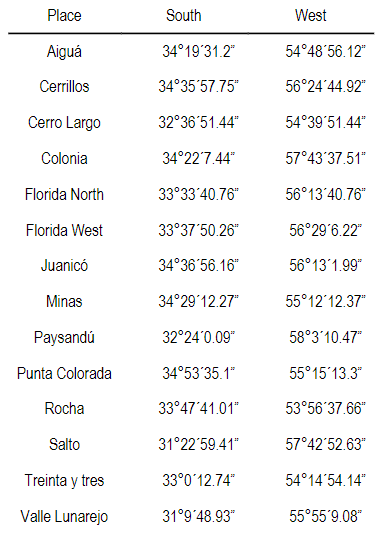
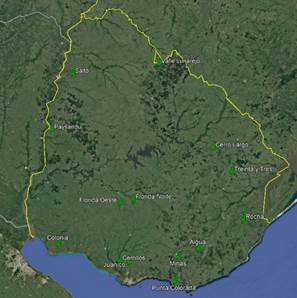
The apiaries used were ours and from collaborating beekeepers. The location of the apiaries is seen in Figure 1. The coordinates of each apiary are presented in the supplementary material. From these coordinates, the vegetation present within a radius of 2 km of flight is quantified according to satellite images23. The categories considered were: crops, Eucalyptus afforestation, highland vegetation, natural grassland, other afforestation, parks and gardens, river forests and water surfaces, and are presented as percentage (Table 1).
Propolis samples were obtained from meshes in spring 2020, and summer and fall 2021. In each apiary, 5 empty meshes were placed, in different hives, at the same time. These meshes were removed with the following criteria: being more than 50% covered or at the end of the productive season (autumn). The extraction was performed manually after placing the meshes for 5 minutes in a freezer at -20 °C. Before packing it, the remains of vegetables and bees, wings or legs, that may have contaminated it were removed from the apiary surroundings. Pieces of wax were also removed when these were evidently wax and not part of the propolis. Some studies report keeping the samples after harvest at -20 °C6)(14)(24)(25, at 0 °C26, between 0 and 5 °C21 and others worked with propolis supplied by companies or beekeepers without establishing the temperatures at which they were maintained after harvested16)(27. The samples were kept at a laboratory room temperature between 18 and 25 °C. These temperatures are lower than 34 °C inside the hive during the collection period, and lower than 45 and 70 °C, temperatures reported in the extraction processes27)(28. From each sample, 2.5 g were weighed and 25 ml of ethanol 80% were added. This mixture was taken to a heat stirrer (Gyrotory ® New Brunswick Scientific Co. Edison, NJ, USA) for 4 h at 30 °C and 70 rpm. It was stored in a refrigerator (4 °C) for a week. Color, concentration of polyphenols and total flavonoids were determined from this ethanolic extract. An aqueous solution was also prepared by weighing 2 g of each sample and adding 20 ml of distilled water. It was stirred for 4 h at 30 °C, and subsequently taken to the refrigerator (4 °C) for a week. Finally, it was filtered using a 1 mm mesh to separate the larger pieces of propolis and waxes in suspension. With this aqueous solution, pH and conductivity were determined.
Table 1: Percentage of the different vegetation categories in each locality
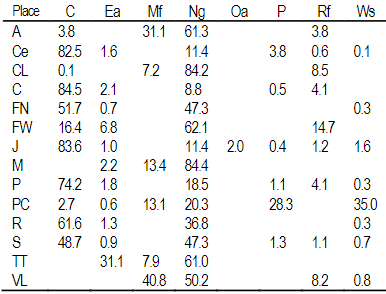
A Aiguá, Ce Cerrillos, CL Cerro Largo, C Colonia, FN Florida North, FW Florida West, J Juanicó, M Minas, P Paysandú, PC Punta Colorada, R Rocha, TT Treinta y Tres, VL Valle Lunarejo, C crops, Ea Eucalyptus afforestation, Mf highland vegetation, Ng natural grassland, Oa other afforestation, P parks and gardens, Rf river forest, Ws water surface
2.2 Color
The obtained ethanolic solutions were filtered using ashless paper filters MN 640 d No.42 (Macherey Nagel) to remove any turbidity that made them heterogeneous. It was then placed in disposable 4 cm³ polystyrene trays for 10 mm optical path spectrophotometry (PlastiBrand™, Germany). The trays were capped and placed vertically on a white background in a room illuminated with fluorescent light tubes (Radium NL 36 watts/830 Spectrolux plus warm white Germany). A blank was made with the empty tray, and another with 80% ethanol. Color was measured three times in the central area of each tray, and the readings were averaged. The CIEL*a*b* method was used. Measurements were made with a colorimeter (Konica Minolta CR-10, Japan), D65 illuminant, 10° observer and 8° illuminant angles. The color variables measured were: luminosity (L*), a* (+a* red, -a* green) and b* (+b* yellow, -b* blue), and the tone (Hue, ºHab) and saturation (Chroma, C*ab) were calculated with the following equations:
ºHab = arctan (b*/a*)*180/π
C*ab = √ (a*2 + b*2)
2.3 pH, electrical conductivity and ash
Determinations were made at room temperature (20 °C), from the aqueous solution. A pH meter (JENWAY 3305, UK) and a conductivity meter (OAKTON CON 10, USA) were used. Conductivity data were expressed in microS/cm. To determine the ash content, 2 g of propolis were weighed and baked for 48 h at 580 °C. The data were expressed as a weight percentage.
2.4 Total polyphenols and total flavonoids
With the prepared ethanolic extract, a preliminary test was performed to adjust the dilution factor to enter the reading range of the spectrophotometer. Based on these preliminary results, 0.1 ml of dark propolis (L* ≤ 42) was taken, or 0.25 ml in the case of light propolis (L* > 42). Before preparation, it was filtered with ashless paper discs MN 640 d N°42 (Macherey Nagel) to eliminate possible turbidity. In both cases, it was brought to 10 ml with 80% ethanol. From this solution, 0.1 ml was taken, and 0.5 ml of H2O, 0.4 ml of Folin reagent and 1.25 ml of Na2CO3 were added. It was left in the darkness for 1 h before the reading. Absorbance was measured at 760 nm.
A three-point calibration curve was performed using gallic acid monohydrate, 98% ACS, (Sigma-Aldrich). The values used were 125 mg/l, 250 mg/l and 500 mg/l. The results were expressed as grams of gallic acid equivalent per kg of propolis (gGAE/kg propolis). To determine flavonoids, the same ethanolic solution was used, which were also filtered to become homogeneous. 0.5 ml were taken (undifferentiated by color), to which 1.5 ml of 80% methanol, 0.1 ml of AlCl3, 0.1 of Potassium acetate and 2.8 ml of water were added. It was left to rest for 30 minutes and absorbance was measured at 415 nm. A three-point calibration curve was performed using quercetin ≥ 95%, (HPLC)(Sigma-Aldrich). The values used were 25 mg/l, 50 mg/l and 100 mg/l. The results were expressed as grams of quercetin equivalent per kg of propolis (gQE/kg propolis). A spectrophotometer (Genesys 10S Thermo Electron Scientific Instruments LLC, USA) was used for these measurements.
2.5 Statistical analysis
Analysis of variance were performed to compare propolis between locations and seasons, in terms of variables of color, pH, conductivity, total polyphenols and total flavonoids. Determination coefficients were calculated from the analyzed variables. Dendrograms were performed as a comparative statistics technique. Locations were compared from the vegetation point of view. For this, the percentages of the 8 defined vegetation categories were used as variables. All the propolis obtained (22) were also compared, and all were grouped by locality (14). The variables used were: ash, gGAE/kg, gQE/kg, L*, a*, b* and pH. In all cases, the Ward method and the Euclidean distance were used. The program Rstudio29) was used.
3. Results
3.1 Figures and tables
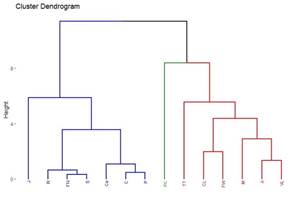
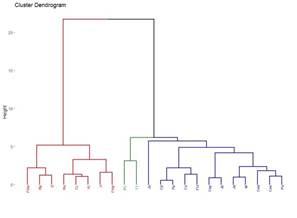
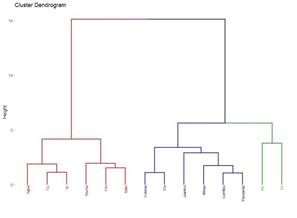
A total of 22 groups of 5 samples were obtained, corresponding to 14 locations in Uruguay (Table 2). In the localities of Aiguá, Cerro Largo, North Florida, Treinta y Tres and Valle Lunarejo, a single harvest was obtained; the meshes placed in spring were removed in autumn with little propolis. In Minas and Salto, which also obtained one harvest, the meshes were placed late in spring (November), considering it summer production. The apiary in Punta Colorada had to be removed because it was in an urban area, without the possibility of obtaining it from other stations. Figure 2 shows the similarities between localities according to vegetation categories. In some, the presence of crops (in blue) has greater influence; in others, the natural grassland (gray). Punta Colorada is a very atypical environment where the urban environment and the proximity to the sea make it different than the rest. Figure 3 shows the dendrogram of all the propolis (22) obtained, and Figure 4 the dendrogram of the propolis (14) grouped by locality. As observed, there is no direct correspondence between vegetation similarity and propolis. It is observed that the propolis of different stations but of the same locality remain within the same group. The geographical proximity does not indicate the similarity of propolis; for example, Cerrillos is closer to Juanicó than to Paysandú (Figure 1).
Table 2: Propolis obtained by locality and season
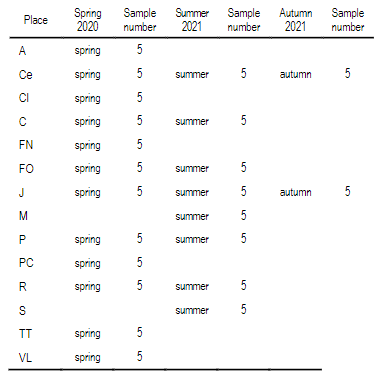
A Aiguá, Ce Cerrillos, CL Cerro Largo, C Colonia, FN Florida North, FW Florida West, J Juanicó, M Minas, P Paysandú, PC Punta Colorada, R Rocha, TT Treinta y Tres, VL Valle Lunarejo
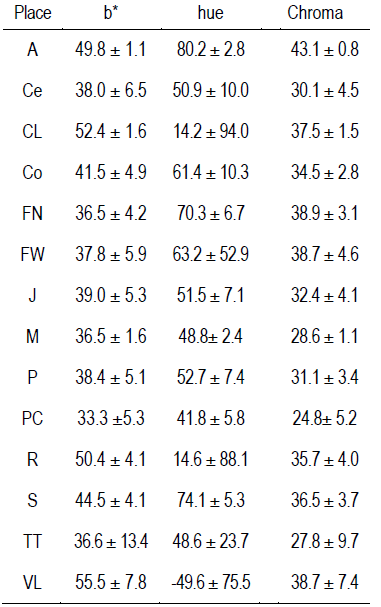
3.2 Color
The results of the L* and a* color variables of each locality are presented in Table 3. The full data are presented in the supplementary material (Table 1 and 2). Both variables present differences between localities and wide ranges of values: 26.4 to 58.1, and -5.3 to 21.5 in L* and a*, respectively.
3.3 pH, electrical conductivity and ash
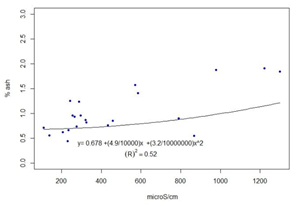
The results for each location are presented in Table 4. The full data are presented in the supplementary material. The coefficient of determination between ash content and conductivity was calculated, R2=0.52 (Figure 5).
Table 3: Mean +/- standard deviations of L*, a* and polyphenols (gGAE/kg propolis) and total flavonoids (gQE/kg propolis) in each locality
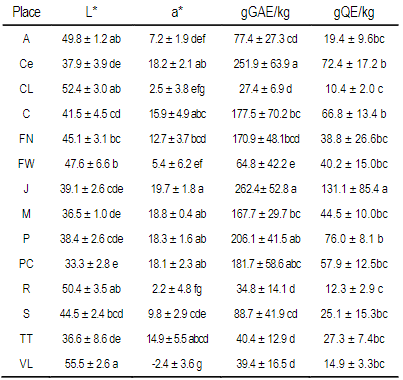
Different letters in columns mean statistical differences (p<0.05 Tukey-Kramer). A Aiguá, Ce Cerrillos, CL Cerro Largo, C Colonia, FN Florida North, FW Florida West, J Juanicó, M Minas, P Paysandú, PC Punta Colorada, R Rocha, TT Treinta y Tres, VL Valle Lunarejo
Table 4: Means +/- standard deviations of the variables pH, electrical conductivity and percentage of ash in each locality and season
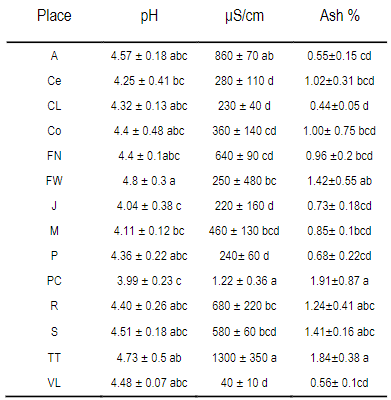
μS/cm, Electrical conductivity microSiemens/cm. Different letters in columns mean statistical differences (p<0.05 Tukey-Kramer). A Aiguá, Ce Cerrillos, CL Cerro Largo, Co Colonia, FN Florida North, FW Florida West, J Juanicó, M Minas, P Paysandú, PC Punta Colorada, R Rocha, TT Treinta y tres, VL Valle Lunarejo, a autumn, p spring and s summer
3.4 Total polyphenols and flavonoids
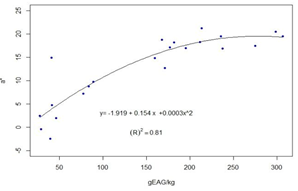
The results for each location are presented in Table 3. The full data are presented in the supplementary material. For the 22 groups of propolis, calculations were performed of the coefficients of determination between the average contents of polyphenols and the average values of L* R2=0.61 -Figure 6-, and the average values of a*, R2=0.81 -Figure 7-.
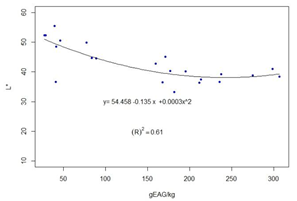
Figure 6: Regression curve and value of R2 between the average value of L* and the average value of the total polyphenols in each locality and season
4. Discussion
4.1 Samples obtained
The difference in the production of propolis between locations is explained by differences in soils, climate and vegetation30. In localities of lower harvest, Aiguá, Cerro Largo, West Florida, Treinta y Tres and Valle Lunarejo (all with one harvest date) lower concentrations of polyphenols and total flavonoids were found (Table 3). Slow or scarce propolis collection with low polyphenol content suggests the absence or scarcity of vegetation with attractive resins for bees. This is supported by data in Table 1, where high percentages (>50%) of natural grassland are observed in these localities. The exception is Rocha, but a high percentage of rice crops are found there. Being irrigated much of the spring and summer seasons, that area becomes unavailable and would raise the percentage of natural grassland within the area explorable by bees. It must be considered that bees evolved in Eurasia for millions of years; in evolutionary terms, the 400 years of presence in America are not significant enough to adapt to the collection of possible resins or gums of the American flora. However, exceptions within the American flora, such as the genus Clusia15 or the species Dalbergia ecastaphyllum30 that generates the red propolis, justify the search for propolis generated by our flora. As for the similarity of propolis. The propolis of the localities of Florida West, Rocha, Salto and Treinta y Tres are not grouped according to the logic of the grouping by vegetation. In the case of Treinta y Tres and Punta Colorada, they are grouped as propolis and are not so distant from the vegetation point of view. The way of measuring vegetation in this study was not sufficient as a discriminating factor, despite showing a trend. The weight of the interaction between soils and climate with vegetation may be decisive, as well as the different species that make up the same category in each locality. This also supports the fact of not finding differences in the measured variables between propolis within the same locality. Soils and vegetation are the same, there may be seasonal changes in the crops, but not in the arboreal or shrubby vegetation.
4.2 Color
Accordingly, differences in color variables appear between locations, but not between seasons within the same location. We focused on L* and a* given the correlation found with polyphenol content (Figures 6 and 7). The same behavior is observed in honey, another complex matrix of beekeeping origin, where the L* value is affected by the value of total polyphenols31 and the mineral content32)(33. In the case of propolis, the solvent used (ethanol 80%) does not extract minerals, so the dark and reddish coloration would be due to polyphenols. This is why the calculated correlation between L* and ash (R2=0.09) is very low. The determination of color variables in alcoholic extracts (both L* and a*) could be used to classify propolis by its polyphenolic content. Variable a* presents a higher correlation with total polyphenols (R2=0.81). This could be explained by the presence of anthocyanins (reddish colors)14.
4.3 pH, conductivity and ash
Both pH and conductivity were determined in water, but it is not the best solvent to extract the active compounds in propolis34. In fact, it had to be filtered out as large particles remain undissolved, apart from the naturally present wax. Only one published paper was found that measured pH in propolis, but in methanol solvent4. As with color, pH and conductivity are easy and inexpensive to determine, which would be useful to correlate with the presence of polyphenols. The pH does not allow drawing conclusions or separating propolis. The conductivity correlates with the ash content (Figure 5). The ash values found, 0.55% to 1.84% (Table 4), are slightly lower than those reported in different regions of Portugal, ranging from 1.6% to 2.2%4 or from 0.5% to 16%13, and in Brazil, where values found are between 2.5% and 4.6%35. The propolis obtained by scraping was likely to be contaminated by the working environment (sheds or workshops). In our case, the meshes are removed from the hive in plastic bags that are taken to the laboratory. The mineral content of propolis can be due to the contribution of the plant species that generate them, environmental pollution and minerals typical of the soils of each locality. Bees could have collected other substances (soil) in places where resin production is scarce, as well as pollen from grasses (Sorghum sp.)36 in the absence of higher protein pollen.
4.4 Total polyphenols and flavonoids
The content of polyphenols and flavonoids makes it possible to regionalize propolis production in Uruguay. The localities of the south and southwest of Uruguay have greater contents than those of the north and northeast, while the center (north and west Florida) present average values that indicate a transition (Table 3). In the south and southwest localities, polyphenol contents are higher (177 to 262 gGAE/kg) than those mentioned in researches of propolis from Brazil (São Paulo), 98.7 gGAE/kg37, or from other states of Brazil with values from 6 (Bahia) to 46 (Paraná) gGAE/kg26. They are also higher than those found in Algeria, of 10 and 60 gGAE/kg38, or are within the ranges found in India14, Japan39 and China40, Australia41, Poland, Romania and Turkey42, and Portugal43.
In the case of flavonoids, values were found within the ranges of the cited worldwide14)(39)(40)(41, but higher than those cited for Uruguay, of 48 gQE/kg42. Flavonoids also present higher values in the southern and southwestern localities. The south, southwest and west of Uruguay are agricultural areas due to their soils fertility and where Europeans settled with their crops (and associated weeds) and ornamentals, this would explain the similarities with propolis of those origins. In Punta Colorada, far from this agricultural area, propolis presented high polyphenolic content that can be explained by the urbanization of the town with the presence of gardens and parks with introduced flora of diverse origins (Table 1). The modification of the flora of a town through the introduction of exotic vegetation (European or Asian), even in small amounts, would modify the composition of the propolis.
Finally, the town of Juanicó presented an average flavonoids value of 131 gQE/kg resulting from an average value of flavonoids in summer of 241 gQE/kg propolis with a maximum in that season of 302 gQE/kg propolis. These values differentiate from the rest of the studied locations and are higher than other values reported for propolis of other origins37)(39)(40)(41)(42)(43. The presence of highland vegetation with non-eucalyptus species (Cupressus sp.) could explain the results (Table 1). The differences in polyphenol and flavonoid contents even between nearby localities imply different medicinal potentials. While certain polyphenols or combinations of them have medicinal value44)(45)(46, the greater amount (regardless of profile) accompanies greater antioxidant activity19. From this arises the need to work with georeferenced propolis, so as not to underestimate the true potential of propolis, which are cited as Uruguayan41 ignoring the existing diversity.
5. Conclusions
Different locations have different propolis production potentials. The differences found allow separating regions in the country. The grouping of localities using plant categories identifiable in satellite images does not allow equally grouping the found propolis. Another way of characterizing vegetation should be studied. No seasonal differences were found between propolis from the same locality. Electrical conductivity could be used as a predictor of mineral content in propolis. Variables L* and a* could be used as predictors of total polyphenol content. The propolis of the southern and western localities have polyphenol contents that merit further study. In particular, the flavonoid content found in Juanicó justifies continuing to study that locality both over time and regarding the present vegetation. Studies on Uruguayan propolis should continue in terms of the vegetation that originates them, their polyphenol content and profile, in other localities and over a longer period.