


 English (pdf)
 Article in xml format
 Article references

 Permalink
1. Introduction
In Southern Patagonia (Argentina), natural grasslands represent the main forage resource of existing extensive livestock systems for sheep. However, the historical management of the Patagonian steppes with continuous grazing and high fixed animal loads led, among other effects, to the reduction of the most palatable forage species for livestock due to overgrazing and selectivity1. In addition, the low availability and high variability of the forage supply related to cold temperatures, snowfalls and droughts in the region limit the productivity of the predominant extensive livestock production systems.
In this context, it is necessary to point out that in arid environments the aerial net primary productivity (ANPP) of the vegetation is related to the availability of water2 and the edaphic water content derived from the rainfall regime3 due to changes in foliar growth rates and photosynthesis of plants4. Likewise, the environmental temperature conditions at the beginning of the growing season and the period of maximum accumulation of forage from the vegetation5. This is associated with an earlier spring growth reported in a Festuca pallescens grassland in central Patagonia, due to higher temperature values of the season compared to the previous cycle6.
As previously stated, the sowing and use of pastures in Southern Patagonia is a valid management alternative, which would allow, among other benefits, to alleviate the winter forage deficit of the pasture and improve the productive indices of livestock in times of higher nutritional requirements7. Based on this, previous reports in Southern Patagonia evaluated by cutting under experimental conditions forage species introduced from North America of the genus Agropyron with promising results in forage production and quality, given their adaptation to environmental and edaphic conditions of the region8. In favor of this, in the United States and New Zealand, Assay and Jensen9 and Wills and others10 reported that “Intermediate Wheatgrass” (Agropyron intermedium (Host) Beauvois), and “Pubescent Wheatgrass” (Agropyron trichophorum (Link)) stand out for their yield and quality towards mid-spring, and resistance to cold and propagation by rhizomes, respectively.
From what has been described, the need arises for a better knowledge of the growth and production of forage in pasture and grassland communities of the Patagonian steppe associated with edaphic and climatic factors of the region. Previous works on grasses introduced in the temperate11)(12 and central semi-arid13 regions of Argentina evaluated the relationships between morphogenetic and structural characters with the physical environment, which would allow the elaboration of efficient and sustainable strategies of forage usage14. However, the absence of these trials in Patagonia is notorious, which would justify this study with the objective of relating the productivity of an introduced pasture and grassland, the living and dead material, and the foliar elongation of wheatgrass with soil moisture and thermal sum in the south of the region.
2. Materials and methods
2.1 Location and description of the experimental site
The trial was carried out at the Potrok Aike Experimental Field (105 km southwest of Río Gallegos) of the EEA-INTA Santa Cruz in the Dry Magellan Steppe (Estepa magallánica seca) ecological area in the South of Santa Cruz (51°56'57.8'' LS, 70°24'42.5'' LO). Natural vegetation is a 59%-cover perennial grass steppe with three strata: tussock grasses, mainly Festuca gracillima, with 14% absolute cover; prostrate, dwarf shrubs including Nardophyllum bryoides and other species cover 12%; and short grasses and herbaceous forbs constitute the remaining 33%, with Poa spiciformis as dominant, and Rytidosperma virescens with Carex andina as companions15.
The history of use of the grassland corresponds to a continuous grazing in 12 continuous fields with ovine, with an annual stocking rate adjusted according to the measured forage availability. Therefore, there are no symptoms of overgrazing16.
The pasture and grassland are located on a low plain in a physiographic environment of 323 ha in the Meseta Landscape Unit terraced with proglacial boulders17. The climate of the area is cold and arid, with an average annual rainfall regime of less than 200 mm, with slight summer trends, and mean annual temperatures that range between 6 and 7 °C18)(19. The soil of both forage resources (Taxonomic Classification: Haplustol lithic, sandy loam fine17) presents a loamy-sandy texture, with surface values of 0-15 cm and a depth of 15-30 cm. It has slightly alkaline pH (7.1) and slight acidity (6.7), mean organic matter contents (3.3 and 3.4%), mean total nitrogen values (0.15 and 0.16%) and high potassium (167 and 117 ppm). It does not have salinity and sodium problems (Source: Soil Laboratory, EEA INTA Bariloche).
2.2 Climatic measurements and determination of the thermal sum
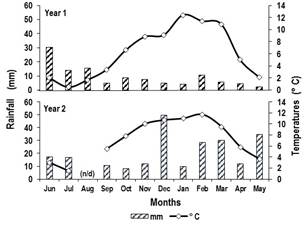
At the experimental site, in the periods of June-May 2015/16 (Year 1) and 2016/17 (Year 2), rainfall and average daily temperatures were recorded with an automatic weather station (Model Vantage Pro 2, Davis Instruments, USA). The monthly values of these parameters were calculated. In this context, the rainfall reported was 112.8 (Year 1) and 229.8 mm (Year 2). The concentration of rainfall happened at different moments for the two periods. For Year 1, the highest concentration was 59.8 mm during the winter months. For Year 2, on the contrary, the highest concentration was 80.6 and 68.4 mm in spring and summer (Figure 1).
In turn, in the September-February interval of the Year 1 and the Year 2, the average monthly temperature ranges recorded were 3.4 to 11.4 and 5.5 to 11.7 °C, respectively (Figure 1). Next, with the values of the mean daily temperature (MDT) of both years, the accumulated thermal sum (TS) was calculated by date and between monthly dates, through the sum of MDT-base temperature of 4 °C20.
2.3 Determinations in the vegetation
2.3.1 Plant height and aerial biomass
In a mixed pasture (39 ha) of Intermediate and Pubescent Wheatgrasses (Sowing Date: 15/Apr/2013) implanted without irrigation and fertilization and in the grassland, six and three permanent closures (2.5 m × 2.5 m) were installed, respectively. In two frames of 0.1 m2 per closure, the mean height of 3±1 wheatgrass plants was measured monthly with a graduated ruler for the pasture and for the most frequent forage species of the grassland, respectively. After this, manual cuts to the vegetation with a mixed pasture and grassland (short grasses and herbaceous forbs) vegetal cover=35 and 33% were made at a height of 2 cm in each frame, at a monthly frequency (34±3 days), according to the daily average temperatures, from mid September (homogeneity cut) to mid February for Year 1 and Year 2. In the laboratory, the forage samples collected by date were dried in an oven at 60 °C until constant weight to determine the accumulated aerial biomass (AAB) in kg of dry matter per hectare (kgDM.ha-1).
2.3.2 Growth rate, live and dead material, and live aerial biomass
The daily growth rate (DGR) of the vegetation between cut-off dates in kgMS.ha-1.day-1 was estimated by the quotient between the difference of the AAB in the interval of two consecutive measurements and the elapsed days. Then, the pasture forage samples were separated into live (LM, green leaves and stems) and dead material (DM, senescent leaves and stems, and spikes) to characterize their relative proportion based on dry material. Next, the live accumulated aerial biomass (LAAB) was calculated using the formula: AAB×LM/100.
2.3.3 Leaf elongation rate
From 36 selected wheatgrass plants in the 6 permanent closures installed in the pasture (6 plants per closure), 2 tillers per plant were marked with wire rings14 and a homogeneity cut was made, leaving 2 cm of height remaining at the beginning of the season (September). Next, in the cut-off dates established in Year 1 and Year 2, the total length of green lamina (GL) per tiller from the ligule to the distal end of the lamina or to the border of the senescent area14 was measured with a graduated ruler in the expanded leaves. Finally, the leaf elongation rate (LER) between dates in mm.day-1 was determined by the quotient between the difference in leaf lengths (LL) in the lapse of two successive measurements and the days elapsed.
2.3.4 Soil moisture
At each closure of the pasture and grassland and by cut-off date, a soil sample was collected with a manual cylindrical drill at a depth of 20 cm and was packed in a plastic bag to determine the soil moisture by dry mass using the gravimetric method21. In the laboratory, the collected wet samples were weighed with a digital scale (Brand: OHAUS, accuracy: 1 g). It was then dried in a forced air stove at 60 °C to constant weight to determine the dry mass and then estimate the moisture percentage using the formula: wet weight - dry weight/dry weight ×100.
2.4 Experimental design and statistical analysis
The AAB of pasture and grassland was analyzed using a 2×2×5 factorial arrangement, i.e. Forage Resource (FR, Fixed Factor; Pasture and Grassland), Year (Fixed Factor; Year 1 and Year 2) and Date (Fixed Factor; October, November, December, January and February). The factorial arrangement was included in a completely randomized design with 6 and 3 repetitions in pasture and grassland, respectively. The results of each experimental unit represented by each pasture and grassland closure and characterized by mean of 2 frames (sub-samples) by closure were subjected to an analysis of variance (ANVA) using the mixed procedure of repeated measures analysis (ProcMixed, SAS) according to the following model:
y = µ + FR + Year + Date + FR × Year + FR × Date + FR × Year × Date + Error
Where y = AAB; µ = general mean; FR, Forage Resource (Pasture and Rangeland); Year = year in which the measurement was made (Year 1 and Year 2); Date = Cut-off-Date (October, November. December, January and February).
Subsequently, the means of the AAB of the pasture and the grassland, and the differences between means of the interactions described in the analysis model were adjusted with the Tukey-Kramer test with a significance level of 5%. Likewise, the values of plant height (PH) of the pasture and grassland and the AAB and LAAB of the 1st forage resource were related to the TS by means of polynomial regressions. The relationship between the PH and the LAAB was analyzed using Pearson's correlation index.
In turn, the DGR of both forage resources, the LM and the LER of the pasture per year were related to the soil moisture (SM) and the TS by means of linear and quadratic regression functions with the Stepwise procedure of the SAS statistical program. In this context, the predictor variables of the parameters of interest entered the multiple analysis model executed with a significance level of 15% (P=15) and the criterion for choosing the best model was established according to R2.
3. Results
3.1 Plant height and aerial biomass
As the thermal sum (TS) progressed, the height (mean ± standard deviation) of wheatgrass plants varied between 17±3 and 23±5 cm (Year 1), and between 10±2 and 25±5 cm (Year 2). The variation of this parameter related to the TS (Figure 2) through the following quadratic polynomial regression models: Year 1 y = 6.31 + 0.07x - 0.0001x2; R2 =0.64; P<0.0001; Year 2 y = 5.86 + 0.04x - 0.00002x2; R2=0.70; P<0.0001. On the other hand, in Year 1 and Year 2, the PH (mean ± standard deviation) of the most frequent species of the grassland ranged between 4±1 and 3±1 cm, and in both cases, a not-significant relationship was reported (P>0.05) with the TS (Figure 2).
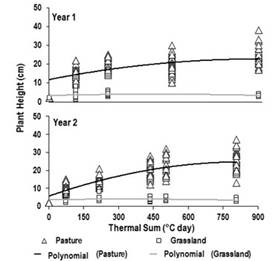
Figure 2: Relationship between the plant height (cm) of the wheatgrass pasture and the grassland and the thermal sum (°C day), respectively, per year
The AAB analysis of the pasture and the grassland detected effects of Forage Resource (FR), Date, and the interactions FR × Date, and FR × Year × Date. In this context, according to the FR × Date interaction, the parameter reported in the pasture in November, December, January, and February (232±33a, 345±27a, 433±37a, and 473±33a kgDM.ha-1) stood out on the forage accumulated by the grassland in similar months (26±46b, 27±46b, 64±46b, and 30±46b kgDM.ha-1). Likewise, the AAB accumulated by the pasture in January and February exceeded the forage harvested in November and December by the same resource, and in the grassland there were no differences (P>0.05) of the parameter between dates.
From the FR × Year × Date interaction, in both years, the AAB of the pasture exceeded the forage accumulated by the grassland in all dates (except the initial date of Year 2), with differences that ranged between 6-9 (November-January) and 15-17 (February) times (Table 1). In addition, in Years 1 and 2, the pasture parameter reported in mid January and February stood out, respectively, in relation to the forage accumulated by this resource in early November (Year 1) and mid October, November, and December (Year 2) (Table 1). On the contrary, in both years, the AAB of the grassland did not differ (P>0.05) between dates.
Table 1: Means (± standard error) of the accumulated aerial biomass (kgDM.ha-1) of the pasture and the grassland by year and cut-off date.
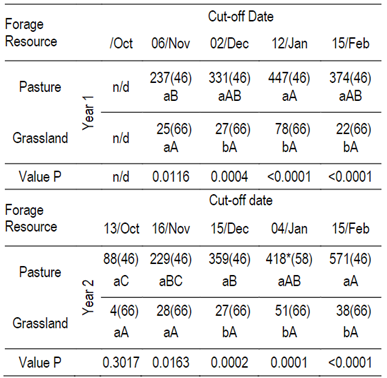
n/d: no data. *: value adjusted for missing data; Different lower and capital case letters indicate, respectively, significant differences (P<0.05) between resources by date, and between dates by resource
3.2 Growth rate, live and dead material, and live aerial biomass
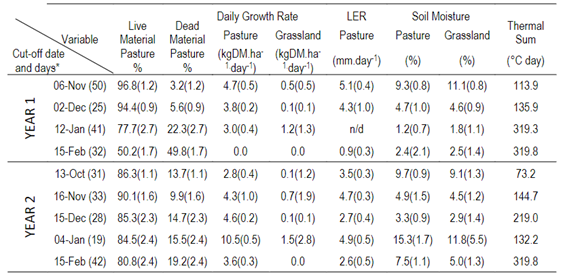
The DGR of the pasture decreased (from 1.2 to >40 times) as the cut-off intervals of Year 1 advanced, and in agreement with the reduction (from 2.0 to 3.9 times) in the SM (Table 2). On the other hand, in the period from mid December to early January of Year 2, the parameter showed an increase (3.2 times) compared to the previous period in accordance with a higher favorable response (4.6 times) in the SM (Table 2).
In turn, in Years 1 and 2, the DGR of the grassland registered smaller oscillations between the cut-off intervals, with a similar maximum value in the early mid December to early mid January period, respectively (Table 2). The LM collected in Year 1 was reduced by half as the cut-off dates advanced, that is, from the beginning of November to mid February, especially in the period between mid January and February (Table 2). In addition, the higher LM values were in agreement with a higher SM. On the other hand, in Year 2 the parameter decreased only 10% with the successive cuts from mid November to mid February. In accordance with the description, the DM harvested on the last date of Year 1 exceeded 2.6 times the senescent material collected on the same date of Year 2 (Table 2).
Table 2: Means (± standard error) of the live and dead material of the pasture by year and cut-off date, daily growth rate of both resources, leaf elongation rate (LER) of the pasture by year, and days between cuts*, soil moisture, and thermal sum.
AAB and LAAB registered dissimilar variations between years according to the increase in TS, with values (mean ± standard error) of AAB previously reported by date (Table 1) and LAAB that ranged between 190±26-230±31 and 359±50 kgDM.ha-1 (Year 1), and between 76±10 and 458±51 kgDM.ha-1 (Year 2). Therefore, the variations of both parameters related to the TS (Figure 3) through the following quadratic polynomial regression models:
Year 1: AAB: y=34.29+1.49x-0.0013x2; R2 =0.63; P<0.0001; LAAB: y=56.96+1.39x-0.0014x2; R2 =0.47; P<0.0001;
Year 2: AAB: y=5.00+1.10x-0.0005x2; R2=0.77; P<0.0001; LAAB: y=6.67+0.94x-0.0005x2; R2=0.65; P<0.0001.
In this context, in Year 1 and Year 2, LAAB was correlated, respectively, with the PH of wheatgrass (r=0.29 and 0.71; P<0.0001 in both cases).
3.3 Leaf elongation rate
The parameter was reduced (from 1.2 to 4.8 times) in correspondence with the decrease in the SM described previously according to the advance of the day between cuts of Year 1. Likewise, the increase (1.8 times) of the LER was consistent with the increasing SM indicated in the cut-off period reported in Year 2 (Table 2).
3.4 Multiple regression analysis
From the multiple analysis model in Year 1, the variables TS and TS2 were selected, respectively, in the DGR, LER, and LM models (Table 3). On the other hand, in Year 2, the variables TS2 and SM, and TS2 and SM2 were selected in the LM and LER model, respectively. On the other hand, in this year only the variable SM 2 was selected in the DGR model of pasture and grassland. On the contrary, in Year 1, no variable could enter the model of this last parameter for the grassland (Table 3).
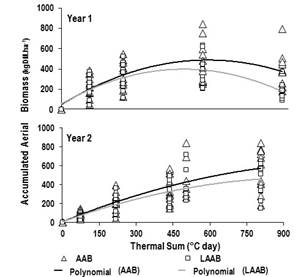
Figure 3: Relationship between the accumulated aerial biomass (AAB) and the live aerial biomass (LAAB) (kgDM.ha-1) of the pasture and the thermal sum (°C day) per year

4. Discussion
4.1 Plant height and aerial biomass
In Years 1 and 2, the PH of the wheatgrass varied according to the changes in the TS, corresponding to the variations in the values of the monthly average temperature informed (Figure 1). Accordingly, the magnitude of change in the PH could be linked to the total length of leaves per tiller correlated with the TS from a previous study reported by Utrilla and others22)(23, and to the elongation of stems associated with the phenological changes described by Utrilla and Chazarreta24 in a cocksfoot (Dactylis glomerata) pasture implanted in the region.
Also, in both years the work showed significant differences in the AAB by date in favor of the pasture with respect to the grassland. This could be related to the greater PH of the implanted wheatgrass compared to the native grasses.
The DM yields of the pasture were lower than those reported for other wheatgrasses in sites with rainfall greater than 210 mm per year. For example, in the Humid Magellan Steppe (HMS) of Santa Cruz, between 700 and 1400 kgDM.ha-1 were reported for intermediate and pubescent wheatgrass8. In the steppe zone of the southern region of Magallanes (Chile), a production between 460 and 2100 kgDM.ha-1 was informed for Crested Wheatgrass (Agropyron cristatum)25. In turn, in grasslands with higher rainfall (415 mm) such as those in New Zealand, pubescent wheatgrass yielded 2400 kgDM.ha-1(10. The forage accumulated by the grassland was lower than that previously reported for the same physiographic environment, with forage biomass values somewhat lower26 and close to 100 kgDM.ha-1(16 in December-January.
4.2 Growth rate, live and dead material, and live aerial biomass
In accordance with the contrasting accumulated biomass between both forage resources, the DGR of the pasture was greater than grassland, with an anticipated daily growth of the 1st resource. This was in agreement with the increase of the DGR in similar wheatgrass implanted in the HMS of the SE of Santa Cruz favored by spring rains7. In turn, this parameter corresponds to the increase in yield correlated with rainfall at a similar time described by White27 for a mixture of intermediate-pubescent wheatgrass implanted in the plains of North America. Also, it is similar to the variations of the DGR associated with the SM of the present study reported preliminarily by Utrilla and others22. In this context, the agreement between these parameters was evident in the interval from mid December to early January of Year 2, and in agreement with the maximum and late daily growth of the grassland in the same period. Regarding this, it is worth mentioning that the water limitations of the soil in January and February informed by Ferrante26 in this type of environment would limit the period of growth of the natural vegetation.
Furthermore, the study reported a contrasting inter-annual response in the variation of the LM and the DM of the pasture according to the advance of the cut-off dates. As a result, the reduction in the LM reported in Year 1 could be explained mainly by the maturity of the leaves and stems of the plants that would increase the cell wall of tissues28. Accordingly, the variation in the LM was associated with the SM reported by Utrilla and others23 and Utrilla and Chazarreta24 in the same pasture and in a pasture mixture of cocksfoot (main), respectively, with respect to the phenological advance. Besides, in this last pasture with even greater water restrictions, the DM increased 3 times in December-March due to the advanced maturity of cocksfoot29. On the contrary, the favorable rainfall reported towards the end of the spring of Year 2 (Figure 1) would allow an active vegetative growth of the pasture and, therefore, the predominance of the LM collected in the first half of the summer.
In this context, the dissimilar evolution of the AAB and LAAB of the pasture in the years evaluated according to the advance of the TS is coherent with a significant reduction of both parameters in the last cut of Year 1. This could be due to the advanced maturity of the pasture that could generate unfavorable consequences in the nutritional quality, and explain a lower productive performance of young and adult ovine previously reported by Utrilla and others30.
4.3 Leaf elongation rate
In the two initial spring cut-off intervals of both years, the parameter would increase due to better thermal conditions. This is in line with the previous literature, that reports an association between the LER of temperate grasses with the TS14 and the average daily temperature11)(12)(31 in the absence of water limitations.
On the other hand, in the successive cut-off periods of the present work, the LER varied mainly according to the SM, which was verified by the correlation between both parameters previously reported by Utrilla and others22)(23. Thus, the effect of the SM on the LER of wheatgrass plants is relevant. It can explain why the water deficit in this type of arid environment reduces leaf elongation32 and generates, among other effects, a lower number of live leaves per tiller22)(33. It can also explain an increase in the senescence processes of leaves and tillers33. Therefore, this effect could be influencing the LER reported in the last cut of interval of both years of this study.
4.4 Multiple regression analysis
In Year 1, the TS was the only variable selected to predict the changes of the DGR (with a linear TS), the LM (with a quadratic TS) and the LER (with a linear TS) of the pasture. In this context, the variation of these in the season would be negatively related to changes in the TS due to the effect of the SM on these parameters. In Year 2 the quadratic TS would explain most of the variation in the VM and the LER, and the negative relationship between them. In this year, it should be noted that the quadratic SM was less influential in predicting changes in the DGR and the LER, although with a reported positive relationship with both. In turn, in Year 2, the linear SM was selected to predict the variation of the LM with a negative relationship with the parameter due to minor changes in it. Finally, a similar response was reported with the DGR of the grassland in relation to the quadratic SM.
5. Conclusions
The work allowed us to demonstrate the significant difference in the accumulated aerial biomass in favor of a wheatgrass pasture with respect to the natural grassland, at this experimental site in the Dry Magellan Steppe ecological area in Southern Patagonia, which shows a noticeable improvement in the forage supply available to the livestock. On the other hand, the phenological advance during the annual cycle of the pasture limits the amount of live forage harvested and alters the foliar elongation of the wheatgrass restricted by the soil moisture deficit reported in the last cut of interval of both years of this study. However, the thermal sum has a greater effect on the prediction of changes in the parameters of interest with respect to soil moisture, which should be considered when developing future management strategies in this type of pasture.

