


 Inglés (pdf)
 Articulo en XML
 Referencias del artículo
 Curriculum ScienTI
 Permalink
1. Introduction
Honey is understood as the natural sweet substance produced by Apis mellifera bees from the nectar of plants, from secretions of living parts of these or from excretions of plant sucking insects that remain on living parts of them and that bees collect, transform and combine with specific substances of their own, and deposit, dehydrate, store and leave in the honeycomb to mature and age1. The main compounds of honey are carbohydrates, proteins, aminoacids, macro-minerals and trace elements2, and others particular compounds with antioxidant properties3. The components responsible for the redox properties of honey are probably phenolic acids, flavonoids, vitamins and enzymes, as well as a small amount of trace elements content, particularly copper and iron4. Previous works have shown that honey can improve the defense system against oxidative stress5. Phenolic compounds, such as aromatic acids and flavonoids present in plants, are considered the cause of the antioxidant effect and the anti-radical capacity of honey6. A straight relation between the botanical origin and the antioxidant properties of honey is demonstrated, and this may differentiate honeys from different regions in the world7. Honey production in Uruguay has had a sustained growth since last years, with 3,000 beekeepers who own 500,000 colonies. In spite of this little volume, 90% of this production is exported8)(9. This activity has a social and economic role besides the essential role of bees in biodiversity and agricultural production. The quality of Uruguayan honey is in accordance with the requirements of an increasingly demanding national and international market10. Although local honey comfortably meets, in the vast majority of cases, with international quality requirements, unfortunately, all of the production is exported in bulk, being enough that it complies with certain physicochemical conditions and that it does not exceed established minimum levels of contamination11. With the increase in the intensification of land use, especially in the area dedicated to monocultures and industrialization, a latent risk for the safety of honey appears8. Furthermore, the country has developed a National System of Protected Areas (SNAP in Spanish) with important richness in biodiversity where there ishoney production in natural conditions. For this reason, it is an interesting opportunity as well as extremely important to characterize honey from this protected regions, since the country could be located as an alternative source of organic honey and generate new strategies for the valorization of Uruguayan honey. The limited volume to be exported could be counter with a high quality associated to a natural product, and this would be the future opportunity to market honey with its own biological and quality traits well identified12. Based on this background and the importance of determining parameters that allow qualifying and differentiating some honey produced in Uruguay, this paper aimed to characterize the Uruguayan honey produced in different phytogeographical regions by the content in trace elements (Cu, Fe, Mn, Mo, Zn, I, Se), the total polyphenols and the antioxidant capacity related to the palynological profile.
2. Materials and methods
2.1 Sample honey
Honey samples were collected from four different regions of Uruguay in two seasons, spring-summer (S-S) and summer-autumn (S-A), with a difference of three months between samples. Three of them correspond to protected areas of the National System of Protected Areas of Uruguay. The regions were Quebrada de los Cuervos (Q; located in the east), Valle del Lunarejo (VL, located in the north), and Esteros de Farrapos (EF, located in thewest). A fourth region selected was Los Cerrillos (C, located in the south), associated with human activities such as horticulture and agriculture, and closer to populated centers. Two months before sampling beeswax foundations were placed in each hive. This ensures that the honey samples correspond to the study season. The samples were obtained by cutting two pieces of honeycomb of approximately 3 cm wide by 5 cm long, with 100% operculated on both sides for each hive. Ten samples were collected from each region (Q, VL, EF, C) and in each season (S-S and S-A). The samples were placed in sterile polypropylene bottles and subsequently transported to the laboratory with refrigerated conditions, then stocked at -20 °C until analysis. For region Q, due to low production in the beekeeper, 7 and 9 samples per season were obtained. Also, in EF region only a season (Spring-Summer) was sampled. The total number of samples obtained was 66.
2.2 Palynological analysis
To determine the botanical origin of honey, 20 g of each sample were diluted with distilled water13. After centrifugation the pellet was quantitatively analyzed by the pollen grains in each sample of honey, using a 400x magnification microscope. Six-hundred pollen grains were counted to determine the abundance of each family, genus or species depending on the capacity of identification14. Also, the presence of honey dew elements (HDE) was determined, indicative of an extra-floral origin of honey. The melissopalynology process without acetolysis was performed, based in the reference collection13. Analysis was performed in the Palynological Laboratory of the Faculty of Sciences, University of the Republic, Montevideo, Uruguay.
2.3 Determination of trace elements
The honey samples were prepared as follows. Briefly, 2 g of honey were solubilized in acid solution, with ultrapure HNO3 (1M, 65% Merck, ppa, distilled by sub boiling) and HCl (6M, Merck, ACS ppa) in Erlen with steam trap device, in hot plate, for 1 hour, and then taken to volume with distilled H2O, less than 18 MΩ-cm of resistivity, in volumetric flask. The content of Iron (Fe), Zinc (Zn), Copper (Cu), Manganese (Mn), Molybdenum (Mo) and Selenium (Se) in honey was quantified by Atomic Absorption Spectrometer, AAS (Perkin Elmer, A Analyst 300, USA), equipped with Deuterium lamp as background corrector, with flame (air-acetylene; 8.0 l/min and 1.4 l/min) for Fe, Zn, Cu, Mn. For Mo and Se, it was quantified by AAS with graphite furnace (HG-800, Perkin Elmer, USA) and auto-sampler (AS 800, Perkin Elmer, USA). Suitable standards were used for each analyte. Standard single element solutions of Fe, Zn, Cu, Mn, Mo and Se containing 1000 mg/l (Perkin Elmer or Fluka) and diluted with deionized H2O containing 2.5% ultrapure HNO3, according to the expected values of each analyte in the sample of honey, were used. For Fe, Cl2Ca, PPA to eliminate interference, and for Se, a chemical matrix modifier based on Palladium (500 µg/ml) and NO3Mg were used to avoid interference with the matrix. The content of iodine (I) was determined as iodide with appropriate ionic chromatography and standards of iodine. Briefly, I was measured in the blank, honey samples, and calibration curve solutions using ion exchange chromatography (Dionex Integrion HPIC system, Thermo Fisher Scientific, USA)15. The identification of I was based on the retention time, and quantification was performed by integrating the peak area. The sample peaks of each sample were compared to those produced by the calibration solution. Detection limit was 20 µg/l (EPA, 2016; calculated as: 2.8 × standard deviations of blanks + average of 10 blanks).
2.4 Determination of total polyphenols and antioxidant capacity
The total phenolic content (TPC) of honey was determined by using Folin-Ciocalteu reagent, based on electron transfer and providing a reduction capacity, which is normally expressed as phenolic content16. The method consists in a reduction/oxidation reaction (redox) between polyphenols present in samples of honey and Folin-Ciocalteu reagent. A quantity of 0.1 ml of aqueous extract of honey was added with 0.6 ml of sodium carbonate 20%. After 2 minutes, 0.15 ml of Folin-Ciocalteu diluted 1/6 with distilled water (2N, Folin & Ciocalteu’s phenol reagent working solution, Sigma Diagnostics) was added. A standard curve was also prepared with gallic acid (Gallic acid monohydrate 98+%, reagent grade, Sigma-Aldrich), with concentrations of 0 to 0.30 mg/l, and were treated as the samples. All solutions were incubated at room temperature, in darkness for 30 minutes. After that, the absorbanceat 750 nm was measured in a spectrophotometer (Spectronic Genesys 6, Thermo, USA). The TPC was expressed as mg of gallic acid equivalent by 100 g of raw honey (mg GAEq/100g honey). The antioxidant activity was determined by free radical elimination activity using 2,2-diphenyl-1-picrylhidrazyl (DPPH). A honey solution was prepared containing 0.04 g of honey in 1 ml of methanol and homogenizing the sample completely and carefully, and making the dilutions with methanol until the desired concentration was obtained, between 20-40 mg/ml, in a final volume of 1 ml. Initial absorbance of DPPH solution (60 µM in methanol) and absorbance of samples with honey and DPPH were measured at 520 nm (Spectronic Genesys 6, Thermo, USA), and inhibition % was calculated. The capacity of honey to reduce the radical DPPH can be expressed as Trolox equivalent (TE). For that, a calibration curve (0-50 µM) was prepared using the Trolox reagent (6-hydroxi-2,5,7,8-tetrametylchromane-2-carboxilic acid), absorbance was measured, and inhibition % was calculated. A graph was made with the % inhibition versus the TE concentration and the equation was calculated. Calculation was performed for each sample of honey and the results of antioxidant capacity were expressed in µmoles TE/100 g of honey.
2.5 Statistical and chemometric analysis
From each region (C; EF; Q; VL) a number of 7 to 10 hives (repetition) were used. In each one of the seasons (Spring-Summer or Summer-Autumn) the same hives were sampled. For each variable measured, trace elements, TPC and TEAC, the results were expressed as mean ± standard error of the mean (SEM). Data were analyzed by ANOVA, with the GLM procedure, with the region and season as main effects. When differences were statistically significant, means were compared using the Tukey-Kramer Test with a p value <0.05. Also, an ANOVA one way and a post hoc a Tukey-Kramer Test (p<0.05) were performed for all regions and seasons, because in the EF region only one season was sampled. The statistical analysis of the data was carried out through the NCSS software17. For the trace elements results a chemometric method was applied, such as exploratory data analysis, to grouping minerals in the different honeys, by HPA and PCA. These two types of chemometric techniques, hierarchical cluster analysis (HCA) and principal component analysis (PCA), were performed to explore the relationships that may exist between trace elements and samples18.
3. Results
3.1 Palynological analysis
Through palynological analysis it was possible to determine different families, genus or species of pollen types. The results are presented in Table 1 expressed as a percentage and frequency of classes.The region C in season S-A was characterized by monofloral honeys of Lotus sp. (72%), observing a total of 14 pollen types. For the same region, in the season S-S, the honeys were multifloral, presenting 24 types of pollens. The pollens detected were from Xylosma tweedianum (14.1%), Salix sp. (14%), Lotus sp. (11.5%) and Eucalyptus sp. (10.3%), as the most important ones. In honeys of the Q region in the S-A season 14 types of pollen were found, and in the S-S season there were 13 types of pollen.
In the S-A season 18 types of pollen were detected, with the highest percentage being from Schinus longifolius (31.8%), followed by Baccharis articulata (24%), Baccharis spp. (24%), and Tripodanthus acutifolius (22.4%). For the S-S season 9 types of pollen were detected, principally pollens of Myrcianthes cisplatensis (38.6%), Lithraea brasiliensis (32.4%), and Gleditsia triacanthos (12.5%). The honeys of the EF region were also characterized by being multifloral honeys, but as in the Q and VL region, they could be considered monofloral honeys because there are no reports for this classification for this type of species, being pollens of Myrcianthes cisplatensis (34.8%), Salix sp. (34.8%), Eucalyptus sp. (30.7%), Schinus longifolius (26.2%), Parkinsonia aculeata (19.5%), Trifolium pratense (16.9%). A total of 14 types of pollen were observed in this region.
3.2 Content of trace elements in honey
Contents of Cu, I, Mo, Mn, Zn and Se were significantly different between regions (p<0.05). However, no difference was found for Fe between regions (Table 2), althoughsignificant differences between seasons were observed (Table 2).
The average honeys' Cu content from the four regions was between 1.45 and 0.19 mk/kg of honey. The highest values were found in the honeys of region C in the S-S season. Like Cu, Mn contents were higher in honeys from region C in the S-S season (5.71 mg/kg). The honeys from the Q region in the S-S season had higher Mo content (1.17 mg/kg). For I, significant differences were found between honey in the EF region with respect to VL (p<0.05) (Table 2). The Se content was higher in the honeys of the Q region in the S-A season. Such amount present in the honey samples from the four regions is between 0.12-0.52 mg/kg of honey.
The result of the cluster analysis (dendrogram) is reported in Figure 1. The y axis depicts the production site discriminated by season, while the x axis indicates the calculated distances among sampling sites.
A principal component analysis (PCA) was also carried out to study the influence of trace elements, the total polyphenols and the antioxidant capacity with respect to the regions and seasons studied (Figure 2). The main components 1 and 2 (CP1 and CP2) explained 42.9% and 23.1% of the variability between samples, respectively.
Table 1: Pollen content expressed in percentage and frequency of classes: predominant (D), secondary (S), important minor (I) and minor pollen (M)in honeys' protected region (Q, EF, VL) and not protected region (C) in two harvest seasons (S-S or S-A) in Uruguay
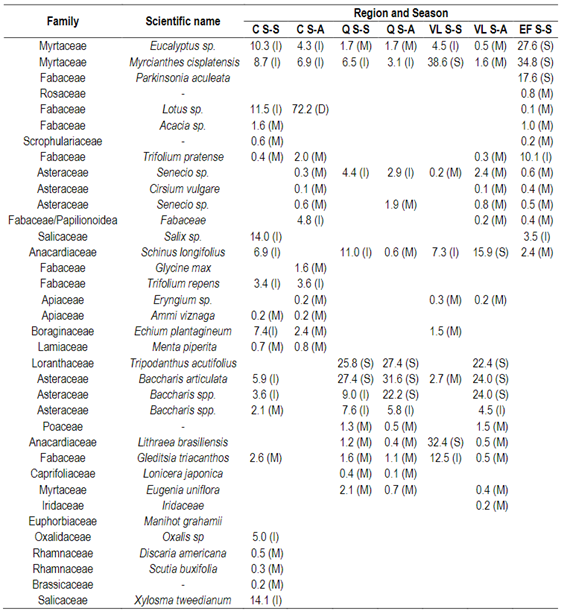
Data represents percentage and frequency of pollen classes pollen in honey (n = 7-10) for each region (C, Q, VL, EF) by season (S-S, S-A). Honey in the EF region was collected only in one season. D = dominant pollen (>45%), S = secondary pollen (16-45%), I = important minor pollen (3-15%), M = minor pollen (<3%).
Table 2: Content of trace elements (mg/kg raw honey) in honeys’ protected region (Quebrada de los Cuervos, Q; Estero de Farrapos, EF; Valle del Lunarejo, VL) and not protected region (Los Cerrillos, C) in two harvest seasons (S-S or S-A) in Uruguay
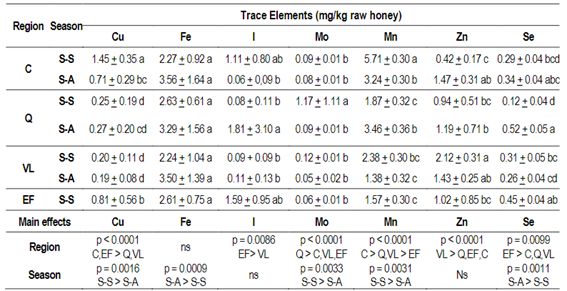
Data represents mean ± SEM (n = 7-10) for each region (C, Q, VL, EF) by season (S-S, S-A). Data were analyzed by ANOVA GLM, considering as main effects the region and the season and post hoc Tukey-Kramer´s Test (p<0.05). As in the EF region honey was collected only in one season, all honeys were also analyzed with a one-way ANOVA and post hoc Tukey-Kramer's Test (p <0.05). Different letters indicate significant differences (p <0.05) between region and seasons. ns: not significant.
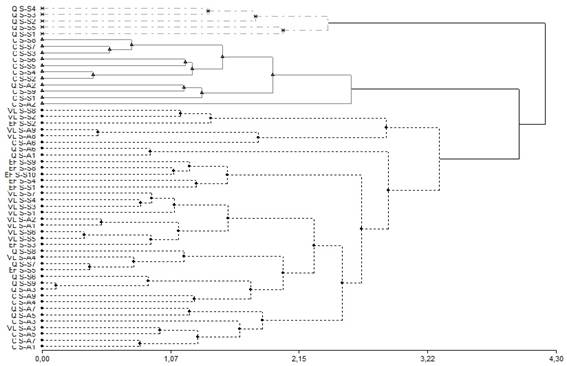
Figure 1: Dendrogram of classification of the types of honey studied according to the content of trace elements by region and season. Euclidean distance and ward aggregation method were used. C: Los Cerrillos; Q: Quebrada de los Cuervos; EF: Esteros de Farrapos; VL: Valle del Lunarejo; S-S: spring-summer; S-A: summer-autumn
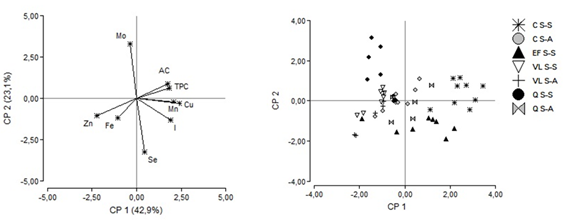
Figure 2: Analysis of main components (PCA) of the types of honey studied according to the content of trace elements, total polyphenols and antioxidant capacity by region and season. (Left: PCA distribution of variables; right: PCA distribution of honey samples). C: Los Cerrillos; Q: Quebrada de los Cuervos; EF: Esteros de Farrapos; VL: Valle del Lunarejo;S-S: spring-summer; S-A: summer-autumn
3.3 Total polyphenols
The results for total polyphenols show a variation between 35 to 66 mg GAEq/100g (Figure 3).
The region with the highest value was C (66.44 mg GAEq/100g), being significantly different from the values obtained for regions Q (50.417 mg GAEq/100g), EF (36.876 mg GAEq/100g), and VL (35.526 mg GAEq/100g).
When comparing honeys from the S-A season with respect to S-S season for the same region, no significant differences were found (Figure 3).
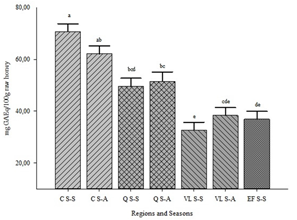
Figure 3: Total polyphenol content (TPC; mg GAEq/100g) by region and season. The values represent the mean ± SEM (n=7-10). Different letters indicate significant differences between regions and seasons (p<0.05).C: Los Cerrillos; Q: Quebrada de los Cuervos; EF: Esteros de Farrapos; VL: Valle del Lunarejo; S-S: spring-summer; S-A: summer-autumn
3.4 Antioxidant capacity
The results can be seen in Figure 4. The honeys from the C region in season S-S registered greater antioxidant capacity (33274 µmoles TE/100g) compared to the same region in season S-A (11802 µmoles TE/100g). No significant differences were observed for the other regions and between seasons (Figure 4).
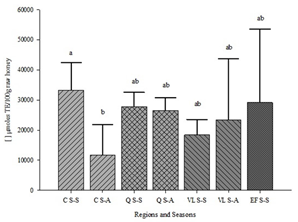
Figure 4: Antioxidant capacity (µmoles TE/100g honey) by region and season. The values represent the mean ± SEM (n=7-10). Different letters indicate significant differences between regions and seasons (p<0.05).C: Los Cerrillos; Q: Quebrada de los Cuervos; EF: Esteros de Farrapos; VL: Valle del Lunarejo; S-S: spring-summer; S-A: summer-autumn
4. Discussion
4.1 Palynological analysis
Both seasons were characterized by multifloral honeys considering the classification criteria described above. Honeys with pollen contents of native species, such as Baccharis articulata (27.4%-31.6%), Baccharis spp. (25.9%), Tripo-danthus acutifolius (25.8%-27.4%), were found.
In both seasons, the botanical origin was similar, except for the presence of Senecio sp. in season S-A. Likewise, in the S-S season, a higher percentage of Schinus longifolius (12.4%) was observed compared to the S-A season (1.1%). Honeys from the VL region were characterized as multifloral honeys in both seasons.
Palynological analysis of honey shows that there are regions with similarities in species plants in both seasons (Q region), while for the southeast region (C), there is a difference in honey botanical origin mainly due to the presence of improved crops (legumes particularly) and meadows with the presence of introduced species where the flowering period is shorter (Fabaceae family particularly).
The botanical origin of the honeys turned out to be different according to the geographical site and the season. Some species, genres or botanical families were only found in a particular region. Indeed, Glycine max, Scutia buxifolia, Ammi viznaga, Trifolium repens, Xylosoma twedianum, Oxalis sp., Discaria americana and Raphanus sativus were found in honeys from C region. In honeys of the Q region, the presence of Lonicera Japónica stands out. Honeys from the VL region presented Manihot grahammi and Iridaceae species in their pollen content. The presence of Parkinsonia aculeata and Rosaceae stands out in honeys from the EF region. Regions Q and VL shared pollen species such as Tripodanthus acutipolius, Lithraea brasiliensis and Eugenia uniflora. Finally, through the palynological analysis, differences in the pollen content were observed in the four regions studied as well as for each season.
4.2 Content of trace elements in honey
Honeys from region C had higher contents of Cu and Mn. This could be explained because the C region is close to areas associated with horticultural and agricultural activity, with applications of cupric inorganic products for the control of plant diseases and fertilizer applications with Mn. However, the values found per season had no significant differences.
Cu values in honeys from the four regions are within those reported by other authors, with ranges between 0.228 and 3.317 mg/kg19)(20. For multifloral honeys in Argentina, average values of 0.29 mg/kg with a range of 0.09 to 1.19 mg/kg have been found21.
The Mn content is within the ranges cited in the literature (0.14 and 3.13 mg/kg)21. The Zn content in the VL region honeys was higher with respect to Q, EF and C regions, coinciding with the lowest Cu values found in this region. High concentrations of Zn in the soil solution depress the absorption of Cu by the roots and may exacerbate Cu deficiency22.
The Mo content was higher in the honeys of the Q region, being significantly different from the honeys of the other regions (C, VL and EF). This could be explained by the types of soil associated with the geological formation of the region, where calcareous soils predominate. The availability of Mo for the plant, unlike other micronutrients, increases with the decrease in soil acidity22. The differences found between the honeys of the EF and VL regions for iodine could be due to different factors and several approaches can be used for the analysis of trace element data23)(24.
The variation in the content of Se may be due to the flower source (botanical origin) and the region (geographical origin) where they are obtained, especially due to the type of soil.
Hierarchical cluster analysis was applied to the data set (66 samples and 7 trace elements measured) to classify the distribution of honey samples according to their production areas21. Based on the different trace elements measured, associated with each region and season, regions with similar characteristics were grouping. There are three very different large groups or cluster. Onecluster is formed by the C region for the S-S season (cluster A), and another cluster is formed by the Q region for the S-S (cluster B). A third group is a cluster integrated by the regions VL, in both seasons, the region EF for the season S-S, and the regions Q and C for the season S-A. The explanation for this grouping based in the trace elements was given by geology, and by the biodiversity and the natural ecosystem25.
According to PCA (Figure 2), it is possible to associate a particular region according to a trace element. The EF region is associated with the I content, while Zn is associated with the VL region. The Q region is characterized by higher Mo values and despite there being no significant differences between regions for Fe, it can be seen that in this region the values obtained from Fe are associated with this same region.
Through this study we can emphasize that the content of trace elements of the honeys of Uruguay vary according to each geographical site and each season of the year, allowing the classification of the honeys by their geographical origin. From an applied point of view, the southern region C would produce honey with a higher content of Cu, Mn, and I in the season S-S. For protected areas, the VL region in the S-S season would produce honey with a higher Zn content, and the Q region in the S-S season would produce honey with a higher Mo content.
4.3 Total polyphenols
The presence of legumes from the Fabaceas family, such as Lotus in C region, may be the reason for the high level of total polyphenols found in honey.
In other studies compounds with phenolic bioactivity were found in Lotus corniculatus, of the quercetin and kaempferol type with antioxidant activity in humans, which indicates that more studies should be directed to quantify and identify these compounds in honey because of their importance in health26.
They are probably not the same compounds with phenolic activity in all the regions in which the PTCs were measured, since other phenolic compounds could be present in the flora that predominates in those regions, and that still being of the flavonoid family have another chemical structure27)(28.
4.4 Antioxidant capacity
The Antioxidant Capacity could be positively associated with the greater presence of trace elements such as Cu, Mn, I, and a higher Total Polyphenol content.
Taken together, Total Polyphenols Content and Antioxidant Capacity for honey from the southern region (C) in the S-S season were higher related to the VL and EF honeys, which could be positively associated with the greater presence of trace elements such as Cu, Mn, I and also with a higher content of legumes from the Fabaceae family29.
5. Conclusions
This work allows us to affirm that honey can be differentiated by its micronutrient content associated with the total polyphenol content and the antioxidant activity for different regions, given by the floral species present in the region and the type of soil. Through palynological analysis, differences in pollen content could be observed in the four regions studied, as well as for each season. The botanical origin of the honeys turned out to be different according to the geographical location and the season of the year. Some species, genus or botanical families were only found in a particular region. Region C would produce honeys with a higher content of Cu, Mn, I in the S-S season. The VL region in the S-S season would produce honeys with a higher Zn content, and the Q region in the S-S season would produce honeys with a higher Mo content. The honeys from the C region in the S-S season presented higher values of Total Polyphenols and Antioxidant Capacity, compared to the honeys from VL and EF, probably due to a higher content of legumes and/or trace elements such as Cu, Mn, and I.

