


 Inglés (pdf)
 Articulo en XML
 Referencias del artículo

 Permalink
1. Introduction
In the conceptual framework of the theory of the firm and the theory of agricultural economy, a series of variables representative of profitability and others acting as its determinants are proposed1. In this framework, the analysis of corporate profitability based on accounting data is a consolidated research line. Many studies point to the relationship between size and profitability, business failure, or the impact of balance sheet results on the value of shares, generally targeting the industrial or service sector, but there are relatively few studies focusing on the agricultural sector.
The literature collects various ways of measuring and explaining the profitability contained in certain tensions that are not entirely resolved. One of these cases is the alternative use of ROA* and ROE**, two well-known indicators, apparently not contradictory, but scarcely questioned in their descriptive potential. The ROA is obtained by dividing the Economic Result (Revenue minus Costs) by the Total Assets (set of the company’s assets and rights) and measures the profit-generating power of the invested asset. On the other hand, the ROE divides the Economic Result (net of costs for the use of external capital) by the Net Equity (Assets minus Liabilities), aiming to measure the profit-generating power of equity or shareholding. Both indicators result in an annual rate. The calculation of the economic result of the firm adds to this problem. Indeed, there is no agreement in the literature on how to measure the absolute result that constitutes the numerator and the basis for calculating the two mentioned ratios. Some studies are inclined by the final net result, while others by an intermediate result -called "operating"- without taxes, depreciation, rent and interest. As an example, if a firm makes a profit (Revenue minus Costs Considered) of USD 100,000 with land, animals and other assets of USD 1,000,000, the ROA will be 10% per year.
On the other hand, the longitudinal cluster methodology has already been used2 to describe the evolution of the corporate results of a group of agricultural companies in Uruguay for the period 2009-2017, but the results were not compared with different ways of measuring profitability.
This study is motivated, then, by three aspects:
Contributing to knowledge about the ways of measuring companies’ profitability: using the operating result or the net financial result, minus the costs for leasing, depreciation, interest and taxes.
Comparing the results of the longitudinal cluster study using different models for calculating ROA.
Contributing to the knowledge of the economic performance of companies in the agricultural sector and its evolutionary dynamics in recent years.
2. Theoretical framework and background
2.1 Indicators of corporate profitability
The field of financial indicators is within the framework of the theory of the firm, which tries to explain and predict business behavior. Depending on the emphasis on each explanatory factor, several derived theories emerged: economic, behavioral, contractual and others, each group supported by its empirical evidence. All these theories are taken into account to determine the explanatory variables frequently used in business performance research3)(4.
Within the firm theories, and particularly the traditional neoclassical economic theory, profitability is one of the most analyzed elements. The approach and variables considered as determinants will depend on the type of theory on which they are based. For example, economic theory will focus on profitability represented by indicators such as ROA or ROE1)(3)(5)(6)(7)(8.
In other cases, in parallel with profitability, the level of indebtedness is also analyzed. The company’s behavior towards the form of financing with third-party funds is explained by the agency's theory, in which tensions between managers and owners can generate cost overruns due to debts, impairments in the reinvestment of profits, loss of business opportunities and other problems that attack profitability in the medium and long term9.
When profitability is focused on innovation, potential of human resources or capital, theories called Resourced Based View are referenced. This purely qualitative approach10)(11 affirms that competitive advantages and better performance result from the combination of resources and capabilities available to the company, for example, quantity and quality of its employees6)(12.
Instead, economic theories focus on the monetary values of certain equity items such as assets or debts, or in other cases, on the monetary values of sales revenue or cost structures.
In terms of indicators, to work with data from the annual financial statements, the Dupont system is widely used, where the ratios Return On Assets (ROA) and Return On Equity (ROE) are calculated for each company. To standardize the results and make them comparable, it is common to previously use EBITDA (Earnings Before Interest Taxes Depreciation and Amortization) as a measure of the result in monetary units, instead of the final result13)(14.
The use of EBITDA aims to work with the operating result of the company, without considering its tax situation -clearly dependent on the country of residence- nor the form of financing, often also dependent on the country and the vertical integration of the meso-economic chains in which the company is located. On several occasions, companies are part of economic groups that cover the primary, secondary and financial sectors. This study finds its core problem precisely on this point or tension. The literature presents an ambiguous treatment regarding this dichotomy and it is difficult to find backgrounds that pose the problem as a dilemma.
Methodologically, profitability is the most widely used indicator to measure business performance. Moreover, studies based on accounting results or cost structure are scarce. Limitations in the use of accounting bases, usually highlighted by the literature, are: the impact of the accounting practices of the company on the variables, the different international accounting standards and the risk of manipulation that owners can perform in the accounting data. In the case of this study, given Uruguayan legal regulations, the database is composed of audited Financial Statements and supported by an affidavit by the owners, which provides a certainty framework15)(16.
Several similar studies have been carried out in many countries, but, in general, they deal with the industrial and commercial sectors. In any case, they constitute a starting point as long as they identify variables with an impact on profitability, such as indebtedness, number of employees, size of assets or level of activity, which will be used in this case17)(18)(19)(20)(21)(22.
The best-known explanatory variables are the size given by the assets, the revenue or the number of employees. The debt-to-investment ratio, age of the firm, inventory levels, ratio of fixed assets to total assets and capital turnover are also analyzed. But there is no paradigm on the impact of these factors on the profitability of the company. The ROA is the dependent variable most used to measure profitability and, therefore, the variable that will be considered as the central axis of this discussion, but that does not imply that there is agreement on the causal relationships with the independent variables. It is also considered that it involves and combines various aspects of the company's economy, such as assets, revenues, costs and results1)(23)(24)(25)(26)(27.
Therefore, the ways of measuring the absolute economic result and also the relative result are very diverse in the literature. Sometimes the Net Result, derived from the Result Statement, is used; in others, the EBITDA, and in others certain intermediate results. In terms of relative profitability, the ROA is mostly used, but in other circumstances, the ROE is used.
2.2 Conceptual framework for measuring profitability
Taking into account this background, this study will consider the following definitions:
Operating ROA 1: profit before taxes***, interest and leases relative to total assets. Hereinafter, ROA 1.
Operating ROA 2: profit before taxes and interest relative to total assets. Hereinafter, ROA 2.
Financial ROA: profit before taxes relative to total assets. Hereinafter, ROA 3.
The value of the total of Assets (common denominator in the calculation of the three analyzed profitability ratios) is taken from the balance sheet presented in the declaration for the payment of taxes on Income on Economic Activities and Net Worth, form 1006 (version 3)28, which constitutes the database used in this paper.
Variables are constructed in this way:
- ROA 1: Profit Before Taxes, Interest and Leases: Income minus Total Costs (not including payments for the use of external capital, interest on credits and leases) relative to the total Assets of the Statement of Equity of each company. For the economic approach of the agricultural literature, under conditions of complete information, the value of the leased assets should be added to the total assets of the balance sheet, since this approach evaluates the profitability of the resources used, regardless of their ownership. As such information is not available, ROA 1 overstates -in this perspective- the measure of economic profitability. For the accounting approach, this is equivalent to considering as its own assets land that is not owned by the company; a contradiction to the definition of assets.
- ROA 2: Income Before Taxes and Interest: Income minus Total Costs (payments for the use of leased assets are included, interest payments are not included) relative to total Assets. Given the information available, this way of estimating economic profitability can be considered balanced.
- ROA 3: Profit Before Tax: Income minus Total Costs (including all costs but Income Tax on Economic Activities and Net Worth) relative to total Assets in the Statement of Position. This way of measuring profitability focuses on the surplus appropriated by the business owner and, secondly, by the State, in taxes.
In all cases, the Income is made up of the genuine income from sales, plus -in the case of livestock companies- the Gross Agricultural Product, which is obtained, for each unit of analysis, directly as base data, since it is declared by each taxpayer.
Conceptually, the financial ROA (ROA 3) represents the final economic wealth appropriated by the producer, either in the form of cash or goods (assets), or reduction of their liabilities. In the case of companies that do not own the land, but lease it, as has happened with Argentine firms in Uruguay, the ROA may be higher than that of a land-owner company, since it is calculated exclusively based on movable assets (animals, seeds, working capital). That does not necessarily mean that the result is inaccurate, since it is the economic reality: they are more financially profitable since their fixed investment is lower. The exception would be a very high lease due to high land demand29.
ROA 1 (operating) focuses on a more primitive, primary or operating profitability. It measures the result of agricultural operations. It is not an inadequate indicator in itself, but it is partial. The problem arises when, by not considering leasing, the ROA of the firms that lease is distorted, as in the case of the mentioned Argentine investments.
ROA 2 (operating) is an intermediate state between operating ROA 1 and financial ROA. Lease costs have been included, but the interest payment associated with the use of external capital remains in the surplus.
These operating (1 and 2) and financial ROA measurements are complementary if analyzed together, they can indicate where the firm's weaknesses and strengths are. A company can be profitable from an operating point of view (positive operating ROA), but with a financial situation that makes its final result negative; for example, evaluated through ROE. The interpretation of such a situation is very delicate. It is not possible to affirm that the company is operationally profitable without considering that its operating profitability is perhaps too low to withstand the financial constraints.
As for the ROA or the ROE option, if the intention is to link size with profitability, ROA is an ideal indicator -or more consistent-, since it is determined according to the asset, which is one of the most reliable indicators of size. Note that the asset includes cash, rights, goods, equipment and facilities,but also intangible assets, such as brand equity. On the other hand, ROE presents a more complex view, which is not always easy to interpret. This index is measured based on wealth. If a firm is very large, but simultaneously presents a high level of indebtedness, its equity will be small and will not represent its economic relevance, therefore not being a good indicator of size. Business profitability understood as the profitability of the company as a whole must be measured in regard to its assets and not on equity. ROE is designed to assess shareholder profitability -which is ultimately an external investor-, but it is not an indicator to analyze business performance in isolation. In general, its use is widespread in countries with developed and long-standing stock exchanges, a case that does not correspond to Uruguay, where these forms of financing are still incipient.
As for the calculation basis for the indicators in general terms, EBITDA or the net result can be used. EBITDA belongs to the group of indicators called financial. It is considered a good indicator of operating efficiency, but also incomplete, since it does not measure the ability to obtain good sources of financing and good tax structures, elements that affect the competitiveness of the company1.
EBITDA could be used to compare companies and visualize their problem areas (commercial, operational, logistics), at least comparatively, or the advantages with respect to other companies in their sector, but it should not be used to measure and explain economic performance. Its use spread in the United States in the 1990s among financial analysts because there was a need to show positive results in companies that were growing based on debt, since it was an intense period in terms of mergers and acquisitions. It is considered a highly pernicious indicator and its use is correlated with deviations in accounting standards30.
According to Bejar-León and Jijón-Gordillo31, EBITDA is an inadvisable ratio, since it ignores the cost of depreciation and was used to show partial results; so it is a ratio criticized not only for its bias but for the opportunism of its practical implications.
In summary, the use of ROA based on business result is postulated, instead of ROE, due to its consistency with the measure of business size, given by assets. It is suggested to compare the results of the study of 713 Uruguayan agricultural companies according to their size and profitability, measured by the operating ROA and the financial ROA, in order to obtain a conclusion based on empirical evidence. In this way, it is expected to observe whether there are noticeable differences in the evolution of profitability measured by one or the other indicator.
3. Methodology
The longitudinal cluster method was used for the purpose of discussing the relevance of the operating ROA and the financial ROA in measuring the evolution of the profitability of agricultural companies and finding a group structure of companies that may reflect common characteristics in terms of dynamics during the period, i. e. between companies in the same cluster/group.
It is a multivariate descriptive statistics tool that is framed within machine learning techniques as an unsupervised classification method32 to explore groups within a dataset. In most studies, the groups/clusters/conglomerates are estimated, maximizing the similarity within the groups and minimizing the similarity between the groups, as will be done in the present study. However, no agreed criterion determines which grouping is best. While there are different criteria based on cut-off thresholds for certain test statisticians that guide the choice, the study purpose must also be taken into account; in this way, the optimal statistical partition may not coincide with the chosen one. This happens when the optimal is not the best from the point of view of the problem posed, which in this case is the ability to differentiate groups of companies with similar ROA trajectories.
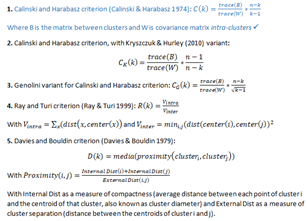
Non-parametric stop criteria that consider the decomposition of the intra- and intergroup variance and that guide the choice of the cluster number (k), where n is the number of observations/firms:
This methodology was carried out with the software R33, through the kml3d34 library, which consists of an implementation of the k-means method, specifically designed to group joint trajectories (longitudinal data in several variable trajectories). The K-means clustering method is a non-hierarchical method for grouping objects, partitioning the dataset into K clusters/groups that are disjoint, and together they represent all observations, meaning that no observation can belong to more than one cluster.
In this particular study, since data are longitudinal (observations recorded of the same individuals, in this case companies, over time), for the clustering/grouping of the companies a variant of the k-means clustering technique called KML is used, developed by Genolini and Falissard35 and Genolini and others36. K-means is an algorithm that belongs to the EM class, i. e. expectation-maximization37. These algorithms (EM) work as follows: to begin, each observation is assigned to a group; then, the optimal grouping is reached by alternating two phases: in the expectation phase, the centers of the different groups (known as seeds) are calculated, and in the maximization phase each observation is assigned to its "closest group". This algorithm is repeated iteratively alternating the two phases until there are no more changes in the groups, i. e. the algorithm converges36.
In order to compare the different trajectories of the evolution of profitability -understanding by trajectory the different values that this indicator takes over the 8-year analysis for each company-, it is decided to estimate the clusters using the three different ways of measuring the ROA indicated above and observe the results, therefore:
clusters are determined only according to the evolution of ROA 1 of each company;
then, depending on the ROA 2 variable;
finally, considering the ROA 3.
However, despite being three different estimates, there is a small set of companies that are always notoriously separated from the rest by the ROA outliers, not managing to obtain a balanced and profitable partition, and losing quality in the characterization of the core of companies. In an attempt to solve this problem, the ROA range of the analysis companies was limited between -100 and 100%. Companies that do not meet this condition are studied separately, using another methodological approach.
Measuring profitability through the ROE indicator (income minus Total Costs -before income tax-relative to equity -total assets of the situation statement minus liabilities-) focuses on the surplus appropriated by the business owner and, secondly, the State, as taxes, regarding the personal capital invested. It is an indicator that firms with a high level of indebtedness and positive profitability will result in very high values, which should be interpreted with caution. This is why the ROE was discarded as a way of measuring the profitability of companies. Moreover, it was not possible to obtain a balanced and fruitful partition based on this ratio; practically all companies were located in the same cluster/group, reflecting that the algorithm fails to differentiate companies based on this ratio and, therefore, it was not possible to perform the proposed conglomeration analysis.
It should be noted that some cases were found without available data to determine the ROA (for example, without data on Assets or Income) in some of the years of analysis, or the variable Productive Specialization when studying the companies. Both cases correspond to firms that are, therefore, not considered when making the clusters and no outstanding pattern or characteristic was found. That is, by excluding them, no data is lost from any agricultural subsector or group of companies in particular. Their aggregate characteristics match the aggregate characteristics of companies with complete data.
The data of the used companies were provided by the tax authority under a confidentiality clause, so they are not publicly available or part of an interinstitutional agreement.
4. Results
4.1 Choosing the number of clusters
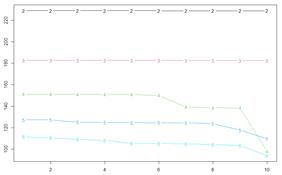
From the analysis of the aforementioned stop criteria, the decision was to study three clusters or groups of companies. The graph of the index of the first stop index (Calinski and Harabatz’s) for the estimation of the clusters with definition 1 of the ROA is presented below to support the decision. It can be seen that the best partition is two groups since it reaches the highest value of the index in the 10 iterations performed by the algorithm (the clusters are estimated 10 times in order to observe the stability of the results). Moreover, using three clusters is the second-best option and, given the problem in question -to analyze the trajectories of the companies based on the profitability measured by the ROA-, it is considered more appropriate to increase the number of groups and work with K=3. Something similar was observed when estimating the groups with definitions 2 and 3, so it is reasonable to work with three clusters. It is worth clarifying that the value of the index is not interpreted, but used for comparative purposes.
4.2 Analyzing the evolution of ROA
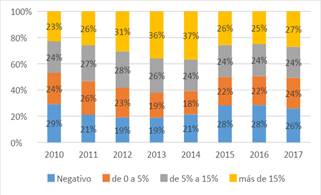
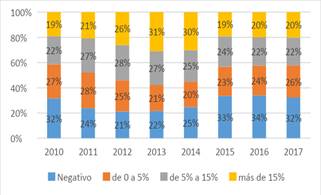
Graphs 2, 3 and 4 present the evolution of the values of ROAs 1, 2 and 3 for the 713 companies in the database during the period 2009/10 to 2016/17, without cluster separation, to describe the evolution of the profitability of the Uruguayan agricultural sector. They were arranged into four strata:
Equal to or lower than 0.
Greater than 0 and lower than 5%.
Greater than 5% and lower than 15%.
Equal to or greater than 15%.
The pattern of evolution is similar, regardless of the way of measuring the ROA. Therefore, it cannot be speculated that the cost per lease or interest acted disruptively in the analyzed period, causing ups and downs in the measurement of profitability. There is an increase in the number of firms in the positive securities strata between the initial period (2009/10) and the 2013/14 financial year. Between this year and the next, but especially in the 2015/16 financial year, there is a sharp deterioration in the strata with positive values, reaching a maximum percentage of companies with null or negative results. The last financial year shows similar values to the previous or slightly improved.
With different percentage values, the same path is observed in the three ways of calculating ROA. As we include costs (lease and interest), although the denominator is maintained (total assets), the numerator decreases, so the economic profitability deteriorates.
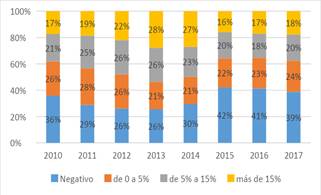
So, from the perspective of describing the evolution of corporate profitability, there is no evidence to conclude that financial ROA is the most appropriate indicator to describe profitability.
4.3 General evolution of ROA according to its three measuring models, from longitudinal cluster analysis
Given the limits between -100 and 100% of the ROA values, 645 companies were analyzed according to the first model of measuring ROA, 656 companies according to model 2, and 654 companies according to model 3. By adding leasing costs (model 2) and leasing and interest (model 3), some companies with values greater than 100% in the ROA fall within the range of analysis. The full detail of the structure of each model is presented below. It is worth clarifying that the effect of interest and lease is a by-product that could arise from the present research.
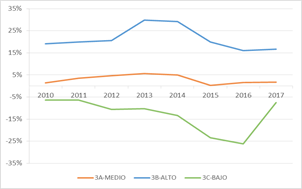
This section pretends to answer the question of whether the evolution of the general profitability of the sector varies according to the way it is measured. Graph 5 shows the evolution of profitability (%) measured by the average ROA (1, 2 and 3) for all companies included in the partition of the three clusters (excluding out-of-range cases, companies with ROA under -100% and over 100%). A similar behavior is observed in the three measuring models. Notoriously, the sector reaches peak performance in the biennium 2013-2014 and then falls and begins recovery in 2017.
The use of average ROA values per year absorbs intra-annual variation (attributable to scale, productive specialization and other components that define production processes). On the other hand, the interannual variation, for each ROA measuring model, reflects changes in prices and system productivity, which in the short term are associated with climatic circumstances.
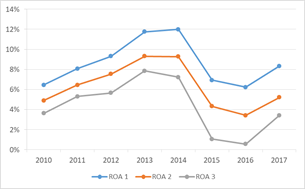
Graph 5: Average values of ROA 1, 2 and 3 (in %) for the study period, excluding out-of-range values (ROA under -100% and over 100%)
ROA 1 has a simple average for the three clusters of 8.45% (including the eight financial years), from a minimum of 6% in 2010 (repeated in 2016) to a peak of 12% in 2014. ROA 2 has a value of 6.55%, and ROA 3 a value of 4.78.****
On the other hand, it is observed that, although the absolute gaps are maintained, the relative gaps are not. Using the levels of profitability in the first definition as a reference, ROA 1, in 2010 it is observed that the average ROA decreases by 17% when using definition 2 and 35% when comparing definition 1 with 3 (which is consistent with the definitions). Meanwhile, in 2015 the decreases are greater, 60 and 80%, respectively (from ROA 1 to ROA 2 and 3).
Finally, in the last studied period (2017) the decreases are, again, less pronounced between each definition of the ROA, 33 and 54% when taking definitions 2 and 3,respectively, instead of 1.
As mentioned when explaining the calculation formulas for the different ROAs, while model 1 describes the operating income of agriculture, ignoring the cost of land and credit, model 3 describes the final available profitability for the rural business owner, corresponding to model 2 an intermediate value and, according to certain authors, more balanced when the denominator considers the total assets of the statement of position of each company. If the results of this study are used to define public policies or make investment decisions, all three indicators are useful. If the value of ROA 1 is high and that of ROA 3 is very low, it indicates that the country has a problem with financial costs and difficulty of access to credit. If there is a large gap between ROA 1 and ROA 2, there is a problem with cost and access to the land factor.
With this evidence available, institutions can promote accessible lines of credit. According to the investor's approach, ROA 3 is indicated, since it is the one that best approximates the return on the capital invested by the business owner. In this sense, the financial ROA would be the most relevant indicator to describe profitability, since it shows significantly lower profitability than the other two ratios, and therefore more functional to the decision-making.
Similar to the observed when analyzing the previous graphs (see the three graphs by profitability stratum, graphs 2, 3 and 4), there is a period of ROA growth between the financial years 2009-10 and 2012-13, a plateau between the financial years 2012-13 and 2013-14, then a sharp fall between the financial years 2013-14 and 2014-15, another plateau between financial years 2014-15 and 2015-16, to end the period with a ROA recovery between financial years 2015-16 and 2016-17. The three measuring models show the same trend pattern. Hence, it can be deduced that, during the period under review, changes in the landmarket and financial market conditions -which determine lease and interest payments- have little or no impact on the evolution of profitability.*****
4.4 Evolution of ROA across longitudinal clusters, excluding companies with ROA values over 100% and under -100%
According to the stated in the methodology chapter, longitudinal clusters were estimated based on the trajectory of three similar definitions, but different from ROA: ROA 1, 2 and 3. On each occasion, it was decided to work with three groups called A, B and C,******, but it should be clarified that the internal conformation of each group is not the same in each sequence due to the definition of the ROA considered. That is, a firm can be included in cluster A according to ROA 1 and then in cluster B according to ROA 2.
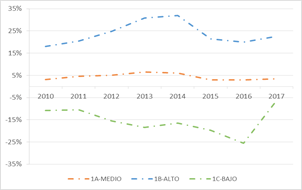
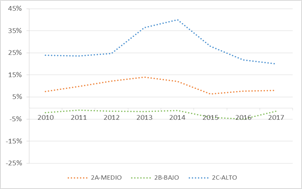
Graphs 6, 7 and 8 show the evolution of ROA per cluster.
The summary can be observed in Graph 9.
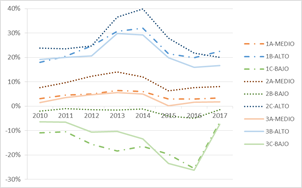
Graph 9: Comparative of the evolution of the three models for measuring ROA (in %) per cluster (A, B, C)
Graph 9 shows that the three partitions (each corresponding to a ROA measuring model) allow us to identify three groups of companies, on each occasion, with similar patterns of profitability evolution, despite the different measuring models. In each clustering******* we find:
a group with high ROA values (corresponding in the graph to: 1B, 3B and 2C);
a medium positive group (1A, 2A and 3A);
a third group with negative low (simple average) values (1C, 3C and 2B).
In this graph, two effects are combined, the originated from the model for calculating ROA (1, 2 or 3) and the effect of the cluster conformation (A, B or C). Note, for example, a striking result: clusters formed from model 2 of the ROA (dotted) have higher average values. This result must be affected by the different internal conformation of the clusters in each definition, as well as the 12 companies that are within the ROA range between -100% and 100%, when the cost of leasing is included in the costs. Section 3.4 details the internal composition of companies by cluster to study whether they are the same companies or not.
Higher returns and mid-tier groups appear to be following a similar path; however, increases in ROA values over the 2012 to 2015 period are much more pronounced in higher return groups. On the other hand, the negative profitability groups show a ROA deterioration process until 2016, to recover in the last financial year, with two well-defined patterns, more acute in 1C and 3C, and with less variation in the case of 2B.
These similarities and differences are mainly explained by the conformation of the groups (the companies that are part of the clusters) that share a similarity in the evolution of the profitability measure.
4.5 Internal clusters conformation
This item analyzes the internal conformation of the conglomerates to answer the following question: Are there companies that, regardless of the ROA measuring model, present clear similarities in the evolution of their profitability over time? That is, in practical terms: Are the firms located in Group A given the evolution of ROA 1 the same as those located in Group A according to the evolution of ROA 2, and so on?
Of 713 firms in total, 189 were part of cluster A, either by ROA 1 or ROA 2, and therefore have intermediate profitability relative to that of C and B, which ranges between 5 and 15% depending on the ROA measuring model (see Table 1). The bulk of the firms (248) move from group A by ROA 1 to B by ROA 2, that is, they move to a group of lower profitability. This is reasonable to the extent that ROA 2 subtracts lease costs. However, when looking at the internal conformation of groups of similar companies, the evolutionary behavior of profitability is maintained over time, regardless of the measure of ROA or cluster.
Table 1: Correspondence between ROA 1 and ROA 2 in the formation of clusters and atypical
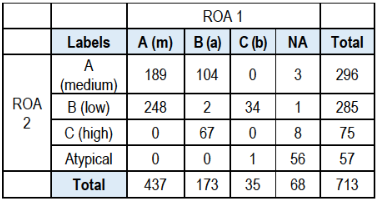
Note: Medium or m, High or a, and Low or b values.
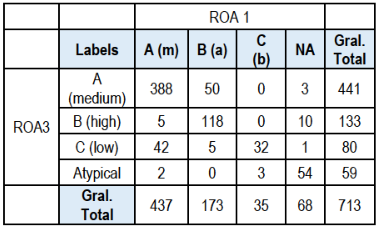
Table 2 shows that 388 of 713 companies remain in group A, which corresponds to intermediate profitability between B and C, either by ROA 1 or ROA 3. Something similar happens with the companies of group B (which shares 118 companies).
These two tables show the coincidence or non-match of companies by comparing the clusters formed with the different ROA measuring models. When analyzing the composition of companies by cluster according to models 1 and 3 of the ROA, a high coincidence is observed, that is, the companies that according to model 1 of the ROA belong to a certain cluster are also usually grouped when working with model 3 (see Table 2). On the other hand, model 2 of measuring ROA generates very different groupings of companies (see Table 1).
The comparison table of the partitions obtained with the definition of ROA 2 and 3 was not included, since it is similar to that of ROA 1 with 2, since partitions 1 and 3 are very similar.
5. Discussion and conclusions
In conclusion, predominantly, there is no relevant difference in the way profitability evolves, either measured by operational or financial ROA, except for the experiences in 2016 and 2017. In these two years, the profitability recovery seems more accelerated by ROA 1 than by ROA 3. In other words, the operating income of the Uruguayan agricultural sector is quickly observable, while the net financial income takes a while longer to do so. The effects of lease and interest costs can be assumed to persist for two years, due to the terms of contracts, something similar to what is explained by the theory of Sticky costs38, by which structural costs tend to last over time, regardless of variations in the level of activity.
The use of the financial ROA is more appropriate to describe the situation of agricultural profitability from the perspective of the rural business owner, but it is not necessarily the most appropriate to describe its evolution, since interest and lease payments take at least two/three years, while the most direct determinants of profitability have a variation frequency that corresponds to shorter periods (mainly associated with the variation in commodity prices). Notoriously, ROA 3 presents lower returns due to the weight of financial costs and leases, which could be considered when designing public policies. Using an intermediate definition (ROA 2) generates a different cluster formation process, which can be important when analyzing the determinants of profitability.
Finally, most firms can be classified into three clusters with internally similar evolution of their profitability and very different between groups, whatever the ROA used (operational or financial). The question posed in Section 4 -Are the firms located in Group A according to the evolution of ROA 1 the same as those located in Group A according to the evolution of ROA 2, and so on?- can be answered, and the answer is that it is partly true. Many of the companies are the same, particularly when clusters are formed based on ROA 1 and 3, not the same as with ROA 2. There are, then, groups of companies similar in their intertemporal financial performance, regardless of how it is measured.
Both results address the need to deepen the analysis of the nature of firms and how this is associated with variations in the ROA indicator.

