Inglés (pdf)
 Articulo en XML
 Referencias del artículo

 Permalink
1. Introduction
In South America, commercial forest plantations went from 8 to 14 million hectares in the 1990-2015 period, given the growing demand for forest products concentrated mainly in Brazil, Chile, Argentina, Peru and Uruguay1. In the south of Brazil, the western coastline of Argentina and Uruguay, forest plantations focus on pulp production and the paper industry2.
The plantation densities and spacing arrangements do not generally consider the production of pastures and livestock under the canopy since they aim to optimize the production of significant volumes of wood per hectare. As new non-integrated producers join the forest chain, it is essential to generate productive alternatives that allow greater integration of the forestry activity in livestock farms with combined wood-livestock results for these local family producers.
In Uruguay, the increase in land value has had a substantial impact on the policy of acquiring large areas in recent years3, which is why forest companies seek to expand their crops on land they do not own, mainly livestock farms, given the complementarity of the items. These strategies have allowed different livestock producers to enter the forestry activity, complementing the main cattle activity, favoring income diversification, and achieving more stable long-term economic returns4)(5. Greater joint production and an improvement in the financial return could generate higher possibilities for the permanence of family production in rural areas, so it is relevant to know the results of these systems.
An Australian study compares results of dasometric variables for Eucalyptus globulus from 3 to 4 years of age6 in different planting arrangements (4×2 m, triple rows (4×2)+10 m, 2×10 m and 10×10 m). When comparing the first two treatments with the third one, trees with lower individual basal area and higher mean height of the dominant trees (DH) presented significant differences in individual volume between the first and second treatments.
Studies in Brazil7 evaluate different species of the genus Eucalyptus at different ages of forest cultivation (15, 31 and 41 months), showing that the spacing between trees (3×1.5 m, 3×3 m, 4×3 m) affects the total mean height (H) and the Diameter Breast Height (DBH) at 41 months for Eucalyptus camaldulensis, where the last two treatments have higher values of both DBH and H. According to Alves and others8, evaluating clones of Eucalyptus urophylla x Eucalyptus grandis between the third and sixth year of age for the following treatments 3×1 m, 3×1.5 m, 3×2 m and 3×2.5 m, lower values of DBH and H were found for the first spacing.
Both Alves and others8 and Ranieri and others9 conclude that the growth rate decreases over time in denser arrangements, both for DBH and H. According to Anjos and others10, when evaluating a clone of E. grandis x E. urophylla, comparing a silvopastoral system (3.5×3) +30 m triple rows with a monoculture (3.5×3 m) in Mato Grosso, Brazil, they concluded that in the first system the trees presented higher DBH and lower H at 36 months of age. In summary, a greater useful area per plant (pl/m2) in general results in higher DBH.
Cerqueira and others11 when evaluating clones of the hybrid Eucalyptus grandis x Eucalyptus urophylla at 51 months of age found that for different treatments: double rows (3×2) +52 m (T1), triple rows (3×2) +15 m (T2), triple rows (3.5×3) +30 (T3) and 3.5×3 m (T4) the plantation density and its design are factors that influence the DBH-H relationship of the trees. They conclude that the mean H was higher in T4 compared to the other treatments, given the higher density and search for light by the trees, while DBH tends to increase at greater spacing.
Araujo and others12 indicate that no spacing effects were observed for DBH and survival, when evaluating E. urophylla in different plantation arrangements (3×2 m, 6×4 m and 10×4 m) at 6, 12, 18 and 24 months of age of the crop. Regarding this last variable, Alves and others8 and Ranieri and others9 observe that denser planting arrangements (3×1 m, 3×1.5 m 3.6×2.5 m and 3.3×3.3 m) result in lower survival, which shows greater competition among plants for less surface area available for growth.
At the population level, the volume per hectare recorded higher values in high-density plantations given the effect of a greater number of trees6)(7)(8)(13.
Regarding the evaluation of forage production under canopy, Henskens and others6 point out that a lower return of wood per hectare can be compensated by the greater growth of pastures under canopy due to greater availability of light, increasing the overall benefits in the system. It is generally established that a lesser amount of light reaching the herbaceous stratum due to the effect of trees (crown, density, age) determines a lower growth potential of the grass and modifies the botanical composition. However, this will depend on the species’ tolerance to shading, the characteristics of the trees, and soil fertility14)(15.
In silvopastoral systems, trees are generally arranged in one or more rows separated by wide alleys to maximize total forage and wood production, and more efficient livestock management16. Some of the positive aspects of the trees on pastures are protection against temperature and wind variations, favoring the survival and permanence of the tapestry, the greater availability of soil moisture -which allows the growth period to extend-, and the transfer of nutrients14)(17)(18, among other benefits. These interactions will condition the pastures' animal carrying capacity (LU/ha). However, tree shade can contribute to the thermal comfort of livestock; they can affect pasture production when selecting grazing areas and contribute to the compaction of soil under the canopy given the higher concentration of animals in shaded areas19)(20. Consequently, there can be different variations in degrees of trampling and other physical damage and urine and feces deposition in different system areas21.
The economic-financial profitability of these systems varies, among other aspects, with the volume of wood obtained, the species, and the commercial destination. According to Lacorte and others22, who compared pure forestry and silvopastoral systems, it resulted in an Equivalent Annual Income (EAI) of 170 USD/ha/year and 162 USD/ha/year, respectively; in turn, the Internal Rate of Return (IRR) is higher in silvopastoral systems (34.5%) compared to pure systems (26%). Cubbage and others4 highlight when evaluating the entire cycle that integrated systems are low-input systems; the IRR obtained is between 7-12%, without considering the land cost23.
In silvopastoral systems, productive-economic, environmental and social interactions are established. These interactions must be known to project their viability in the medium to long term. The tree component variables that are most relevant in the association of forestry and livestock activities are forest species, crop age, initial density, spacing and distribution of trees in the plantation. They determine the wood production of the system but also the production of forage under the canopy.
The objective of this research was to evaluate and compare the forest production and the financial return in two plantation silvopastoral systems: a Conventional Forest System and a Silvopastoral System.
2. Materials and methods
The study consisted of measuring dasometric variables and evaluating wood production in two plantation arrangements, up to 68 months of forest cultivation. These data were employed to project the production of wood, assessing the financial return in both systems.
For this, the case study methodology was applied to a farm that combines forest and livestock production.
2.1 Study area
The study was carried out on commercial plantations of E. globulus (Jeeralang origin from seed) planted in the spring of 2011, in the department of Rocha, Uruguay (34º03'28.82" S - 54º05'1.76" W). This area of the country records average annual precipitation between 1200 and 1300 mm. The annual average temperature is 16.8 ºC; with an annual average maximum between 21 and 22 ºC, January being the warmest month, and the annual average minimum between 12 and 13 ºC, July being the coldest month24.
The area is located in uneven lands, with ranges and strong hills, containing areas of recharge and transit to local groundwater flow (high part) and middle and low slopes, mainly near the runoff routes25. In low areas, hydromorphism problems could occur and cause temporary states of water saturation in the soil. Laboratory tests of soils were carried out to assess and describe the study area; they indicate that soils with an acidic pH, in the range of 5, are prevalent. In some edaphic profiles, at greater depth the pH increases, which can be associated with the incidence of groundwater. Soils contain very low P values (between 2 and 3 ppm). Furthermore, the organic matter content is greater than 4%, with a maximum of 5.8% and a minimum of 4.2%, representing moderately rich to very rich soils.
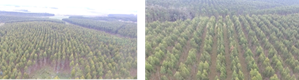
2.2 Productive systems
Two productive systems were evaluated: Conventional Forest System (CFS) and Silvopastoral System with double rows and alleys (SSRA) (Figure 1). The CFS presents a plantation arrangement of 3.5×2.27 m, which is equivalent to a theoretical initial density of 1,258 trees/ha; a commonly used spacing in commercial forest plantations that mainly produce trees with small diameters for cellulose pulp manufacturing. The SSRA has a 2×2 m + 8: double row planting arrangement with 8-m alleys, which represents an initial density of 1,000 trees/ha.
Livestock activity takes place in afforested areas as well as non-crop-occupied areas (such as low zones and firebreaks). The cattle business involves rearing and winter fattening using Angus and Hereford breeds. One to two-year-old cattle is bought with approximately 240 kg and kept on the site from two to three years until reaching a final weight of 480-490 kg (steers over three years). This is done in a rotary grazing system where the cattle alternates between paddocks according to forage offer.
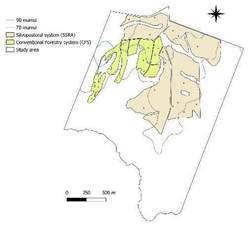
A priori, the study area was stratified by topographic area in three strata according to land altitude meters above mean sea level (mamsl): Stratum 1 (low, less than 70 mamsl), Stratum 2 (medium, between 70 to 90 mamsl) and Stratum 3 (high, greater than 90 mamsl). Stratum 1 was added from month 41 of the forest cultivation age. In this way, the sample was stratified with the aim of reducing the variance within each stratum26; stratified estimation is a statistical technique that can reduce the variance of estimates without increasing the sample size26. A sampling error between 5 to 10% was predetermined; 30 plots were installed to evaluate forest productivity (Figure 2). The forest plots were rectangular shaped with an area of 216 m2 (CFS) and 400 m2 (SSRA), with at least 30 trees per plot. The following individual variables were measured up to 68 months of age: Diameter Breast Height (DBH), Height (H), and the number of live and missing trees (Table S1 in Supplementary material). With these data, the following was calculated: Basal area (G, m2/ha), Volume with bark per unit area (V, m3/ha), Dominant Height (DH, m), and Density (N, trees/ha), Mean Annual Increment (MAI, m3/ha/year) and Survival Rate (S, %).
The design used was stratified random sampling, where random plots were established in each stratum with the same number of repetitions in each system. The effect of the systems (CFS and SSRA) and strata on the dasometric variables DBH, H and Volume with bark per unit area (V, m3/ha) were studied by adjusting linear models of repeated measures over time, with an autoregressive correlation structure of order 1. The effects evaluated in the model were tested using the analysis of variance technique and the means of the interaction Month×System×Stratum were compared with the 5% Tukey Test. All statistical analyses were performed with SAS software (SAS).
A previous study of forage evaluation on similar systems was used to estimate and project the cattle stocking rate27. Livestock is incorporated in the second year of plantation. For SSRA, a 0.65 Livestock Unit per ha (LU/ha) was assigned until the fifth year of forest cultivation. From year 6 to year 7, 0.6 LU/ha was determined, and from year 8 onwards it was 0.5 LU/ha. On the other hand, a 0.4 LU/ha was considered for CFS for the second and third years, 0.3 LU/ha between the fourth and seventh year of age, and 0.2 LU/ha at the end of the cycle. The values of stocking rate arise from the forage evaluation on previous studies27.
2.3 Financial evaluation of the systems
The capital budgeting approach was applied for the financial and economic evaluation, considering costs, prices and profits of carrying out the silvopastoral systems in terms of market prices28.
The indicators used for the economic and financial evaluation of the systems were Net Present Value (NPV), Internal Rate of Return (IRR), Land Expectation Value (LEV), and Equivalent Annual Income (EAI), with an opportunity cost of 5%. These last two indicators allowed for comparing alternatives of different durations over time.
Net Present Value (NPV)
The NPV (Equation 1) converts a series of periodic cost and income flows to a single number that can be used to compare investment alternatives over the same investment horizon28. An investment is acceptable if NPV is greater than zero, which means that it will return at least the alternative rate of return29.
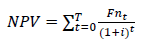
Where Fn t is the Net Cash Flow in year t, i is the discount rate (%), and T is the harvest year.
Internal Rate of Return (IRR)
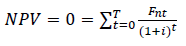
The IRR (Equation 2) is the discounted rate (i) that is required to arrive at an NPV of zero30)(31; these indicators are widely used in private decisions. The IRR is the interest rate at which the present values of revenues equal the present values of costs.
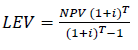
Land Expectation Value (LEV)
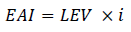
The LEV (Equation 3) was developed to compare unequal time periods for alternative forestry investments28)(29, being a widespread forest financial index. Finally, EAI (Equation 4) is the payment an investor would receive annually at a given discount rate i.
Equivalent Annual Income (EAI)
A planting cost of 979 USD/ha and 772 USD/ha was estimated for CFS and SSRA, respectively (at 2019 values), including site preparation and planting. Other costs considered were post-planting controls (weed and ant) during the first year (80 and 90 USD/ha for SSRA and CFS, respectively), annual maintenance (20 USD/ha/year), and net income tax at harvest year (25% on gross income). The wood density considered for calculating the transport costs was 0.8 ton/m3, commonly used for E. globulus32. The wood price placed at the mill door used for financial results was 65 USD/m3. The stumpage price used for E. globulus was 28-27 USD/m3 depending on the system (CFS 28 USD/m3 and SSRA 27 USD/m3). The price differences are due to higher harvesting and logistics costs for SSRA. Harvest and extraction costs were calculated using Harvester and Forwarder equipment, which estimates a cost of CFS 17 USD/m3 and SSRA 18 USD/m3. The latter is higher since a more extended time harvest is considered. The freight rate was calculated for 250 km at 0.1 USD/km/ton.
Log specifications were 7.2 m in length and 7 cm in small end diameter (SED). The volume projections at harvest age were carried out with the SAG INIA Software33, for both systems. The inputs for the projections were N, DBH, G, DBHmax and DH, based on the last measurement at 68 months of age of the crop for each system. The age at the final stage was established based on technical criteria, where the Current Annual Increment (CAI) is equal to the Mean Annual Increment (MAI).
For the financial projection, 50 ha paddocks were considered to compare both systems, where the effective percentage of forest area is 75% of the total area. Livestock is introduced in the second year of forest cultivation. It is assumed that livestock is removed one year before harvest and therefore it does not generate income in that period. Moreover, livestock income is calculated on the area affected by afforestation, which includes both the effective area of forest cultivation as well as surrounding areas of firebreaks and roads, assuming that 0.78 LU/ha/year produces a net profit of 50 USD/ha/year34. Meat production of between 85 and 105 kg/ha/year is reported at the establishment where the study was carried out, similar to the results of other livestock farms in the region34. Considering the former reference, based on the fact that a net profit of 50US$/ha/year is achieved with a 0.78 stocking rate, a linear proportion was applied to estimate the cattle net profit.
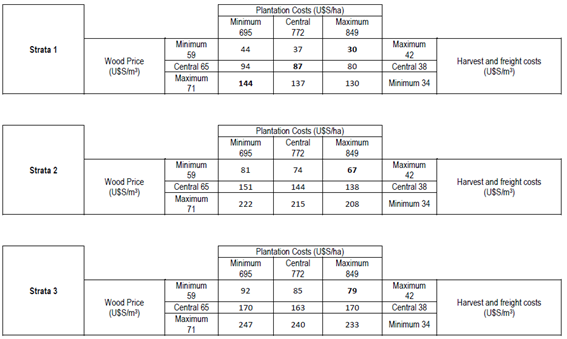
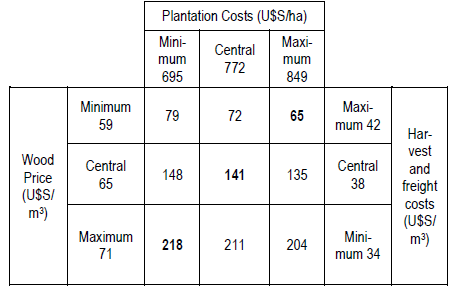
Changes in relative prices, such as inflation and currency devaluation, can affect financial results. Therefore, a sensitivity analysis was performed to assess EAI returns in different economic scenarios. Additionally, the sensitivity of EAI was evaluated in the three sites (strata 1, 2 and 3). Variations of a) plantation costs, b) harvest and freight, and c) wood price were taken into account. Given a central wood price of 65 US$/m3 at the mill (conversation with Redalco; unreferenced), a variation of ±10% was simulated according to a constant export price series of wood chips. The same treatment was performed for three-year values for plantation cost and harvest and freight costs (conversation with Redalco; unreferenced), applying ±10% of the variation for the sensitivity analysis.
3. Results
This section presents the main results obtained in the dasometric variables N, DBH, H, DH and V. Subsequently, the economic and financial results are projected.
3.1 Density
The average initial planting density was 1,021 and 1,318 trees/ha for SSRA and CFS, respectively, higher than the theoretical planting arrangement. At 68 months, the average density was 750 and 996 trees/ha for SSRA and CFS, respectively, which is equivalent to an average survival (S) of 73% and 76%.
Although the percentages of tree loss are very similar in both systems, there are differences by stratum within each system. In this sense, at 68 months of age, Stratum 1 presented 49% and 36% loss of trees on SSRA and CFS, respectively. In contrast, Stratum 3 has the lowest tree loss, around 15% for the SSRA system and 17% for CFS. In the same way, Stratum 2 resulted in 26% and 27% tree loss for SSRA and CFS, respectively.
3.2 DBH and H
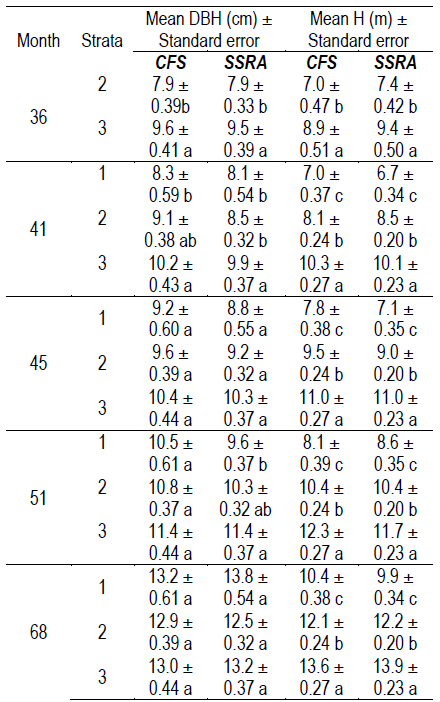
According to the statistical analysis, no significant differences can be established for DBH and H for systems CFS and SSRA, nor can differences be established in the System×Stratum interaction (p> 0.05). At 68 months of age, the DBH was 13.10 cm (±0.28) for CFS and 13.15 cm (±0.25) for SSRA (Table 1).
Table 1: DBH, H and V at 68 months for CFS and SSRA systems and strata
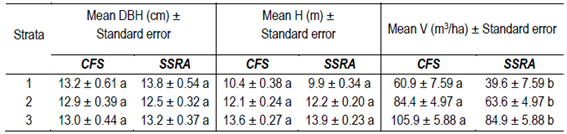
Note: Means with different letters differ significantly (p<0.05) between systems.
Regardless of the system, Stratum 1 presented the lowest productive values, followed by Stratum 2; the highest values are observed in Stratum 3. When comparing the mean DBH values between strata within the same system, differences are significant at 36 and 41 months of age (p<0.05). From 45 months of age of the crop onwards no significant differences (p>0.05) were found between strata in the same system (CFS, SSRA). Exceptionally, for system SSRA differences between Stratum 1 and Stratum 3 were noticed at 51 months of age. The highest DBH values were recorded in Stratum 3, except for the last measurement at 68 months of age (Table S1 in Supplementary material).
For variable H, significant differences between strata were found in all the months evaluated (p<0.01) in every System, with the highest H values corresponding to Stratum 3 (Table 1 and Table S1 of Supplementary material).
3.3 Dominant height
No significant differences in DH (m) could be identified between systems (CFS and SSRA) (p=0.2331), and no Month×System×Stratum interaction (p=0.9336). At 68 months, the mean DH for both systems was 14.64 m (± 0.25). However, significant differences can be identified by the strata effect in each of the months evaluated (p<0.01). The highest values were recorded in Stratum 3 (data not shown).
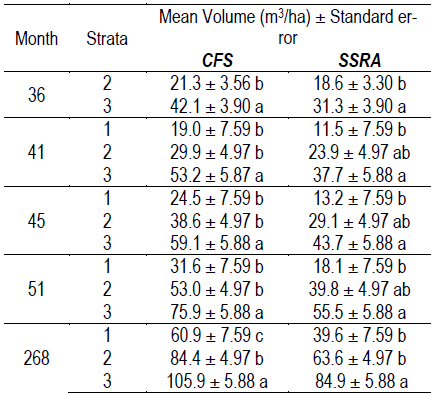
3.4 Volume
At 36 months of age, a system effect (p=0.0831) and a System×Stratum interaction (p=0.2842) could not be established for V. From 41 months of age there are significant differences for V due to the system effect (p=0.0061) (Table S2 in Supplementary material). At 68 months of age on average, V was 83.7 m3/ha (±3.60) and 60 m3/ha (±3.60) for CFS and SSRA, respectively, with significant differences (p< 0.05).
If only stratum effect is evaluated in each system separately, significant differences could be established (p=0.0002) for V by stratum effect. As shown in Table 1, V is always greater in the upper strata: Stratum 3 is always greater than Stratum 2, and this one, greater than Stratum 1. Furthermore, the CFS system always has higher V than SSRA, for the same age and stratum.
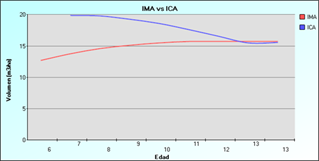
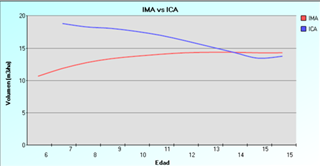
At 68 months of age, the average MAI was 14.8 and 10.5 m3/ha/year for CFS and SSRA, respectively. If compared by stratum, the values were 10.7, 14.9 and 18.7 m3/ha/year for Strata 1, 2 and 3, respectively, for CFS. While for SSRA they were 5.6, 11.2 and 15.0 m3/ha/year for Strata 1, 2 and 3, respectively.
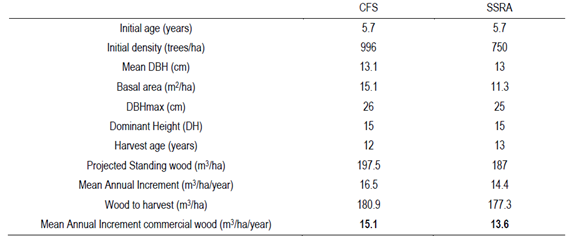
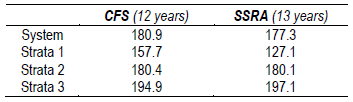
Simulated volumes at respective final harvest ages for each system and stratum are shown in Table 2. Simulation inputs and outputs can be seen in the supplementary material (Table S3 and Figures 1 and 2).
3.5 Financial results
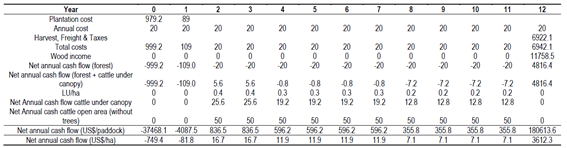
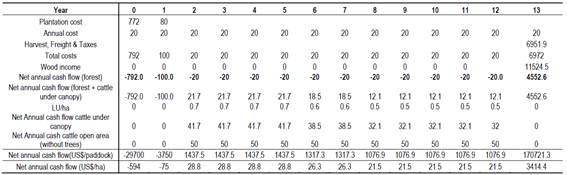
The CFS system presents its optimal technical harvesting age at 12 years (180.9 m3/ha), while the optimal harvesting age for SSRA is at 13 years (177.3 m3/ha).
Livestock net profit values under canopy for CFS vary from 13 to 26 USD/ha/year, and from 32 to 42 USD/ha/year for SSRA (see Tables S6 and S7 in Supplementary material); depending on the cattle stocking rate that is reduced as the forest plantation develops over time. For areas free of forest cultivation, a net livestock profit of USD 50/ha was estimated.
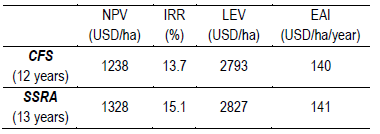
As can be seen in Table 3, EAI for both systems is similar: 140 and 141 US$/ha/year for CFS and SSRA, respectively.
On the other hand, the IRR of SSRA is greater (15.1%) than the IRR value of CFS (13.7%). The higher IRR value in SSRA is due to a higher livestock income in alley areas, which, combined with a lower initial planting investment, results in a higher IRR for SSRA.
Although NPV values differ, they cannot be compared with different rotation lengths, so LEV and EAI are used to analyze the results. If the LEV and EAI are compared by system at a 5% discount rate, both systems obtained the same values.
Sensitivity analysis
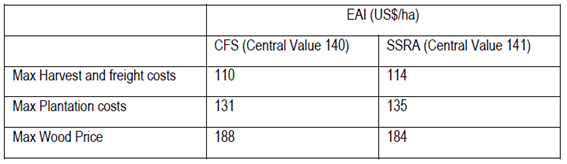
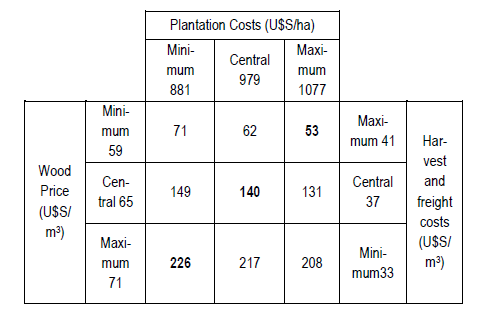
An increase of 10% in harvest and freight costs results in a decrease in EAI of about 21% for both CFS (from 140 to 110 US$/ha/year) and SSRA (from 141 to 114 US$/ha/year). If plantation costs are increased by 10%, a decrease in EAI of about 7% is observed for both systems. EAI values for CFS drop from 140 to 131 US$/ha/year and for SSRA the decrease is from 141 to 135 US$/ha/year.
On the opposite way, if we only consider a 10% increase in the price of wood, an improvement of 34% of the EAI is obtained for CFS (from 140 to 188 US$/ha/year) and 30% for SSRA (from 141 to 184 US$/ha/year).
We can scrutiny the results of the worst scenarios on the top right box in Tables 4 and 5, resulting in a decrease of EAI by 62% and 54% for CFS and SSRA, respectively. It is noteworthy that, even in the worst scenario, the financial results remain positive in both systems.
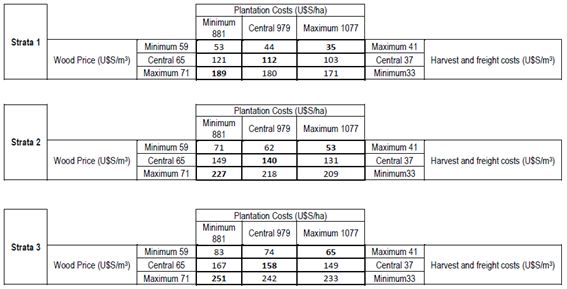
Furthermore, sensitivity analyses for EAI were performed for each stratum (see Tables S4 and S5 in Supplementary material).
Positive values of EIA were observed in every stratum. Central EAI for CFS were 112, 140 and 158 US$/ha for Stratum 1, 2 and 3, respectively. The EIA for SSRA at Stratum 1 has a value of 87 US$/ha/year, that is, 22% lower than in CFS. Strata 2 and 3 results in EAI values are quite similar to those for CFS (144 and 163 US$/ha/year, respectively).
In the worst-case scenario, where plantation, harvest and freight costs increase by 10% and wood prices decrease also by 10%, EAI for Stratum 1 decreases 69% for CFS and 66% for SSRA. The decrease of EAI values in Stratum 3 was 59% and 52% for CFS and SSRA, respectively.
In the most favorable scenario, where all costs decrease by 10% and wood prices increase by 10%, EAI values for Stratum 3 are 251 US$/ha/year and 247 US$/ha/year under CFS and SSRA, respectively. This represents an increase compared with their respective central values of 59% for CFS and 52% for SSRA.
It is noteworthy that in all scenarios and strata considered financial returns were positive.
4. Discussion
Since no differences were found in individual DBH and H between the two systems (CFS and SSRA), their difference in wood productivity (m3/ha) could be explained by the higher plant density in the CFS system. Although there were no significant survival differences between systems, the density evaluated in the five measurements (36, 41, 45, 51 and 68 months of age) was consistently higher in CFS. In the last measurement (68 months), the density was 750 and 996 trees/ha for SSRA and CFS, respectively, which translates into a higher volume per hectare.
Additionally, the results reflect the difference between strata, which could amount to differences in the quality of the forest site.
According to simulated growth values for commercial plantations of E. globulus in the same area and high densities per hectare (1,100 trees/ha), the DH can register average values around 16 m and DBH of 13 cm at 68 months33. The average results obtained in both systems, CFS and SSRA, at the same age were similar between them and slightly lower than those found for the area, around 15 m in height and 13 cm of DBH.
In our study, when comparing the systems (CFS and SSRA), it was found that there were no significant differences for the individual DBH values (p>0.05) in each of the months under evaluation, with an initial area at 36 months of 7.6 m2/tree and 9.8 m2/tree, and at 68 months of 10.0 m2/tree and 13.3 m2/tree for CFS and SSRA, respectively. Accordingly, Henskens and others6 did not find significant differences in DBH at 3 and 4 years for densities of 1,250 trees/ha and 833 trees/ha, with an area of 8m2/tree and 12 m2/tree, respectively. Although the second planting arrangement of their study is in triple rows (4×2)+10 m, the areas are very similar to those in our study. Araujo and others12 found no DBH differences in highly contrasting spacing (6.24 and 40 m2/tree), which could be attributed to very early measurement ages in the crop (6, 12, 18 and 24 months), where the differences between systems could be seen later. For example, the study of Bernardo and others7 found for E. camaldulensis that the higher the spacing (3×3 m and 4×3 m), the higher the DBH, compared to the 3×1.5 m plantation arrangement.
Other studies8)(9)(10 compare highly contrasting densities, for example, between 3,333 and 1,333 trees/ha8, while Anjos and others10) compare 270 trees/ha in contrast to 952 trees/ha, obtaining as a result that the higher the spacing, the higher the DBH. It is expected to find these differences when comparing different plantation arrangements and with areas between 3 to 20 m2/tree. In this study, we started from a seed material, with not very contrasting planting arrangements and area per tree, like Henskens and others6. Similar results in diameter and height indicate that the initial spacing affects productivity during the forest cultivation cycle. In general terms, the growth rate in DBH increases with decreasing density, in contrast to what happens with height, where growth differences are not so evident35.
For variable H, the results are consistent with Bernardo and others7, where according to the evaluated treatments no differences were found between them for this variable. However, other studies6)(9)(10 point out that denser forests should translate into higher H due to greater competition for light.
The tree survival variable (S) did not show significant differences between systems. The results are not similar to those found by Alves and others8, where the survival rate decreases with an increase in density; however, they are similar to what was expressed by Araujo and others12, where the different evaluated treatments do not show differences in survival.
Therefore, and since there are no differences between the two systems in survival and the individual values of DBH and H, it is reasonable to say that the difference in wood production per ha (m3/ha) among systems could be explained by the effect of planting density. Previous researches6)(7)(8)(9)(13) found that the volume per hectare can record higher values in high-density trials, given the effect of a greater number of trees per hectare, despite having lower values of individual DBH.
Both systems aim at the integrated production of pulpwood and meat; while the CFS system obtains a greater volume of wood per unit area (m3/ha), SSRA hosts more livestock units.
As for the economic-financial results, both investments are viable and profitable, being the optimal rotation age in technical terms of 12 and 13 years for CFS and SSRA, respectively. In both systems the IRR was around 13.7% for CFS and 15.1% for SSRA, matching the profitability values obtained by Cubbage and others23) without considering the land cost. In the case of LEV and EAI, the two systems obtained similar profit values at a discount rate of 5%, which coincides with Lacorte and others22.
As expected, the evaluation of the discount rate in these systems plays an important role; for example, if the discount rate is higher than 7%, EAI becomes slightly higher in SSRA (110 US$/ha/year) than in CFS (104 US$/ha/year). Therefore, SSRA is expected to be the system with the best economic-financial performance as the discount rate increases.
The EAI values were positive in all scenarios analyzed. Nevertheless, site conditions are relevant and determine in a high proportion the financial results of these systems.
It is reasonable that the producers' preferences come into consideration when choosing one of these two systems, such as being able to maintain a larger cattle stock over time, as happens with SSRA.
Both systems produce wood and meat; nonetheless, the SSRA allows a longer permanence of cattle grazing on the alleys, becoming a more attractive option when the integration of forestry in cattle farms is pursued. In fact, comparing the difference in net cash flow from year 2 to year 11, the SSRA system produces an average increase in liquidity of 148% due to net livestock income (Table S7 and Table S8, in Supplementary material).
The sensitivity analysis shows that wood price is the single variable that most influences financial results, 34% and 30% for CFS and SSRA, respectively (see Table S6 in Supplementary material).
More research would be relevant to improve the policies applied to integrated meat and wood systems as well as the decision-making of cattle producers on these systems. Particularly, aspects linked to changes in the relative prices of meat and wood and how it could affect the viability of these systems.
New research lines could be explored to achieve a better value of wood at commercialization and allow compensation for the low tree density. In this context, intermediate silvicultural management should be carried out during the forest cultivation cycle -pruning and thinning-, which determines a more complex system in productive terms, but with greater added value in its products. This management would also favor the production of forage under the canopy, and therefore a greater stocking rate.
In the future, other types of products should be included in the analysis, such as wood for sawmilling, winding and other products that achieve higher prices. Additionally, different plantation arrangements and forest species should continue to be evaluated to have complementary information to this study.
5. Conclusions
The results obtained allow evaluating and comparing the two systems from the productive and financial points of view, demonstrating that both systems are viable. One of the first conclusions refers to the fact that the individual DBH is influenced by the effect of the stratum and not by the system. On the other hand, the volume per hectare that represents one of the main variables of financial-economic results is explained by the stand density.
The information generated allows projecting productive and economic results for different combinations of livestock-wood production, which is expected to improve decision-making, mainly of family livestock producers not integrated into the forest chain. This will improve their income and broaden the productive base, reducing market risks.
The results obtained would indicate that it is feasible to carry out an SSRA that includes alleys, even when the commercial objective is to optimize the wood volume.
These results allow reflection on the advantages of designing plantations that optimize the use of space and improve the use of resources for better integration of wood and livestock production.