1. Introduction
Uruguay´s main production system is based on natural pastures. Because of favorable climatic conditions, sheep can graze all year long, but this has the disadvantage of animals being exposed to gastrointestinal nematodes (GIN). These are the most prevalent parasitic infections in grazing sheep worldwide, which cause important economic losses to the sheep industry, because of the decrease in meat and wool production, as well as the increase in costs associated to anthelmintic control. In Australia, Lane and others1 estimated losses of AUD 436 million per year.
Anthelmintic drugs are used as the main control method, but its frequent and indiscriminate use has favored anthelmintic resistance development. This situation resulted in the onset of alternative control strategies, one of them being the selection of genetically resistant animals. Animal´s ability to resist parasitic infections is genetically determined, with variability between breeds as well as between individuals from the same breed2. Resistance is the ability of an animal to initiate and maintain an immune response to prevent or eliminate a parasitic infection after it is installed, and it is quantified through nematodes egg count per gram of feces (FEC). In Uruguay, since 1994, GIN genetic resistance is included in the Corriedale National Genetic Evaluation (www.geneticaovina.com.uy), using FEC measured in lambs as selection criterion and estimated breeding value (EBV) estimation with the Best Linear Unbiased Predictor methodology (BLUP)3. FEC is a moderately heritable trait (h2 ~ 0.3) with a great variability between individuals4)(5)(6.
Nowadays, in most countries, the EBV estimation for selection of genetically superior animals is based on genealogical and phenotypic records, but in the last years, medium-density single nucleotide polymorphism (SNP) arrays have emerged as an additional source of information. Genomic information is a complementary tool in genetic evaluations for low heritability, long generation interval or difficult to measure traits. Genomic selection (GS) is a type of marker assisted selection where a great number of genetic markers (mostly SNP) distributed along the genome are in linkage disequilibrium (LD) with genomic regions associated to quantitative trait loci (QTL)7. The procedure consists of estimating all SNP effects simultaneously from individuals with phenotypic and genotypic information (reference population), and later using these effects to predict genomic EBV (GEBV) from selection candidates that don´t have phenotypic records8.
Each SNP effect can be estimated using different assumptions about its distribution9. In genomic BLUP (GBLUP) a normal distribution with equal variances for the markers effects is assumed7)(10)(11. Investigations carried out by Hayes and others12, VanRaden and others13, and Cole and others14 have showed that assuming equal variance for each SNP produced little or no loss of accuracy for most traits. In 2009, Misztal and others15 proposed to integrate genomic information in a single step genetic evaluation using single step genomic BLUP (ssGBLUP), where the additive relationship matrix (A) is combined with the SNP based genomic relationship matrix (G) to create an H matrix9)(16)(17. The main idea is to use all available information (phenotypes, genotypes and pedigree) in a model to predict GEBV for all individuals simultaneously18.
The use of genomic information in GEBV estimation allows to significantly increase genetic gain through EBV accuracy increase in young animals7. Nowadays, GS has been implemented in several sheep breeding programs in Australia19)(20, New Zealand21 and France22)(23. Concerning EBV accuracies, Auvray and others21 reported increases between 0.09 and 0.37 when using GBLUP instead of BLUP, for eight traits and four different breeds, with a genotyped population of 13420 animals. Accuracies for milk production trait increased from 0.26 to 0.42 when ssGBLUP method was used23, and between 0.05 and 0.3 increases for the same trait in six different dairy sheep breeds24. Regarding FEC trait, Torres and others25 reported EBV accuracies increases between 0.046 and 0.073.
In 2014, Periasamy and others26 identified 170 SNP associated with 76 candidate genes involved in immune response to GIN resistance, and Raschia and others27 found that eight of them were significantly associated with FEC in Corriedale sheep under artificial infection. In turn, INIA (National Agricultural Research Institute) developed a 507 SNP chip with the Affymetrix company that contains 174 SNP related to FEC trait and 258 paternity SNP (FMV_2_2011_1_6356_ANII project)28.
Even though this study is focused on GIN genetic resistance, with FEC as selection criterion, we also included fiber diameter (FD) for comparison reasons since it is a highly heritable trait and EBV accuracies are affected by this parameter29. This trait is also a relevant selection breeding objective for the Corriedale breed in Uruguay30.
The aim of this study was to evaluate the contribution of three different SNP arrays in GEBV accuracy increase as compared to traditional genetic evaluation for FEC and FD traits. Due to the small number of genotyped animals, this study was focused on GEBV accuracies.
2. Materials and methods
2.1 Phenotypic Data
From 2000 to 2019, FEC and FD records were collected from 19547 Corriedale animals belonging to 29 farms (24 stud flocks, 3 experimental units and 2 progeny testing centrals). Genealogical information from 40056 animals was provided by Uruguay´s Rural Association (ARU) and the Uruguayan Corriedale Breeders Society, who also provided the performance and management data.
FEC as well as FD traits are routinely registered at the National Genetic Evaluation, but the first one is not mandatory. FEC sampling was performed at 278±69 days mean age according to the protocol used for genetic evaluations30 and FD sampling was made at shearing (364±42 days mean age). Due to FEC´s non normal distribution, data was transformed to natural logarithm, Loge (FEC+100) as described in Ciappesoni and others31. Descriptive statistics for both traits are presented in Table 1.
Table 1: Descriptive statistics for fecal egg counts (FEC), Loge (FEC+100) and fiber diameter (FD) for N=19547

Fecal samples were collected from the animal´s rectum using plastic bags, identified, stored with ice gel packs and taken to the laboratory as described at the INIA N°6 Card32. Samples were processed at parasitology laboratories at INIA Tacuarembó, INIA Las Brujas or the Uruguayan Wool Secretariat (SUL, by its Spanish acronym), where FEC were assessed using a modified McMaster technique with a sensitivity of 100 eggs per gram of feces33.
2.2 Genotypic Data
Blood samples were collected by jugular´s vein puncture using tubes with K2 EDTA anticoagulant (BD Vacutainer, USA), and afterwards DNA was extracted according to Medrano and others34 protocol with modifications. NanoDrop 8000 spectrophotometer (Thermo Scientific, USA) was used for DNA quantification and purity evaluation. DNA integrity was checked with a 1% agarose gel with 0.5X TBE buffer (Tris-Borate-EDTA, Thermo Scientific, USA) during 25 minutes at 100V. Finally, DNA samples were stored at -80°C until genotyping.
For this study, genotypes from three different SNP chips were used: 454 animals with 170 SNP (International Atomic Energy)26, 711 animals with 507 SNP (Charrúa Panel, Affymetrix)35)(36 and 383 animals with 50K SNP (Illumina Ovine SNP50 BeadChip v1 and v2, Affymetrix Oviser Axiom 50K). For the 50K chip, 33236 SNP in common between Illumina and Affymetrix platforms were used.
For genomic data quality control the PREGSF90 program was used37)(38 and consisted in the exclusion of sexual markers, monomorphic, minor allele frequency <0.05 and call rate <90%; and the exclusion of individuals with call rate <90%. SNP and individuals after quality control are presented in Table 2. Regarding SNP in common, only the 507 SNP chip has some markers from the 50K SNP chip (91 SNP).
Table 2: Number of SNP and individuals after quality control. G matrix weights (α) and A matrix weights (β) calculated according to VanRaden11 for 50K, 507 and 170 SNP chips

2.3 Animal Welfare
Fecal samples extraction protocol as well as blood extraction protocol were approved by INIA´s Animal Ethics Committee (Approval number INIA_2018.2).
2.4 Statistical Analysis
EBVs were estimated based on phenotypic and pedigree records through BLUP methodology. GEBVs were estimated based on phenotypic and pedigree records as well as genotypes through ssGBLUP methodology. Variance components were estimated using the AIREML algorithm (Average Information Restricted Maximum Likelihood)39) and afterwards used as initial values for EBV and GEBV prediction using BLUPF90 family of programs40.
For breeding values estimation and (co)variance components a univariate animal model was used:
y= Xb + Zu + e
where y is the observations vector for each trait (Loge (FEC+100) or FD); X is the fixed effects incidence matrix; b is the vector of fixed effects; Z is the additive genetic effects incidence matrix; u is the vector of direct additive genetic effects, and e is the residual effects vector. Under the infinitesimal model, it is assumed that u ~𝑁 (0, A σ2 u) with pedigree-based approach, and that u ~𝑁 (0, H σ2 u) with genomic approach (being σ2 u the additive genetic variance) and that 𝑒 ~𝑁 (0, I σ2 e). Fixed effects included in the model were as follows: 467 contemporary groups (birth year, sex, stud-flock, and management group), type of birth (2 levels: unique or multiple), mother´s age (3 levels: 2, 3 and ≥ 4 years) and age at recording as covariate (age at FEC and age at shearing).
H is the relationship matrix that combines pedigree and genomic information and was estimated using ssGBLUP. This matrix inverse was calculated according to Aguilar and others9:
where A-1 is the inverse of the pedigree relationship matrix, G-1 is the inverse of the genomic matrix, and A-1 22 is the inverse of the pedigree relationship matrix of genotyped animals.
G matrix calculation was computed according to VanRaden´s11:
where the weighted G matrix (Gw) is used with a formula that includes the number of SNPs (m):
PREGSF90 program37 uses the same formula but with α and β:
Default values are α=0.95 (G matrix weight) and β=0.05 (A matrix weight). These weights are used for G matrix blending, to make it positive definite so it can be inverted11. Calculated weights for 170, 507 and 50K SNP are presented in Table 2.
The Akaike Information Criterion (AIC)41 was used for model comparison:
where 2ln(L) is the model´s goodness of fit (L is the maximum likelihood), and k is a complexity measurement (number of estimated parameters).
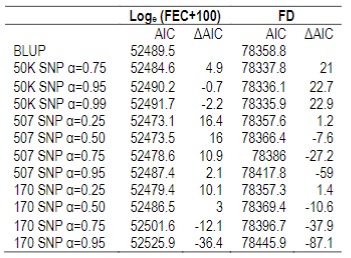
AIC values were estimated with the AIREML algorithm. BLUP and ssGBLUP models were compared with different weights assigned to G matrix, and delta AIC was calculated (ΔAIC; difference between two values). According to Burnham & Anderson42, models with ΔAIC less than 2 are equivalent, between 4 and 7 are somewhat different, and >10 are conclusively different. Afterwards, only models with ΔAIC higher than 10 were considered, this is to say, models where including SNP information showed a difference compared to BLUP.
To understand the impact of these models on the genetic evaluation, EBV and GEBV accuracies were estimated for the different chips, according to Aguilar and others43:
where σ2 u is the additive genetic variance, PEVi is the prediction error variance of animal i and Fi is the inbreeding coefficient.
Afterwards, a paired Student´s t-test was used to check if these accuracies were statistically significant.
Also, correlation between elements outside the diagonal of G and A22 matrices were assessed to detect conflicts between pedigree and the genomic matrix. This correlation is expected to be between 0.5 and 0.9, and values higher than 0.9 show that the information between G and A22 matrices is very similar44.
3. Results
Initially, FEC and FD genetic and residual variances, and heritability estimates were assessed (Table 3), and later used as initial values in breeding values estimation.
Afterwards, AIC for each model was calculated. For FD, only the model with 50K SNP showed ΔAIC values different from BLUP. Furthermore, for FEC this model didn´t show any difference, but the models with 170 SNP and 507 SNP did (Table 4). In the case of models with 507 SNP, the ones with 0.25, 0.5 and 0.75 α values and the model with 170 SNP (with α=0.25) showed differences for this trait.
Table 3: Additive genetic variance (gV), residual variance (rV) and heritability (h2) estimates for Loge (FEC+100), and fiber diameter (FD) with standard errors
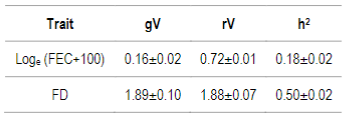
Table 4: Akaike Information Criterion (AIC) and delta AIC (ΔAIC) values for BLUP and ssGBLUP models (with different weights assigned to G matrix) for Loge (FEC+100), and fiber diameter (FD) for 170, 507 and 50K SNP
To explore which of the AIC selected models optimizes trait selection, mean accuracies for the whole population and for genotyped animals were estimated. BLUP estimations were compared to ssGBLUP (with different weights assigned to G matrix) (Table 5).
Table 5: Mean accuracies estimated with BLUP (EBV Acc) and ssGBLUP (GEBV Acc), and percentage increase for all animals (N=37018) and for genotyped animals with 170 SNP chip (α=0.25), with 507 SNP chip (5071 α=0.25; 5072 α=0.50; 5073 α=0.75) or 50K SNP chip (50K1 α=0.75; 50K2 α=0.95; 50K3 α=0.99) for AIC>10 models, for Loge (FEC+100), and fiber diameter (FD). Significant values (*=P<0.05)

No differences between EBV and GEBV were found for the whole population, with mean accuracy values of 0.46 and 0.61 for FEC and FD, respectively. It was observed that EBV mean accuracies were higher for the genotyped group compared to the whole population, but this is not surprising since samples that are selected for genotyping are the most informative animals (rams and dams with many offspring) and this impacts directly on the accuracies.
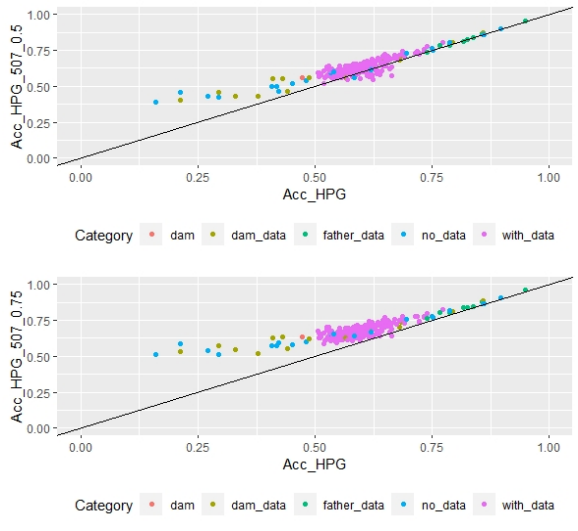
When whole population´s EBV and GEBV accuracies were plotted (for models selected with AIC) it was observed that, for FEC, there were animals that lowered their accuracies when the 170 and 507 SNP chips with α=0.25 were used (Figures 1 and 2), but this tendency decreased when the 507 SNP chip with α=0.5 y α=0.75 was used (Figure 2). The 507 SNP chip with α=0.75 showed the highest increases in accuracies. Concerning dams not genotyped with genotyped offspring, higher accuracies were observed when the 507 SNP chip with higher α was used (Figures 1 and 2).
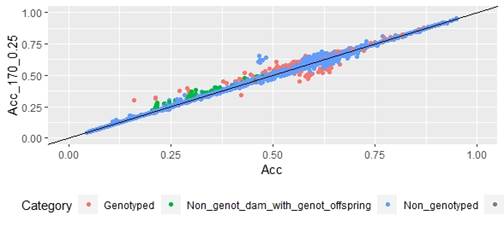
Figure 1: EBV (Acc) and GEBV (Acc_170_0.25 with α=025) correlation for all animals evaluated for FEC trait (r=0.99)
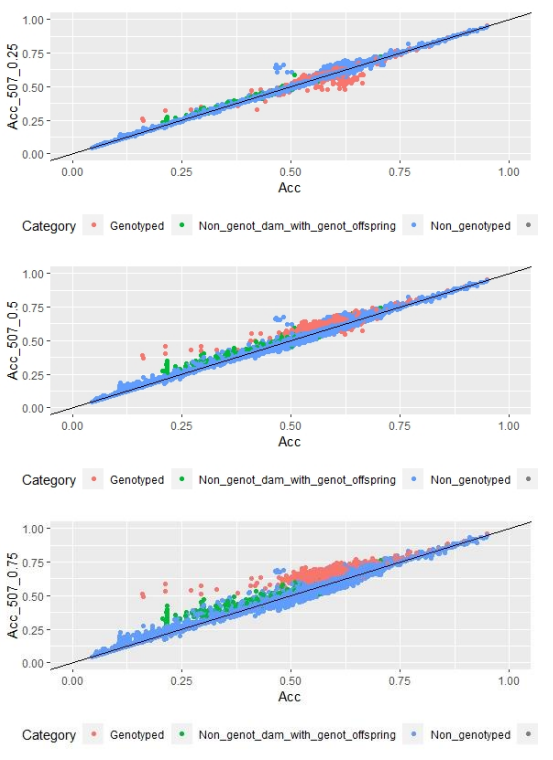
Figure 2: EBV (Acc) and GEBV (Acc_507_0.25 with α=0.25; Acc_507_0.5 with α=0.5 and Acc_507_0.75 with α=0.75) correlation for all animals evaluated for FEC trait with its correlation coefficients (r=0.99, r=0.99, and r=0.99, respectively)
Regarding FD, no differences were observed when different α values were used (Figure 3).
On the other hand, differences in accuracies were observed within the genotyped subset (Table 5). Concerning FEC trait, the 50K SNP chip didn´t increase estimated breeding value mean accuracies, and neither did the 507 SNP chip with α=0.25. By contrast, the 170 SNP chip with α=0.25 and the 507 SNP with α=0.5 and α=0.75 increased GEBV accuracies by 3, 7 and 16%, respectively. These percentages are not comparable between chips since only 3% of animals were genotyped with the three chips.
For animals genotyped with both 170 and 507 SNP chips (n=305) it was observed that for FEC trait accuracies lowered slightly but were still significant for 170 SNP with α=0.25, and 507 SNP with α=0.5 and α=0.75, with 2, 5 and 14% increases, respectively. For 507 SNP with α=0.25 no difference in GEBV accuracy was observed.
Scatter plots for animals genotyped with both 170 and 507 SNP chips for FEC (Figures 4 and 5) showed a strong positive correlation between EBV and GEBV mean accuracies. In addition, it was observed a lower correlation coefficient and a higher accuracy increase when the 507 SNP chip was used and as α was increased. Also, in these plots it can be observed that even though a high proportion of animals increased their GEBV accuracies, others with phenotypic data lowered their accuracies when ssGBLUP was used, both with the 170 SNP chip (with α=0.25) as well as with the 507 SNP chip (with α=0.75). In the case of the 507 SNP chip with α=0.75, only one animal decreased its GEBV accuracy. It was also observed that animals that increased in higher proportion their accuracies were the animals with lower initial accuracies (animals without phenotypic data and dams whose offspring had phenotypic data). The 507 SNP chip (with α=0.75) was the one that yielded higher increases. There was a third group of data that belonged to animals with higher initial accuracies (mostly rams with many offspring that had phenotypic data), that increased their accuracies slightly when the 507 SNP chip (with α=0.75) was used, and practically remained without changes when the 170 SNP chip (with α=0.25) and the 507 SNP chip (with α=0.5) were used.
Regarding G and A22 matrices off-diagonal elements, 0.9, 0.8 and 0.7 values were observed when 170 SNP chip (with α=0.25), 507 SNP chip (with α=0.5) and 507 SNP chip (with α=0.75) were used, respectively.
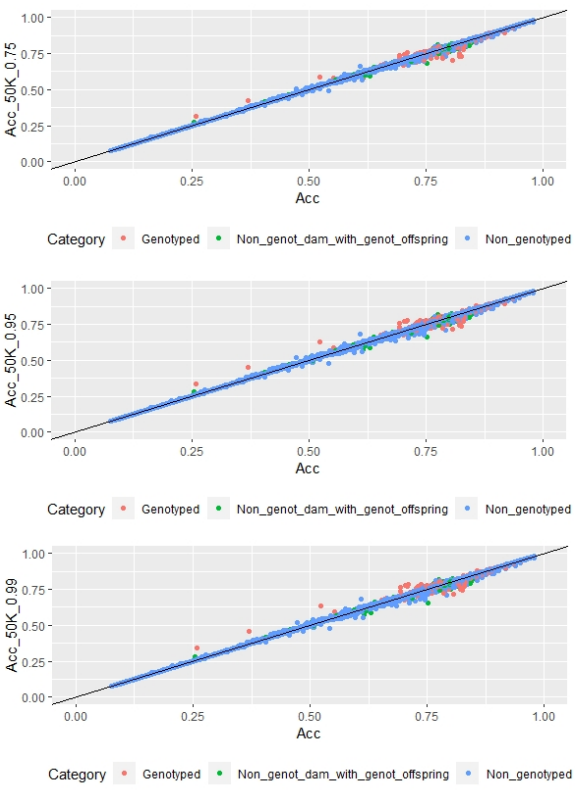
Figure 3: EBV (Acc) and GEBV (Acc_50K_0.75 with α=0.75, Acc_50K_0.95 with α=0.95, and Acc_50K_0.99 with α=0.99) correlation for all animals evaluated for FD trait with its correlation coefficients (r=0.99, r=0.99 and r=0.99, respectively)
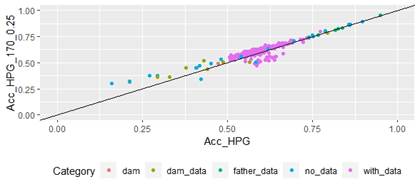
Figure 4: Correlation of EBV (Acc_FEC) and GEBV accuracies (Acc_FEC_170_0.25 with α=0.25) for genotyped animals with the 170 SNP chip, evaluated for FEC trait (r=0.93)
4. Discussion
Molecular contribution to genetic improvement has been widely studied for more than two decades with the objective of increasing the rate of genetic progress. Initial strategies were based on using a few molecular markers associated to the trait of interest (marker assisted selection), but this approach didn’t progress due to the polygenic nature of most economically important traits, and therefore, phenotypic effects were too small to be statistically significant45. Further developments have expanded this concept through the identification of thousands of known SNPs. Commercially available high-density genotyping arrays and different analysis models have made genomic selection implementation possible. One of these models, ssGBLUP, has allowed improvements in GEBV accuracies in sheep production traits compared to BLUP traditional model23)(24)(25.
Since genotyping costs in sheep are quite high relative to the animal´s economic value, other alternatives were sought, like the use of low-density SNP chips like the ones that were used in this study.
One way to compare models is cross-validation, where the population is divided in two subsets: training and validation, but in this work, the low number of genotyped animals didn´t allow the use of this methodology and instead AIC was used. In 2014, Bernal-Vasquez and others46 compared cross-validation and AIC, and found that both methodologies selected the same models; therefore, AIC could be used as a reliable alternative method. The AIC methodology allowed to select those models that optimized FEC and FD traits compared to BLUP traditional model, that uses only genealogical and phenotypical information. FEC models with 170 SNP chip (with α=0.25) and 507 SNP chip (with α=0.25, α=0.5 and α=0.75) were found to be better than the traditional model. By contrast, using the 50K SNP chip model for FEC showed no difference to traditional model (ΔAIC<10). For FD, only models with 50K SNP chip with α=0.75, α=0.95 and α=0.99 were better than the traditional model.
When GEBV accuracies were estimated for the whole population for those models previously selected with AIC, no differences in mean accuracies were observed with the use of molecular information, probably due to the low percentage of genotyped animals compared to the total evaluated population (between 0.8 and 1.7). Nevertheless, an increase could be observed in dams not genotyped, but which had genotyped offspring, and in genotyped animals, mostly when the 507 SNP panel with higher α was used.
For the genotyped subgroup, significant differences in mean accuracies were observed in all models selected with AIC, except the 507 SNP chip model (with α=0.25) for FEC trait and all 50K chip models for FD trait. In the case of FD, the 50K SNP chip didn´t increase mean accuracies probably due to the low number of genotyped animals (0.8%), and also because FD is a trait with higher heritability compared to FEC (h2=0.50 versus h2=0.18), so the margin to increase accuracies is much lower. FEC and FD reported heritability estimates for this study agree with previous ones in Corriedale breed in Uruguay30)(47)(48. Heritability is a factor that influences estimated breeding value accuracy: higher trait heritability, higher accuracies.
With the inclusion of the 170 SNP chip in the genetic evaluation a 2% increase in GEBV mean accuracies was observed. Regarding the 507 SNP chip, GEBV mean accuracies increased 5 and 14% when 0.5 and 0.75 G matrix weights were used. In addition, it was observed that animals with lower initial accuracies were the ones that increased their accuracies to a larger extent, and that animals that benefited less were the ones that already had higher accuracies. This study shows that the use of the 507 SNP chip increased GEBV mean accuracy, and those increases where enhanced with higher G matrix weights. These estimates are lower than the ones reported by other authors for GIN resistance; for example, Torres and others25 reported EBV accuracy increases from 0.046 to 0.073 when ssGBLUP was used compared to BLUP, but in that study a 50K SNP chip was used, therefore, with higher SNP density. The 170 and 507 SNP chips are low-density arrays, so they have low genome coverage, and they can´t be used for genomic selection where the premise is that a great number of SNP distributed across the genome are in linkage disequilibrium with genomic regions associated to quantitative traits7. This agrees with a study done in fish populations where prediction accuracies were calculated using different low-density chips, and they found that arrays with less than 1000 SNP show a sharp decrease in accuracies as well as in estimated heritability49. The only chip utilized here that could be used for GS is the 50K array, but no significant differences were observed in mean GEBV accuracies, probably due to the low number of genotyped animals.
But which could be the reason for the increase in mean accuracies when the 170 and 507 SNP chips were used? EBV accuracy measures the quantity of information used in the prediction of that breeding value (own performance and family performance), and when genomic information is added, the quantity of information increases due to a better capture of family relationships. SNP based pedigree includes information on unrecorded pedigrees and on Mendelian sampling12, which translate in better accuracies in the estimations. The 507 SNP chip, with α=0.75, better performance could be related to the higher weight given to the molecular information (G matrix) compared to the pedigree (A matrix). Also, even though the 507 SNP panel is a low-density panel, it is 2.5 times denser than the 170 SNP panel, so theoretically there are more chances for SNPs to be in LD with QTLs related to FEC resistance.
According to Lourenco and others44, the correlation between elements outside the diagonal of G and A22 matrices is expected to be between 0.5 and 0.9, and values higher than 0.9 indicate that both matrices are very similar, thus a small gain in accuracy is expected. In this study, the 170 SNP chip (with α=0.25), the 507 SNP chip (with α=0.5) and the 507 SNP chip (with α=0.75) show expected values, but the lower value for the 507 SNP chip (with α=0.75) indicates higher differences between G and A22 matrices, thus a higher gain in accuracy would be expected.
5. Conclusions
It is possible to increase GEBV accuracies for GIN genetic resistance with the use of the 170 SNP identified by Periasamy and others26, and mainly with the 507 SNP chip with a 0.75 G matrix allocated weight. In the current study increases were observed only on genotyped animals, not in the whole population. To evaluate changes in this population it would be necessary a much greater number of genotyped animals.
Genomic selection in the sheep industry is only possible nowadays in a few developed countries. However, it is expected that more countries incorporate it to their National Genetic Evaluations, mostly in difficult to measure or low heritability traits. This is going to be possible as genotyping prices get cheaper and more animals could be genotyped. This will allow building an adequate training population with enough quantity of genotyped animals with medium-density chips (50K SNP) to be able to apply genomic selection to the National Genetic Evaluations. GS main strength is that it allows increasing GEBV accuracy in young animals that still do not have their own phenotypic data. Therefore, this study is a first approximation to the incorporation of genomic data about Corriedale´s genetic evaluation in Uruguay, that shows that it is possible to increase breeding values mean accuracies even with the use of low-density chips. More research is needed with more genotyped animals and higher density chips to implement genomic selection in this population.


