


 English (pdf)
 Article in xml format
 Article references

 Permalink
1. Introduction
The health-promoting properties of fruits and vegetables are well stablished in many epidemiological investigations. Lower risk of chronic diseases due to fruits and vegetables consumption is associated mainly to the dietary fiber and bioactive compounds contents. Specifically, some of these compounds have high antioxidant activity that avoid oxidative stress, not only in vegetable tissues, but also in animals through the digestion. It is therefore important to recognize which fruits and vegetables have the highest contents with more antioxidant capacity potential, for improving their quality and introducing them regularly into the diet.
Basal information on bioactive compounds in fruits and vegetables in several countries or governmental regulatory services is published on food data composition tables1)(2. Phenolic compounds comprise a major group3. Due to a wide variety of molecules that are included in this group, individual characterization is difficult in complex matrices. Nevertheless, flavonoids have been studied extensively recently and research has repeatedly found that foods with high content of them correlate with better health indicators4)(5. Flavonoids, like anthocyanins and quercetin, and carotenoids have different biochemical properties, mainly because the first are hydrophilic and the latter lipophilic. These compounds may contribute not only to improve color or visual aspect, but also to organoleptic characteristics, effect of cooking methods or industrialization procedures. In regard to health benefits, the contribution is also diverse, and many reviews address the investigations in the area. Effects of groups of compounds are described in general: anthocyanins6, carotenoids7 and flavonoids8; as well as for micronutrients and/or action mechanism specifically. Even in pandemic situation, the role of quercetin, for example, in prevention and treatment of SARS-CoV-2 related disease was recently reported.9)(10
Antioxidant capacity, as a predictor of the nutraceutical potential of food, can be quantified through the antioxidant activity in vitro analysis. The most largely used are the following: antioxidant capacity with 2,2’-azino-bis-(3-ethylbenzothiazoline-6-sulfonic acid) (TEAC/ABTS); radical scavenging capacity ferric ion reducing antioxidant power (FRAP), 2,2-diphenyl-picrylhydrazyl (DPPH), and oxygen radical absorbance capacity (ORAC). The ORAC analysis demonstrated some technical advantages and may be more accurate and specific11. However, for overall antioxidant characterization it is recommended to employ more than one in vitro assay when complex biochemical matrices are investigated. Finally, assessing in this way the antioxidant capacity of a given food does not imply that the total activity of its antioxidant compounds will become bioavailable to the organism and to benefit health. So, determining the antioxidant bioactive compounds content and antioxidant capacity in fruit and vegetables is critical for understanding their potential dietary benefit and/or the effect of several factors, such as genetics, environmental, cultural management and industrial processing, on them. To the best of our knowledge, this study represents a comprehensive screening of micronutrient composition and antioxidant capacity of fruit and vegetables under investigation in Uruguay.
2. Materials and methods
2.1 Fruit and vegetable samples
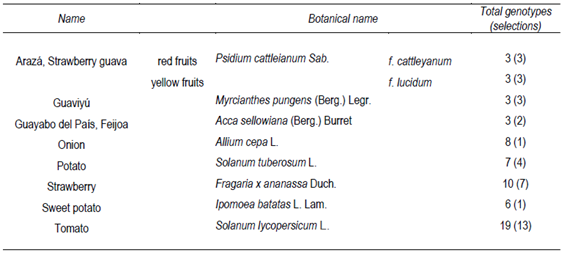
Different genetic varieties or selections of fruit and vegetables were sampled according to Table 1. All of them belong to the Breeding Programs at the National Institute for Agricultural Research (INIA) in two locations: Las Brujas and Salto Grande. Native fruit orchards were conducted only at Las Brujas (W. Ferreira Aldunate Station) in southern Uruguay.
The samples were harvested from plants that had great performance in terms of production and sanity, at commercial maturation range. A representative amount of approximately 2-3 Kg of fruit and vegetable of each genotype in three repetitions was collected and transported to laboratory. The arazá and guaviyú native fruits were separated in edible parts and seeds, and the edible parts were homogenized using a blender during 1 min. The homogenate was immediately frozen at -80 °C until micronutrient and antioxidant analyses. As regards guayabo del país, onion and sweetpotato, samples were peeled before homogenization.
2.2 Bioactive compounds analyses
The homogenates samples (0.2 g) were mixed with 1 mL of methanol/water solution (80:20, v/v) to micronutrient extraction. The samples were placed in an ultrasonic bath during 10 min at 20 °C and stored at 20 °C avoiding light exposure. Then they were centrifugated at 12,500 rpm during 5 min, and the methanolic extract was diluted if necessary and used for subsequent analyses. L-Ascorbic acid (corresponding to vitamin C) and total phenolic content were evaluated according to integrated microplate method12. In brief, 15 µL of methanolic extract were diluted with 240 µL milli-Q ultrapure water, and 15 µL of Folin-Ciocalteu reagent was added. The 96 well microplate was agitated in a multi-mode microplate reader with two independent dispensers Synergy HT1 (BioTek Instruments Inc., Winooski, VT) and incubated for 3 min. The absorbance at 765 nm was determined and the vitamin C concentration estimated against ascorbic acid standard curve. The results were expressed as mg of ascorbic acid per 100 g of fresh fruit or vegetable weight (FW). The assay was continued by adding Na2CO3 in the microplates wells and incubated for 2 h at room temperature in the dark to determine total phenolic content in the samples. The absorbance at 765 nm was measured again and values were compared to gallic acid standard calibration curve. The results were expressed as mg of gallic acid equivalents (GAE) per 100 g FW.
Anthocyanins content estimation was based on a pH differential method described previously13 and modified according to Ferrari and others14. In 96 well microplates 40 µL of methanolic extract was diluted with 200 µL of potassium chloride pH 1.0 (0.025 M) or sodium acetate pH 4.5 (0.4 M) buffers. Absorbance values at 520 nm and 700 nm were used to calculate anthocyanins concentration as mg cyanidin 3-glucoside per 100 g FW.
For quercetin determination 1.0 g of homogenized sample were mixed with 4.0 mL of acidified methanol:water solution (80:20; HCl 1.98 N). Tubes were vortexed and incubated in bath at 90 °C for 30 min. After decantation, the supernatant was transferred to other tube and final volume adjusted to 5.0 mL. The extracts were neutralized (NaOH 1.0 N) and 100 µL aliquots dispensed in 96 wells microplates. Milli-Q water (150 µL) and 50 µL AlCl3 (10 %) were added to color development. Absorbance at 420 nm was measured using the same microplate reader described before. The quercetin content was calculated based on a calibration curve established with the same analytical standard. The results were expressed as mg quercetin per 100 g FW.
Carotenoids content was estimated as previously reported15, with minor modifications. Briefly, 1.0 g of homogenized samples were mixed with 5 mL acetone/BHT (0.1 %) and vortex. Then the solutions were sonicated for 10 min and centrifugated at 10.000 rpm. The supernatant was transferred to other tube, the extraction step was repeated twice, and the final volume adjusted to 25 mL. Absorbance was measured at 450 nm (A450).
The carotenoids concentrations (C) were estimated from equation 1.
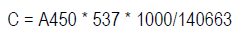
Calculation was based on Lambert law with β-carotene molar weight (537 g.mol-1) and extinction coefficient (140.663 M-1.cm-1). The results were expressed as mg β-carotene per 100 g FW.
2.3 Antioxidant in vitro analyses
The same extraction procedure in methanol:water solution (80:20 v/v) was used to obtain methanolic extracts for the DPPH and ORAC assays.
The quantification of free radical-scavenging of DPPH (2,2-diphenyl-1-picrylhydrazil) was performed mixing an aliquot of appropriated diluted extract with DPPH solution (125 mM) in methanol:water (80:20, v/v) in 96-well microplates. The mixture was shaken and incubated for 24 h at 20 °C in the dark. The reduction of absorption was measured at 517 nm and quantified using a Trolox standard curve. The results were expressed as µmol Trolox equivalents (TE).100 g -1 FW.
The hydrophilic ORAC analysis was conducted according to methodology described by Held16 and Ou and others17 with some modifications. Briefly, an aliquot of the diluted methanolic extracts or standards solutions of Trolox (0 to 100 µM) were transferred to 96 well-microplates. The plate was placed in the microplate reader and fluorescein solution (0.008 µM) prepared with 75 mM phosphate buffer was added using the automatic dispenser. After incubation at 37 ºC for 30 min, AAPH (153 mM) prepared freshly with 75 mM phosphate buffer was added to each well. The plate was agitated, and the decay of fluorescence was monitored continuously every 1 min for 60 min. The AUC of the oxidation of fluorescein was determined at wavelengths set in 485 nm for excitation and 528 nm for emission. The results were estimated using software Gen 5™ (BioTek Instruments, Inc., Winooski, VT) and the ORAC activity was expressed as µmol of Trolox equivalents (TE) 100 g-1 FW.
2.4 Statistical analyses
The results were expressed as mean of duplicate or triplicate according to the analysis and coefficient of variation (CV) in percentage. Minimum and maximum values were also evaluated. The statistical analyses were determined using Infostat Software18. Variance analysis (ANOVA) and Tukey´s test were performed to identified significant differences between species with a significance p ≤ 0.05. Correlation analysis between variables studied was carried out with the same statistical program.
3. Results and discussion
3.1 Bioactive compounds composition
The results for the determination of ascorbic acid and total phenolics compounds are in Table 2. Strawberry fruits (n = 10) contained the highest ascorbic acid concentration at 178.12 mg.100 g-1 FW (p <0.0001), followed by native fruits (71.02 mg.100 g-1 FW in average) and tomato (51.32 mg.100 g-1 FW). On the other hand, onions, potatoes and sweet potatoes contained relatively low amount of ascorbic acid as compared to the fruits group. The mean concentrations obtained in this study were similar to those reported in bibliography19, although the data cannot be directly compared due to the incidence of genotypes, agroecological and cultural conditions, among others.
Table 2: Ascorbic acid and total phenolic compounds contents of fruits and vegetables analyzed
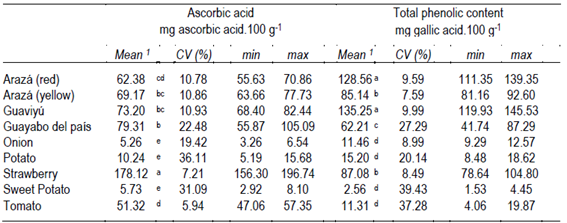
1Mean as average and coefficient of variation (CV %) in each fruit and vegetable specie is presented. min and max correspond to minimum and maximum values determined, respectively. Values with different letters by the same column are significantly different (p < 0.05).
Table 2 also presents total phenolic content (TPC) in fruit or vegetable sample extracts. The highest TPC was found in guaviyú fruits (135.25 mg GAE.100 g-1 FW) and arazá red (128.56 mg GAE.100 g-1 FW) with p = 0.0001; followed by the others native fruits and strawberries. Arazá yellow and guayabo del país mean TPC values were 85.14 and 62.21 mg GAE.100 g-1 FW, respectively. It is interesting to note that in all cases relatively high standard deviations in ascorbic acid and TPC values were found. Relatively high or low average ascorbic acid and total phenolic contents presented different coefficient of variation. Concentrations in arazá, guaviyú and strawberries genotypes result less variable than in the other fruit and vegetables analyzed. By contrast, in values of guayabo del país, potato and sweet potato high variability were found (CV >20%). In onion and tomato each parameter showed different variability. According to our sampling and analytical conditions, these differences could directly be due to genetic variations. Thus, some genotypes in each fruit or vegetable could be used as promising lines for improving ascorbic acid or total phenolic contents. Nevertheless, annual or productive cycles repetitions are needed to confirm these results.
Table 3 shows the mean anthocyanins, quercetin and carotenoids contents of fruits and vegetables found above the limit of quantitation. As expected, red/violet-colored fruits samples had significantly high total anthocyanins content. In guaviyú (n=3) and strawberry (n=10) fruits were estimated at 45.90 and 21.79 mg cyanidin-3-glucoside.100 g-1 FW, respectively. These values are in accordance with those reported in literature for fruits and strawberries20)(21.
Quercetin concentrations were determined only in onion extracts. The mean value was 17.51 as mg quercetin.100 g-1 FW with a standard deviation of 4.88. These values are in accordance with those reported in bibliography22. According to the high content found in onions and eating habits (average daily uptake to 10-100 mg quercetin)23, it is easier to reach daily requirements. So, the selection of genotypes for improving quercetin content could be useful in our country, as South America has the lowest levels of consumption of flavonoids8.
Table 3: Micronutrient content of fruits and vegetables analyzed

1 Mean as average and coefficient of variation in percentage (CV%) in each fruit and vegetable sample is presented. min and max correspond to minimum and maximum values determined, respectively.
Potato genotypes contained low concentrations of carotenoids (0.12 mg β-carotene.100g-1), but differences between varieties were found. The mean carotenoids content determined as β-carotene was higher in sweet potato genotypes with maximum value of 11.23 mg β-carotene.100 g-1 FW. Sweet potatoes also presented high variability value (CV = 91.79%) due to the differences in composition that correspond with the color of flesh. The higher values found in varieties with yellow and orange color of flesh are in the range of green leafy vegetables and carrot concentrations, that are consider the mainly human diet intake of carotenoids and β-carotene1)(20. Although the mean carotenoids content in tomato samples is similar to that determined in sweet potato, the variability between varieties was lower. In addition to the differences between the total content of carotenoids, these three species showed different carotenoids profiles24. Potato, sweet potato and tomato varieties were predominantly constituted for lutein/zeaxanthin, β-carotene and lycopene, respectively. Therefore, a detailed profile characterization could improve the investigation about variability in genetic breeding.
3.2 Antioxidant activities
Total antioxidant activity assays of fruits and vegetables are presented in Figure 1. The different species performed distinctly (p < 0.0001) and fruits had mainly the highest values in both analyses. These results are in accordance with other studies25 and reinforce the fact that native fruits constitute an outstanding source of bioactive compounds that possess high antioxidant activity. The DPPH mean values were 3235.9, 2587.7, 2903.5 and 1919.1 µmol TE.100 g-1 for arazá red, arazá yellow, guaviyú, and guayabo del país, respectively. Also, the values presented high variability in these fruit native species even when only three genotypes were analyzed in each. In strawberry (n=10), sweet potato (n=6) and tomato (n=19) genotypes the lower DPPH mean values were found. The variability between genotypes in these species was low.
The ORAC values of antioxidant extracts were represented in Figure 1B. The arazá red, arazá yellow, guaviyú and strawberry extracts showed the highest values with statistical significance (p<0.0001). The ORAC values were 3088.4, 3093.7, 3002.68 and 3026.0 µmol TE.100 g-1, respectively.
It is interesting to note the antioxidative activity demonstrated in guayabo del país and strawberry extracts. The specificity and sensibility of each method provide different relative levels of activity. Hence, the combination of DPPH and ORAC assays supply a reliable assessment of the antioxidant properties of fruits and vegetables, but it is not possible to asseverate absolute values. Nevertheless, the values of relative antioxidant activity between genotypes of the same species and the contribution of specific antioxidant compounds could be achieved.
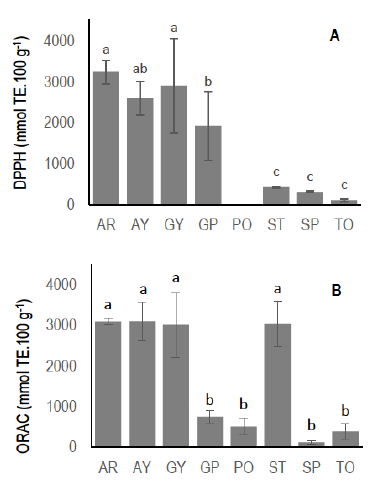
Figure 1: Total antioxidant activity of fruit and vegetables measured by DPPH (A) and ORAC (B) assays. AR: Arazá (red); AY: Arazá (yellow); GY: Guaviyú; GP: Guayabo del país; PO: Potato; ST: Strawberry; SP: Sweetpotato; To: Tomato
Correlations between bioactive compounds studied and antioxidant capacities are presented in Table 4. Positive correlations between ascorbic acid, TPC, DPPH and ORAC were found. DPPH presented a positive correlation with TPC (n=55, r=0.75, p<0.0001), but there was no correlation with ascorbic acid (n=55, r=0.02, p=0.87). Probably due to the mechanism reaction, ascorbic acid is unsuitable for DPPH free radical scavenging and its bioactivity does not contribute with the total antioxidant activity. However, the significant correlation between ascorbic acid and ORAC (n=62, r=0.69, p<0.0001) suggests that in fruits and vegetables under our investigation ascorbic acid contributes to the antioxidant capacity determined by the ORAC assay.
High correlation between ORAC and TPC values were also found (r=0.88, p<0.0001). This strong correlation is in accordance also with other studies26.
Table 4: Correlation relationship between variables
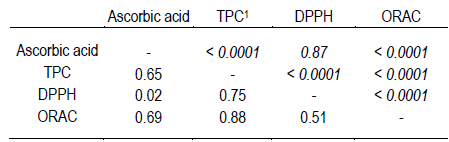
1 Total phenolic content. Represented as matrix r\p, with correlation coefficients\and the corresponding significance values indicated.
The results also indicated that antioxidant capacity varied depending on the assay applied. Furthermore, different analytical approaches are required to characterize the antioxidant capacity and the correlation with the lipophilic bioactive compounds, as carotenoids or tocopherols. Although their relatively low concentrations in fruit and vegetables found in this study, significant differences between genotypes in each species could affect the total potential antioxidant capacity. So, by eating a fruit and vegetable varied diet in accordance with the health recommendations, it is possible to access to nutraceutical compounds with different metabolic effects. Despite studies that have advanced details on the composition of foods, there are still many limitations in the literature on the ingestion of phenolic compounds. The studies do not use the same databases, many foods do not have their phenolic compounds identified, and there are differences in analytical methodologies. Further, it is remarkable that native fruits and some genotypes developed in INIA Breeding Programs have a high ranking on nutraceuticals and potential antioxidant capacity, indicating that each country needs to establish its own data for plant nutrients.
4. Conclusions
The analyses revealed a highly varied content of bioactive compounds and great health-promoting potential significantly depending on the fruit or vegetable analyzed. Additionally, the nutritional characterization of all tested selections or varieties of each cultivar turned out to be a useful tool to the genetic breeding programs and to elucidate the major contributor of antioxidant capacities, providing information for the consumers.

