


 Inglés (pdf)
 Articulo en XML
 Referencias del artículo

 Permalink
1. Introduction
Climate change is modifying the rainfall distribution in some regions, with an increase in extreme events1, being less effective in meeting the crop water demand. Agriculture is highly dependent on climatic conditions, mainly on rainfall, causing great variability in the yields and producers' income. Supplemental irrigation increases and stabilizes production, mainly in years with low rainfall2. However, producers do not invest in irrigation in conditions of humid temperate climate due to production costs and fluctuating prices of soybean and other crops3. In addition, the energetic cost to extract, distribute and apply irrigation water requires evaluating different strategies for optimization4. According to Izquiel5, any strategy that minimizes electricity costs will be accepted, either with tools that optimize the design of water distribution and pumping stations, or by helping the management of the irrigation system.
Limited or deficit irrigation is a more profitable and more environmentally sustainable strategy that improves water productivity, and stabilizes and increases the yield of various crops6, with less water use7)(8. However, the effectiveness of deficit irrigation to improve production and reduce irrigation costs depends on the availability of information on the response of crop yields to water stress.
Some deficit irrigation strategies are based on meeting the demand during the most sensitive periods of the crop and irrigating in a deficit way in less sensitive stages, Controlled Deficit Irrigation (CDI)9)(10; others provide a percentage of ETc throughout the crop cycle, Sustained Deficit Irrigation (SDI)1)(3)(11)(12, or combinations of both strategies13)(14)(15. These studies report on the response of soybean crops to deficit irrigations; however, they do not indicate the irrigation depth for the design of the irrigation equipment, for each strategy.
Irrigation equipment that fully covers the water requirement of the crop requires higher investment and operating costs. Equipment designed based on average water requirements lower than that of the crop, with lower capacity and irrigation depth applied has the risk of not meeting the demand and could affect the crop yield16. In arid climate conditions, this probably occurs, however in humid climates with rainfall in the growing season, it will depend on the rainfall characteristics and their timely occurrence. Furthermore, when irrigation is applied at rates below the ETc, the crop uses the soil water reserve to compensate for the deficit.
It is possible to meet the crop demand with equipment that applies irrigation depths below the ETc, if the soil stores enough water and rainfall timely recharges the soil, in this way transpiration will not be affected8. For this, soils must have good water storage capacity, which may not happen in Uruguay's conditions17. Therefore, it is necessary to evaluate the effect of different irrigation depths on the response of the soybean crop that allow defining the dimensioning or design of the irrigation equipment.
Soybean is the main summer crop in Uruguay and it is mostly rainfed; however, the yield gap compared to those with supplementary irrigation is very wide. Irrigation can duplicate the yields in years with water deficit and in years with abundant rainfall in the growing season, it may increase the yield 30% above the rainfed crops18. The average soybean yields of the last 15 years in Uruguay are around 2.0 tt ha-1 in commercial rainfed crops. With irrigation, the data of the last 5 years indicate an average of 3.4 tt ha-1 with a yield increase between 18 to 137% compared to rainfed18)(19)(20)(21)(22. In the United States, one of the main soybeans producing countries, the average yields vary between 2.9 and 3.9 tt ha-1 in non-irrigated and irrigated commercial crops, respectively, while at the experimental level the maximum yields are between 6.0 and 7.0 tt ha-1(23.
The rainfall regime in this region does not allow a constant supply of water24, generating conditions of water deficit during the crop growth, limiting potential and stable yields25.
This study aims to evaluate the use of different maximum daily irrigation depths on soybean production in southern Uruguay. The different irrigation depths applied will determine a differential use of rainfall, and lower irrigation water requirements, affecting irrigation operating costs. Each irrigation depth simulates the effect of irrigation equipment designed to apply said depths. Applying irrigation in this way allows covering the water requirements of the early stages, which are lower, with irrigation or rainfall. As the crop grows, along with its water consumption, the smaller irrigation depths will stop meeting the demand and the crop will make use of the limited reserve of the soil. As of that moment, different levels of water depletion will occur even below the threshold. Upon reaching the critical period and depending on rainfall, the different treatments will have different moisture content in the soil, generating different levels of water stress in the plant.
This study focuses on improving the design and management of irrigation equipment used in soybean, improving the efficiency of water use in soybean production in Uruguay.
2. Material and methods
2.1 Experimental site
Soybean cultivation was established in the experimental field of the Agronomy School, South Regional Center, Canelones, Uruguay (34°37'S and 56°13'W), in the 2014/15 and 2015/16 seasons (Year 1 and Year 2, respectively). The experiment was carried out in a Typic Argiudoll26 or Typic Eutric Brunisol Lac. soil, from the Tala Rodríguez Soil Unit27. Table 1 presents information on its hydric properties.
Table 1: Physical and hydric characteristics of the test soil
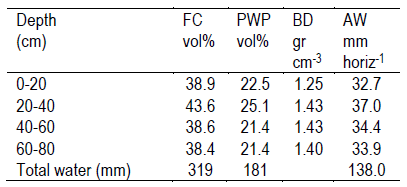
FC: Field Capacity; PWP: Permanent Wilting Point; BD: Bulk Density; AW: Available Water; vol%: volumetric percent
The infiltration rate measured with the double ring infiltrometer was 8.8 mm h-1.
A root depth of 0.80 m was defined because the soil does not physically impede soybean crops to explore. Dardanelli and others28 indicate that the maximum absorption is at 180 cm in deep soils without physical impediments. The soils in the experiment have a maximum explorable depth of 80 to 90 cm.
This area is classified as having a moderate temperate climate29 with no dry season and hot summer. The average annual rainfall is 1200 mm with high interannual variability and annual irregularity. The average summer temperature varies between 18 and 23 °C, while the average radiation varies between 400 and 580 cal cm-2 day-1, with an average humidity of 72%. The meteorological variables of interest during the soybean growing season will be presented in the climatic characterization of the experiment.
2.2 Experimental design
The treatments were: Rainfed: only rainfall; 3 mm: maximum depth 3 mm day-1; 6 mm: maximum depth 6 mm day-1, and 9 mm: maximum depth 9 mm day-1. Each irrigation depth indicates the maximum daily replacement capacity with irrigation.
A randomized complete block design with four replications was used for the experiment. The plots were 12×6 m in size, without empty spaces, to avoid edge effects that generate different microclimatic conditions within the experiment (oasis effect). The total experimental area was of 1152 m2.
2.3 Crop management
The soybean cultivars used were 6262 IPRO (medium cycle), Don Mario in Year 1 and 5258 Nidera Semillas (short cycle) in Year 2. The no-till sowing dates were December 11, 2014, and November 23, 2015.
Before sowing, seeds were inoculated with strains of Bradyrhizobium elkanii plus Bioprotector ADD-IT BLUE (commercial product, Biopack LIKUIQ, from Lage y Cia. SA) at the dose recommended by the manufacturer.
The sowing density was 380 thousand plants ha-1, 0.38 m between rows and approximately 15 plants per linear meter. Each plot had 16 rows of 12 m in length.
To avoid nutritional restrictions, the sowing was fertilized with 120 kg ha-1 of P-PO4, using triple calcium superphosphate (0-46-46-0) as fertilizer. Herbicide was applied pre and post-sowing to eliminate competition for space and nutrients.
2.4 Irrigation management
Drip irrigation was used to precisely apply the different irrigation depths. The equipment allowed to independently manage the irrigation times of each treatment. The lateral drip holders were placed every 0.50 m, with 4 l h-1 drippers every 1.0 m arranged in a staggered pattern to improve water distribution. The application rate was 8 mm h-1, below the infiltration rate of the soil. The uniformity coefficient (UC) of the equipment30 was higher than 90%.
Irrigation was applied every two or three days, replacing the accumulated depths from the previous days, corresponding to each treatment. For example, if the sum of the irrigation needs of the crop was 13 mm in the two days before irrigation, 3 mm received 6 mm, 6 mm received 12 mm, and 9 mm received 13 mm.
To define the moment and the amount of water to apply, a daily water balance was made, according to FAO 5631. The water balance began with the soil at Field Capacity, regarding the pre-sowing precipitation (PP) or complementing with sprinkler irrigation. Climatic data were taken from the meteorological station of the INIA Las Brujas Experimental Station, located 12 km from the experiment. The PP was measured locally with a rain gauge in the experimental site, placed in compliance with standardization norms.
The adjusted evapotranspiration (ETc adj) was calculated daily (Eq. 1). The cultivation coefficients (Kc) used are those recommended by FAO31 since local information is not available.

Where:
ETc adj: Adjusted ETc (mm day-1)
ETo: Reference crop evapotranspiration (Penman-Monteith modified by FAO31)
Ks: stress coefficient, maximum value 131
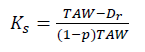
Where:
Dr: Moisture depletion in root zone (mm)
TAW: Total available water in root zone (mm)
p: Fraction of the TAW that the crop extracts without suffering water stress (irrigation threshold)
When irrigation or PP do not cover the demand of the crop, a moisture deficit (Dr) accumulates in the soil. If the deficit exceeds the threshold (Ks <1), the crop adjusts its water consumption due to stomatal adjustment processes. The consumption reduction is given by the relationship between the cumulative deficit and the readily available water (RAW= (1-p) * TAW; Eq. 2). If Ks = 1, there is no adjustment and the ETc adj will be equal to the ETc; if the Ks(1, the ETc adj will be lower than the ETc31.
Tabulated "p" values of the FAO manual 5631 were used and corrected by ETc, according to the adjustment equation, p = p table + 0.04 × (5 - ETc). For soybean, "p" is 0.50, and it was adjusted when ETc exceeded 5 mm day-1. The value of "p" estimates the RAW, which is the minimum amount of water in the soil for the crop to be in hydric comfort.
To estimate the PPeff., the mm necessary to cover Dr at the time of the PP were considered effective. The water content between saturation and FC in the first 20 cm of the soil is 28 mm, for this soil. If the PP exceeded the soil moisture deficit by 28 mm, the surface horizon was considered to be saturated. If this happened, 48 to 72 hours were allowed for the natural drainage to return the soil moisture to FC. To corroborate the soil humidity, a drill field control was carried out. PP lower than 20% of the ETo was discarded31.
Irrigation requirements were estimated by correcting the ETc adj by the equipment UC and by the application efficiency (Ae). Irrigation management with reduced depth and application intensity lower than the infiltration rate of the soil did not generate surface runoff or detectable deep percolation, retaining the applied water in the root depth, therefore, the Ae was considered to be close to 100%.
2.5 Measurements
2.5.1 Soil moisture
Soil moisture was measured two to three times a week. For this, in the central testing area, 1-meter-deep aluminum access tubes were placed in two of the four replications, for a CPN neutron probe (model 503-DR Hydrprobe, Campell Pacific Nuclear Corp., CA, USA) to measure in four depths: 0 to 20 cm, 20 to 40 cm, 40 to 60 cm, and 60 to 80 cm. The probe was calibrated for each soil horizon against the humidity measurements obtained with the gravimetric method, following the methodology of Haverkamp and others32, and Puppo and others33. The sampling included moisture contents that cover the range of moisture that can be measured in the test, achieving a good calibration adjustment in all horizons.
2.5.2 Crop development
Based on plant observation, the phenology of the crop was evaluated using the Fehr and others scale34; Fehr and Caviness35.
One of the key stages in defining soybean crop yield is the critical period (CP), which occurs from the beginning of R4 to R6, inclusive.
To evaluate the aboveground biomass, the aboveground part of the plants was extracted from one linear meter per plot every 15 or 20 days. Samples were not extracted from the six central rows so as not to alter the sowing density, since the final crop yield was evaluated in the central rows. For the final aboveground biomass, sampling was carried out in stages R5.5, before the beginning of leaf fall. The samples were dried in an oven at 60 °C until constant weight.
2.5.3 Yield
The grain yield was evaluated by harvesting three subsamples of 2 m2 each, in the six central rows, reaching a harvest area of 6 m2 per plot. Grain yield, weight of 1000 grains and number of grains per square meter were measured. The harvest index (HI) was estimated as: dry grain weight/total dry matter. Harvest grain moisture was evaluated using a grain moisture analyzer (Multi-grain, Dickey-John). The grain weight was corrected to a humidity of 14%.
The harvest dates were May 7, 2015, and April 22, 2016, for Years 1 and 2, respectively.
2.6 Productivity indicators of water use by crops
To evaluate the different irrigation strategies proposed, different indicators of water use efficiency were estimated. The combination of indicators can inform about the most appropriate management strategies36. The consumed water use efficiency (CWUE) is one of the measures commonly used to evaluate management strategies. However, the CWUE does not discriminate the irrigation contribution, and according to Howell37, other expressions can discriminate the irrigation role, such as the supplementary water use efficiency of evapotranspired by irrigated treatments with respect to rainfed (SWUE) and the irrigation water use efficiency (IWUE) (Eq. 4 and 5).
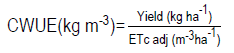
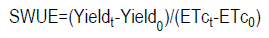

Where:
Yieldt: Yield irrigation treatment (Kg ha-1)
Yield0: Yield rainfed (Kg ha-1)
ETct: ETc adj irrigation treatment (m3)
ETc0: ETc rainfed (m3)
I: Irrigation (mm)
To evaluate the effect of deficit irrigation on yield, a deficit irrigation stress index (DISI) was calculated38. It relates the yield obtained in each treatment (Yieldt) with the yield of the most irrigated one (Yieldr).

2.7 Statistical analysis
Data were analyzed using the statistical package INFOSTAT39. Means were separated using Fisher's test (p≤0.05 between means) to detect differences between treatments for grain yield, weight of 1000 grains, grains per m2 and biomass. The relationship between grain yield and the amount of water applied by irrigation was evaluated using a regression fit.
3. Results
3.1 Climatic characterization
The atmospheric demand (ETo) was higher than the ETo in both years, with a 50% probability of occurrence for a series of 40 years, mainly during the CP (Table 2). In the CP (February and March) the PP was lower than the PP value with a 50% probability of occurrence in both years. In Year 1, due to late sowing dates, the CP was between March 12 and April 10. In Year 2 it was between January 31 and March 1. It is worth mentioning that before the CP, in the phenological stages of flowering and pod formation, the PP was the lowest of the crop cycle, 27 and 11 mm for Year 1 and 2, respectively.
In Year 2, PP occurred before the end of the crop cycle and continued for several days. This situation did not allow immediate harvest, because it was impossible to enter the crop with saturated soil and because the PP continued for 20 days. The yield was affected due to fallen plants and the loss of harvestable grains.
Regarding solar radiation during CP, the values were 5% higher than the average.
Table 2: Monthly average potential evapotranspiration (ETo), cumulative PP and solar radiation for Year 1, Year 2 and value with 50% probability of occurrence in 40 years (1980-2020)
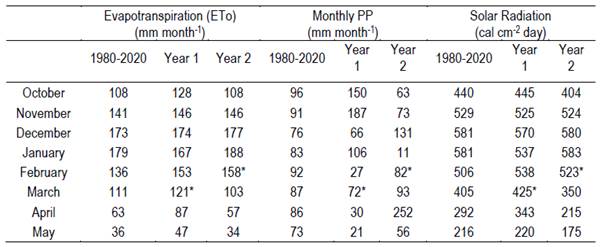
* Critical period
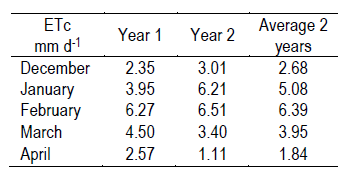
Both years presented the maximum ETc in February (6.27- and 6.50-mm d-1), due to late sowing dates. Year 2 also presented high ETc in January (6.21 mm day-1) because that year the crop was sown in mid-November and reached the maximum Kc in the last week of January.
3.2. Grain yield, production of aboveground biomass and harvest index
The results indicate that irrigation affected grain yield in both evaluation years. The response to the different treatments depended on the specific conditions of each year, mainly the quantity and distribution of PP. The yield of the 9 mm treatment was significantly higher than the other treatments (except for the 6 mm in year 1), and the rainfed presented the lowest yield. The water deficit conditions caused a significant yield reduction in the rainfed and 3 mm, compared to 9 mm (Table 4).
The 1000-grain-weight yield component did not differ statistically between treatments in Year 1, and it was higher in 9 and 6 mm, in Year 2, which were statistically different from 3 mm and rainfed (Table 4). The number of grains per square meter was higher in 6 and 9 mm in both years, with a significant difference between them in Year 2; and the 3 mm and rainfed treatments presented a lower number of grains per square meter, differing from all the treatments.
Table 4: Grain yield, weight of 1000 grains and number of grains per m-2, for the two years of evaluation. Grain moisture corrected to 14%
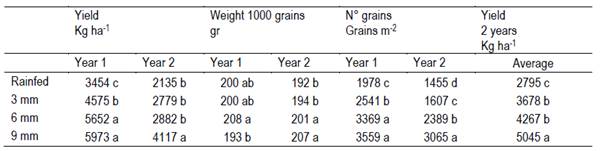
Means with the same letter are not significantly different (p> 0.05).
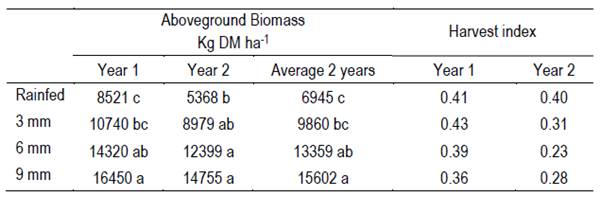
The aboveground biomass production was higher in 6 and 9 mm, and higher in Year 1 compared to Year 2. On average, the 6- and 9-mm treatments achieved 13359 and 15602 kg DM ha-1 of aboveground biomass and the rainfed, approximately half, 6945 Kg DM ha-1. The harvest index, which relates the harvestable yield (grain) with the aboveground biomass produced, was higher in 3 mm and rainfed, with values from 0.40 to 0.43, being from 0.28 to 0.36 in 9 mm.
3.3. Water balance
The ETc adj was between 390 and 603 mm, with the lowest values in the rainfed. The 6- and 9-mm treatments presented similar ETc adj between each other and close to each year's ETc. Only the rainfed was affected by the low PP of Year 1, which occurred from flowering, CP and until the end of the crop cycle (Table 2), being lower than average for a 40-year series. This effect is clearly seen in the Ks value, both in the cycle average and in the CP (Table 6).
In Year 1, the 3 mm treatment had a Ks of 0.98 and an ETc adj similar to 6 and 9 mm, however, its grain and biomass yield was lower than in these treatments.
The net irrigation requirements were 423 and 416 mm in 9 mm to meet the total ETc of the crop. However, 6 mm required between 40 and 70 mm less irrigation to meet the same objective, making better use of the PP.
Figure 1 shows the occurred PP during the crop cycle. Years 1 and 2 presented 20 and 38 PP events, respectively. On average, the total cumulative precipitation represents 49 and 69% of each year's ETc; however, not all PP was effective (Table 6).
The water content in the soil in 9 mm and 6 mm remained high, close to FC, not falling below the threshold of stomatal closure, while in rainfed as of approx. V10 stage, soil moisture fell below the threshold in the two years, and 3 mm remained close to the threshold in Year 1 and below it in Year 2 from R2 to R7 (Figure 2). This treatment did not maintain an adequate level of humidity in the soil when the water requirement increased, due to the higher demand and the scarce PP occurrence, and the soil RAW was depleted in approx. 17 days (Figure 2).
Table 6: Adjusted evapotranspiration (ETc Adj), Irrigation, Effective precipitation (PPeff.), average Stress coefficient of the cycle (Ks cycle), and Stress coefficient in CP (Ks CP)
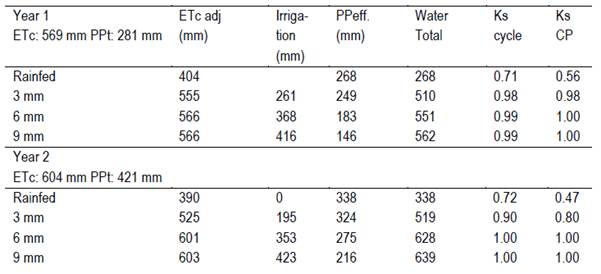
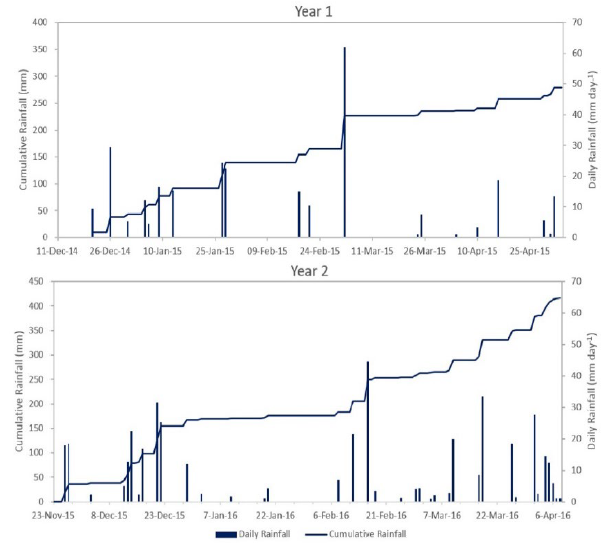
Figure 1: Daily and cumulative precipitation during the soybean growing season for the two years of evaluation
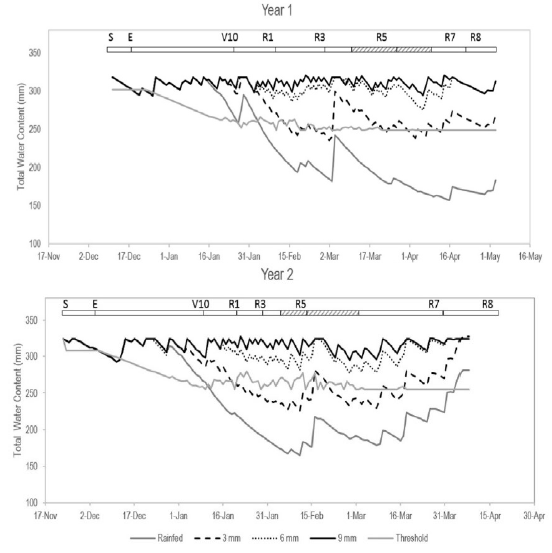
Figure 2: Evolution of the total water (mm) in the total root depth (0.80 m) for the different treatments. The upper-scale indicates the phenological stages and CP for each evaluation cycle. S: Sowing, E: Emergence, V10: 10th knot, R1: Beginning of the flowering, R3: Beginning of pod formation, R5: Seed formation, R7: Beginning of maturation and R8: Complete maturation
3.4. Relationships between yield, irrigation and ET. Water productivity indicators
Results indicate that the relationship between the yield and the irrigation applied was linear in the two years of evaluation and in the average of the years. The regression equations have a good fit with R2 of 0.96 and 0.94 for Year 1, and the average and R2 of 0.77 for Year 2. The linear regression coefficient, which indicates the increase in grain yield for each unit of increased irrigation applied, was 6.03 and 3.86 kg mm-1 for Years 1 and 2, respectively.
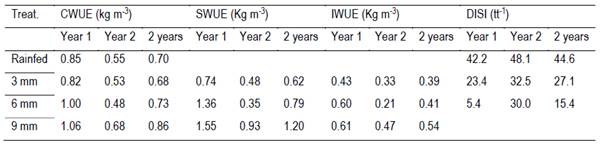
The water productivity evaluated using different indicators was higher in 9 and 6 mm, and higher in Year 1 compared to Year 2. In Year 1, the yields were higher and the amount of irrigation water was similar in both years. Although Year 2 presented more abundant PP, the irrigation requirement was similar to Year 1, since half of the PP occurred at the end of the cycle. In Year 2, the rainfed, 3 mm and 6 mm treatments did not differ from each other in yield, but the 6 mm received more irrigation water, therefore, it had a worse performance. On average, each added mm of irrigation (IWUE) and each extra evapotranspired mm (WUE) produce more yield in 9 mm than in 3 and 6 mm.
The Deficit Irrigation Stress Index (DISI) was greater in the rainfed treatment, followed by the 3 mm. The index was greater in Year 2, which would indicate a greater level of stress in all deficit treatments.
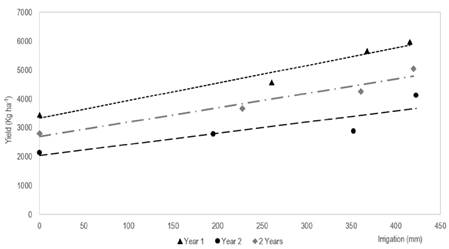
Figure 3: Relation between grain yield (Yield) and irrigation applied (I) in the crop cycle. Year 1: Yield=6.025 x + 3339 (R2=0.96); Year 2: Yield=3.8625 x + 2041 (R2=0.77); 2 years: Yield=4.9521 x + 2697 (R2=0.94)
4. Discussion
This experiment was developed under climatic conditions of atmospheric demand between 4 and 5% over the ETo value with 50% probability of occurrence considering the months of greater demand (January to March). The PP was below this value (22 and 30% lower during the same period). This situation generated water deficit conditions in the rainfed and 3 mm treatments in key stages for the yield formation, from the flowering to the final maturation of the crop40)(41.
The daily average ETc in the month of maximum demand for this experiment was 6.5 mm d-1 in February, which is similar to the average ETc for a series of 40 years in January (6.6 mm). When using this value to design the irrigation equipment for soybean crops, such as central Pivot, whose application efficiency is around 85-90%42, the irrigation water requirement rise to 7.6 mm d-1. In this situation, equipment that is able to apply 7.6 mm d-1 meets the crop demands throughout the cycle. Nevertheless, this equipment requires a higher initial investment, greater operational cost, and it is oversized for the first and last stages of the crops cycle, when the water demand is at its lowest. The 6 mm treatment was able to maintain soil humidity levels over the threshold of stomata closure, applying 5.5 mm d-1 net (90% application efficiency). When the crop demand was greater, the soil reserve contributed with the difference between the crop demand and irrigation. The 6- and 9-mm irrigation treatments kept the soil moisture close to FC when reaching the stages of greatest water requirement and CP, keeping soil moisture levels above the stomata closure threshold.
The ETc adj was higher as the crop received more water, the 6 mm and 9 mm treatments had no ETc adjustment (566 and 603 mm, Year 1 and 2, respectively). The ETc in this experiment is consistent with the values mentioned by regional and extra-regional researchers. According to Doorenbos and Kassam43 the estimated ETc for the maximum soybean production is between 450 and 700 mm; according to Steduto and others40 between 300 and 800 mm, depending on the type of cultivar and environmental conditions. Montoya and Otero44 estimated values of 380 mm in rainfed and approx. 580 mm with irrigation in 35 simulations carried out with the Aquacrop model41, using climatic data similar to the ones used in this experiment. Other researchers mention ETc values of 821 mm in full irrigation in Bursa, Turkey45; 452 mm in Nebraska, USA46, also with irrigation; 505 mm with full irrigation, and 227 in rainfed in a temperate climate, Serbia2; 601 mm full irrigation and 452 mm in rainfed, in south-central Nebraska1; 650 mm in full irrigation and 310 in rainfed, in Hungary47.
Although the 3 mm treatment in Year 1 had an ETc adj similar to that of 6 and 9 mm, the yield was significantly lower. In this case, the humidity level was above the stomata closure threshold, but below the leaf expansion threshold during the reproductive stages (Figure 2). This resulted in lower leaf area production, lower biomass and lower yield41.
The daily and cumulative PP was not enough to cover the water requirement of the crop in any of the 2 years. While 20 and 38 rainfall events occurred in Year 1 and Year 2, respectively, their distribution and volume were not adequate. In Year 2, up to V10, the PP covered the crop demand, after that, the PP was minimal and the increase in crop demand caused the rainfed to exhaust the RAW in 15 days, while 3 mm exhausted it in 25 days. Soils with less water storage capacity than the soil in this test would have had greater deficits. Uruguay has shallow soils in agricultural areas which present frequent water deficit conditions in summer48. Considering a root depth of 0.80 m meant more available water for the crop to use during the cycle. The soil in which the experiment was developed, Typic Argiudoll, has 163 mm of potentially available water, at 1 m deep; however, due to degradation reasons (erosion), the net available water can decrease to 130 mm in this type of soil, classified as high class of available water48. The experiment soil characterization indicates that the water available up to 0.80 m is 138 mm, higher than the indicated by the previous reference, considering the same depth, but no evidence of degradation due to erosion was found, which would explain the differences. This means that for the crop to begin its stomatic adjustment the AW must fall more than 60 mm, with a threshold of 0.44 ("p" adjusted for an ETc of 6.5 mm d-1), which occurs in 9 days with a daily demand of 6.5 mm, without irrigation.
Treatments 9 and 6 mm did not present significant differences in yield in Year 1, but they did in Year 2, where no differences were observed between these treatments in water consumption. In Year 2 the 6 mm yield was more affected by the plants overturned by the PP which occurred at the end of the cycle. This situation may explain the low harvest rates obtained in Year 2 in irrigated treatments.
The maximum yields were almost 6.0 tt ha-1, in 6- and 9-mm treatments (Year 1), similar to those obtained in local crop evaluations, and 3.4 tt ha-1 in rainfed. At the commercial level, the average yields recorded are around 3.0 tt ha-1 in rainfed and 4.0 tt ha-1 with irrigation21. Gajić and others2 obtained yields of 4.27 tt ha-1 with irrigation and 2.59 tt ha-1 in rainfed, in temperate climate conditions. All irrigation treatments yielded more than rainfed, indicating the importance of irrigation even with low irrigation depth (3 mm).
The 9 mm treatment performed the best in the two years, in terms of yield and water productivity; however, it did not make good use of the PP, only 52% of them were effective. In the 6 mm treatment, the yield loss due to plant overturning explained the lower efficiency in the use of water.
The aboveground biomass production coincides with that mentioned locally by Giménez49, but it is higher than the mentioned by other researchers2)(44, mainly in the 6 and 9 mm treatments. The biomass in rainfed and 3 mm is similar to that mentioned by Galić and others2 in rainfed treatments and 40% of full irrigation. The 6- and 9-mm treatments kept the soil moisture close to FC, close to the leaf expansion threshold, avoiding the leaf expansion stress41)(50, developing more biomass than 3 mm and rainfed. This higher biomass production did not translate into a proportional yield increase in 6 and 9 mm, and the HI was lower than rainfed and 3 mm. In this regard, Raes and others41 indicate that the HI can be negatively affected by this excessive biomass growth which does not mean a more harvestable yield.
The evolution of the total water in the root depth indicates adequate irrigation management since the humidity was kept between the threshold and FC, in most of the crop cycle, in 6 and 9 mm. This form of irrigation management ensures high crop transpiration rates without stomata adjustment that reduces it and without affecting photosynthesis40)(31. However, Steduto and others40 recommend irrigation schedules based on the depletion of 60% of the total AW, that is, close to the threshold recommended by FAO 56 (50%), indicating that the applied irrigation is lower and the yield is not significantly affected. Although this practice allows greater use of PP, it can be risky in the absence of PP for prolonged periods and high-frequency irrigation equipment that cannot replenish the daily crop demand, when it is high, as is the case of central pivots and localized irrigation42. These systems are designed using the average daily crop ETc, so if the irrigation is managed to keep the humidity close to the threshold content, the soil moisture may fall below the stomata adjustment threshold in prolonged periods with demands above the average and without PP. These situations are frequent in temperate climates with erratic rainfall in the growth cycle. This situation was observed in this experiment during the CP in both evaluation years (Figure 1). Otero and others51 evaluated different irrigation strategies, including exhausting up to the threshold and restoring with 10 mm of irrigation, using the water balance model WinIsareg52. Results indicate that this strategy took better advantage of rainfall and made less use of irrigation water. However, the equipment designed to comply with this irrigation strategy must be able to manage 10 mm per day, and results in higher pumping flow and hydraulic design with larger diameter pipes, therefore higher investment and operating cost.
The water productivity indicators (CWUE, SWUE, IWUE) were similar to those mentioned by several researchers1)(2)(53 and higher than those indicated by Payero and others54. The indicators that distinguish the role of irrigation in water productivity of the crop are the IWUE and SWUE37)(55)(56)(57, since they consider the incremental yield, above the rainfed yield caused by the added irrigation. Both indicators were higher in 9 mm, followed by 6 mm; however, in Year 1 the IWUE of both treatments was similar, with 48 mm less irrigation in the 6 mm treatment. In both years, the 6 mm treatment had the same ETc as 9 mm, but with less irrigation water applied (48 and 70 mm, Year 1 and 2, respectively).
The relationships between yield and applied water were linear, coinciding with those obtained by Kirnak and others11, Payero and others54, and Irmak and others1, who investigated in semi-humid climatic conditions in south-central Nebraska, with PP during the crop growth cycle. Regarding the yield increases per mm applied, Payero and others54 obtained increases from 5.28 to 8.29 kg ha-1 above the intercept in dry years, greater than those of this study, which were 6.02 and 3.86 kg ha-1, Years 1 and 2, respectively. However, other researchers found a quadratic correlation between yield and ETc adj2)(58.
In Year 1, the 6- and 9-mm treatments did not differ from each other, indicating that the equipment designed to apply a maximum irrigation depth of 6 mm would be the most convenient since it makes better use of PP and uses less irrigation water than the equipment with a maximum irrigation depth of 9 mm. However, the highest yield in Year 2 occurred with 9 mm, while the rest of the treatments did not differ from each other, possibly because 6 mm presented greater yield losses due to plant overturning.
5. Conclusions
The results of two years of evaluation indicate that the different irrigation regimes affect the yield and water productivity in soybean cultivation; even the smallest irrigation depth, 3 mm, had a positive effect on the yield compared to rainfed.
The 9 mm treatment was the best performing treatment in both years, but in Year 1 it did not differ significantly from the 6 mm. The 6 mm treatment in Year 2 had a lower yield, probably because it was the most affected by the harvest delay due to rainfall and the consequent grain loss. In the 6 mm treatment, the amount of irrigation water applied was lower and the use of rainwater was greater than in the 9 mm treatment, in both years.
To optimize irrigation management, an economic analysis is required. In this case, the proposed objective was to determine the minimum daily irrigation depth that allows high yields with better use of rainfall, and that ultimately determines lower equipment investment and operating costs. The lowest costs are given by smaller equipment, associated with a smaller irrigation depth.
According to the results of this study, equipment designed with a capacity to replace a maximum of 6 mm per day would be the best option in Uruguay's soils, which have high and very high-water retention capacity, similar to the one in the present experiment. On the other hand, the 3-mm option must be economically analyzed to estimate whether the yield increase achieved by applying 6 mm justifies the higher investment and operating cost compared to applying 3 mm.
Therefore, it would be advisable to model the obtained results and evaluate them for a series of several years with measured climatic data to give a more reliable irrigation management recommendation, taking into account more diverse climatic and soil conditions than those observed in these two years of experiment.

