Inglés (pdf)
 Articulo en XML
 Referencias del artículo

 Permalink
1. Introduction
Optimizing productivity and use of natural grasslands is considered a strategic way to conserve them. Fertilization is considered an effective tool to improve pasture productivity and its nutritional value, which consequently enhances the livestock performance1. However, since natural grasslands in shallow soils are regularly limited by its low water storage capacity, fertilization can be ineffective, especially if the fertilizers are applied during the water deficit period. This situation, common in the north of Uruguay and part of Rio Grande do Sul, Brazilian state, limits the pasture growth in summer due to low water availability in soils, inducing to overgrazing. Therefore, in order to adequate forage availability to the animals, it is imperative to stockpile for this critical period and to adjust the fertilization management according to the soil humidity.
Although the natural grasslands from Campos grasslands2 provide valuable economic and ecosystem services, they are critically threatened by changes in land use and overgrazing3)(4. The Campos grasslands situated on shallow basaltic soils exhibit high vulnerability to droughts. The heterogeneity of these grasslands was classified by Lezama5 highlighting the availability of water as the main factor explaining the environmental control of floristic and functional gradients. In these conditions, the overgrazing and the absence of management practices to minimize the edaphoclimatic constraints cause important environmental and productive losses6.
The deferment of forage is the action of delaying grazing of a pasture for a certain period of time7. Grazing deferment could allow the recovery of degraded grasslands, due to increases in the coverage of palatable species8. It also allows stockpile in “in situ forage banks” during a favorable climatic period, for its use in subsequent unfavorable periods7)(8. Furthermore, deferring grazing during springs can be used to optimize the forage structure and therefore the nutritional value of non-deferred grasslands “adjusting the stocking rate with forage biomass", and thus increasing livestock performance9.
When soil fertility is low, fertilizers can further improve the benefits of stockpiling, increasing pasture growth and reducing deferment time9. Particularly, the increase of the main nutrients in natural grasslands ecosystems has a direct effect on primary productivity, since they are naturally limited by soil fertility10)(11. In this condition, the response to fertilization depends on soil conditions, climate and the botanical composition of the grasslands12. The nitrogen nutrition index (NNI) is the relation between the actual N percentage in forage and the minimal N concentration to reach the maximum growth of plants13, which is predicted by a model of N dilution as a function of plant growth. The NNI can be used as a tool for diagnosis and contributes to a more complete recommendation of N fertilization, according to plants development14. Based on this background, this study aimed to evaluate the response of pasture production to spring grazing deferment in a shallow basaltic grassland in different conditions of liming, phosphorus and nitrogen addition. Overall, we expect to better understand the role of lime, N and P in the productive response to spring deferment, in order to promote management tools that minimize the vulnerability of livestock systems to droughts.
2. Materials and methods
The experiment was conducted in a natural grassland belonging to the physiographic region of “Campanha”, RS, Brazil (31°03'37"S, 55°54'46"W, 327 m altitude). The soil is classified as a very shallow (0-10 cm) Typic Udorthent. A soil analysis (10 cm depth) performed before the beginning of the experiment (September 2009) showed the following results: pH(water) = 5.2; OM = 6%; P and K available (Mehlich-1) = 7.2 361 mg kg-1, respectively; exchangeable Ca, Mg and Al (KCl 1 mol L-1) = 5.1, 1.2 and 0.6 cmolc dm-³; Al saturation = 7.4%.
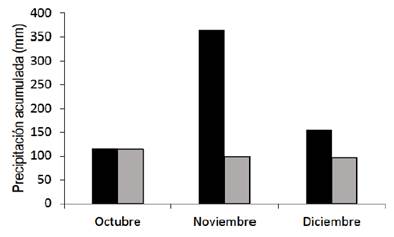
The climate of the region is subtropical, mesothermal (Cfa2), with warm summers, according to Köppen classification15. The average annual temperature is 17.2 ºC. In summer, the probability of precipitation is higher than the reference evapotranspiration, only 30%16. The accumulated rainfall during the experimental period was higher than the long-term average for this location (Supplementary material 1).
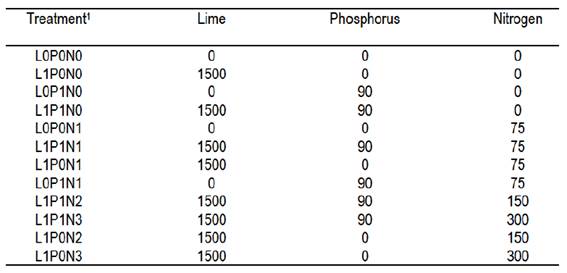
Animals were excluded from experimental area on October, 25, 2009, when fertilizers and lime were manually applied over the natural grassland (canopy height of approximately 4 cm), without any mechanical or chemical intervention. We evaluated 12 combinations of lime and fertilizer application during the spring growing season, arranged in an incomplete factorial design with three replicates of randomized blocks, as follows: lime 0 and 1500 kg ha-1; phosphorus 0 and 90 kg ha-1 of P2O5; and nitrogen 0, 75, 150 and 300 kg ha-1 of N. The upper two N levels were evaluated only with lime (Supplementary material 2). The experimental units were 30-m² plots (3 m × 10 m), allocated in a way that represented the average characteristics of local vegetation.
Lime and phosphorus doses were based on CQFS17 recommendations for natural grasslands. The sources applied were dolomitic limestone, triple superphosphate (45% P2O5), and ammonium sulfate (21% N + 24% S). Potassium was not used since the concentration of this nutrient in the soil was high according to CQFS17.
Herbage measurements were carried out at 15-day intervals. For each period of measurement, four rectangular frames of 0.125 m2 (0.25 m × 0.50 m) were randomly distributed in each experimental unit to collect subsamples for determining forage mass. First, we measured the forage height at two points within each of the frames using a sward stick18. After that, forage was cut at ground level using a hedge-trimmer. Then, the four subsamples were mixed, packed in plastic bags, weighed, and stored under refrigeration at 5 °C for further processing.
The botanical components were separated into dead material (DeM) and green material (GrM). DeM and GrM were then dried in a forced-air oven at 60 °C until constant weight. All the remaining material not used as DeM or GrM, named non-separated fraction (NsF), was dried and weighed in order to determine the partial dry matter content (DMC, %), calculated as the percentage difference between the weight of wet and dried forage. Total forage mass (FM, kg ha-1 of DM) was calculated by multiplying DMC by fresh forage mass. Green forage mass (GFM, kg ha-1) was calculated by multiplying FM by GrM percentage. The NsF was ground in a Willey-type mill and sifted through a 1-mm sieve for subsequent determination of: total dry matter at 105 °C for 16 h; nitrogen (N x 6.25 = crude protein, CP) using the micro Kjeldahl method; ash (AS) by incineration in a muffle furnace at 550 °C for 4 h; neutral detergent fiber (NDF) according to Van Soest and others19; and acid detergent fiber (ADF) according to Goering and van Soest20.
Nitrogen concentration in plants was associated to their FM and compared to the dilution model described by Lemaire and Gastal13. The NNI was determined by dividing the N concentration of the shoot biomass by the critical N concentration (Nc). Nc was determined by the mathematical model Nc = 3.6 × W-0.34, in which the critical N level represented the minimum absorption of N required to achieve the maximum accumulation of dry matter, expressed as % of N; W was the forage mass (t/ha DM)13. This model was elaborated for the C4 photosynthetic pathway, that was the functional group of plants prevailing in our experiment.
The botanical composition was assessed in December 2009 and March 2010, based on the BOTANAL spreadsheet21 and the BOTANAL software22, using the double sampling method described by Wilm and others23 to estimate the forage mass. The five most abundant species found in each frame (when present) were identified and their relative participation was registered considering the ranks of the spreadsheet used, visually estimating the relative contribution of each one to forage mass.
Orthogonal contrast analysis was performed in order to evaluate the single effects of lime and fertilizer applications as well as their interactions (P<0.05) in FM and forage height. Subsequently, the variables that were statistically significant in the test of orthogonal contrasts were analyzed by linear and quadratic regressions. Statistical analyses were performed using the JMP and SAS statistical software.
3. Results and discussion
We observed 62 plant species in the study area, corresponding to 12 botanical families, within which, the Poaceae and Cyperaceae families represented 87% and 9% of the herbage mass, respectively, in the average of the two assessments (December and March). The contribution of the main species to forage mass was not affected by the treatments either during the deferment period or in the subsequent period (P<0.05). Mnesithea selloana showed the highest contribution in both evaluations, followed by Vulpia sp., Steinchisma hians, Piptochaetium montevidense, Eleocharis viridians, Axonopus affinis, and Paspalum indecorum, which together represented 70% of the herbage mass in the first assessment (Figure 1). In the second evaluation (March), Vulpia sp. was not found due to its annual winter cycle of growth. In contrast, we observed an increase in the participation of C4 grasses, such as Axonopus affinis, Paspalum indecorum, Paspalum notatum, Paspalum dilatatum, and Paspalum plicatulum.
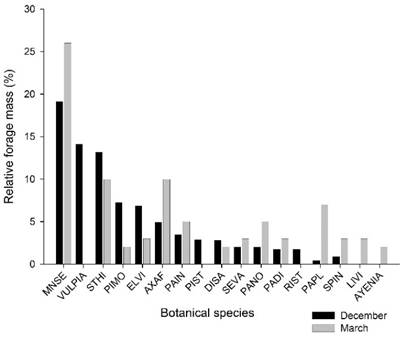
Figure 1: Relative forage mass of the main species: Mnesithea selloana (MNSE), Vulpia sp. (VULPIA), Steinchisma hians (STHI), Piptochaetium montevidense (PIMO), Eleocharis viridans (ELVI), Axonopus affinis (AXAF), Paspalum indecorum (PAIN), Piptochaetium stipoides (PIST), Dichantelium sabulorum (DISA), Setaria vaginata (SEVA), Paspalum notatum (PANO), Paspalum dilatatum (PADI), Richardia stellaris (RIST), Paspalum plicatulum (PAPL), Sporobolus indicus (SPIN), Lippia villafloridana (LIVI), and Ayenia sp. (AYENIA)
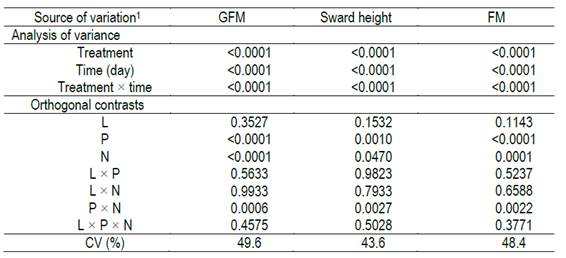
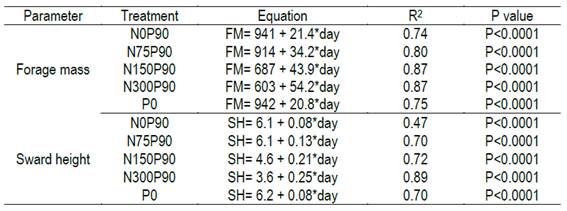
The NNI showed a positive response to N fertilization (P<0.05) in every evaluation (Figure 2). NNI remained lower than 1 regardless the amount of N when it was applied alone, which means that the N concentration in the plants was a limiting factor to obtain the maximum forage production. Alternatively, when N was combined with P, the NNI was close to 1. This effect demonstrated that P was also a limiting factor, since when N and P were applied together N concentration in the plant was improved compared to the single application of N. This N and P co-limitation additive effect was also evident in the evaluation of forage height and forage mass (Supplementary material 3). In these cases, the slope of the regression between forage mass and height with the time after deferment in the grasslands fertilized with N was higher in presence of P than in its absence (Figures 3 and 4, supplementary material 4
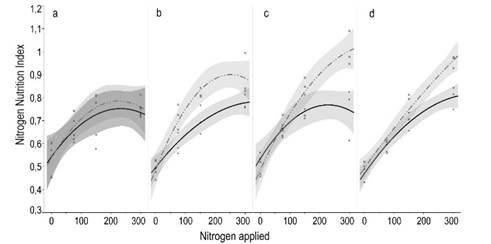
Figure 2: Nitrogen nutrition index in a natural grassland according to N applied (kgha-1), contrasted by the presence of P (continuous line) or not (dashed line), at different moments after treatments application: 15 (a), 42 (b), 53 (c) and 75 (d) days. All regressions adjusted to quadratic response (R2<0.05 and P>0.60 for all equations). Shaded intervals around regression lines show the confidence of fit, which means that non-overlapping lines are statistically different (P<0.05)
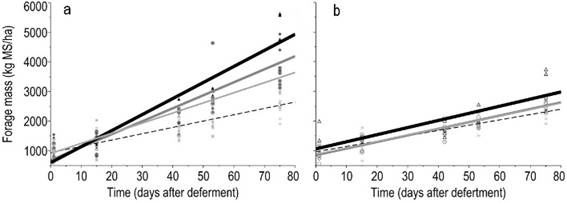
Figure 3: Relationships between forage mass, FM (kg ha-1 DM), and time (days after deferment) according to nitrogen levels combined with added P (a) or no added P (b). Nitrogen levels were represented by 0( ), 75, (
 ), 150 (
 ), and 300 (
 )
)
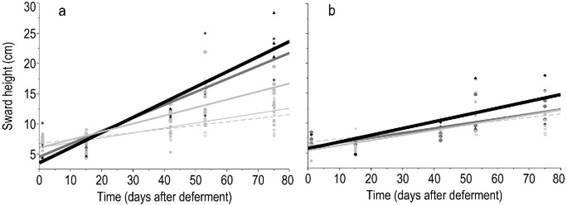
Figure 4: Linear regressions of the sward height, SH (kg ha-1 DM), according to deferment period in response to nitrogen fertilization combined with phosphorus (a) or not (b). Nitrogen levels were represented by 0(), 75, (), 150 (), and 300 ()
The combined addition of P and N evidenced synergistic effects in the forage production. In absence of P there was no effect of the N dose; whereas when N and P were applied together the forage mass was increased with each increment of N dose, reaching more than 4500 kg ha-1 of forage mass at the highest level of nitrogen (Figure 3a). When applied alone, phosphorus significantly increased the forage mass (Supplementary material 3), but with a lesser extent than when combined with N.
The importance of phosphorus × nitrogen interactions for forage production has been highlighted in the literature for a long time. Short-term studies using nutrient solutions in greenhouse conditions revealed that phosphorous uptake and translocation was regulated by nitrogen24. This process involves a decrease in rhizosphere pH and an increase in the solubility of soil phosphates, which, together, cause an increase in root growth and in root physiological capacity to absorb phosphorous. The synergistic interaction between nutrients was discussed by Venterink25 establishing differences between "nutritional co-limitation" and "chemical facilitation". An example of chemical facilitation is that the addition of nitrogen favors root growth, and consequently, it also facilitates phosphorus absorption. In this case, the interpretation of a single limitation by N may be wrong, for example if the added N lead to a greater root growth and/or increase the mineralization of soil organic matter, these processes facilitate the availability of phosphorus to plants25. The large differences in the effects of NP vs N in forage production obtained in our study would suggest that co-limitation responses prevail over facilitation.
The correlations between sward height and green forage mass, and between forage height and available forage mass, 0.84 (P<0.0001) and 0.76 (P<0.0001), respectively, reveal that forage mass accumulation and sward height show a similar pattern during the deferment period (Figure 4). A high frequency of lower forage heights (below 13 cm) was found, which is a feature from a formed by prostrate species. Even with no application of any inputs (phosphorus and/or nitrogen) a significant increase in forage mass was observed according to the days of deferment (Figure 3a, Supplementary material 4). The forage mass was low (1000 kg ha-1) in the first evaluation and increased to more than 2000 kg ha-1 after 75 days of deferment.
Lime did not show significant effects on the variables studied, probably due to the short time after its use. Working with superficial application of 2000 kg ha-1 of lime on grasslands and with a reapplication of the same level after 24 months, Rheinheimer and others26 only detected aluminum neutralization limited to the 0.0-2.5-cm layer 6 months after lime application. However, the benefits that liming can bring to the system are well known, such as increasing nutrient bioavailability, improving microorganism activity and increasing cation exchange capacity, which improve the forage production and the frequency of legumes. These effects, which can persist in the soil for several years27, need a period of evaluation, exceeding the period of this study. Despite this, the lack of liming effect can be explained by the evolutionary history at regional scale, given the long-term adaptation of the species to the predominant soil pH28. Forage quality (CP, NDF, ADF) was not influenced by phosphorus application (detected by orthogonal contrast analysis, P = 0.14, 0.68, 0.56, and 0.84, respectively); however, these parameters were fitted to linear regression models according to deferment time. A factor that may have caused such response was the dilution of phosphorus effects29 associated with the nitrogen effect of increasing forage mass. As forage mass increase due to the accumulation of structural shoot tissues, it induces a decline in mineral concentration30.
As expected, increasing the nitrogen level led to an increase in CP content (Figure 5d), which was reduced with the increase in deferment time (Figure 5c), due to the dilution of nitrogen with a simultaneous increase in FM30)(31. Overall, our results were above the minimum CP concentration to meet the requirements of rumen bacteria, which lies in the range of 6%32. Considering that forage samples were harvested at ground level and the selective behavior of the animals, these obtained CP values underestimate the nutritional value of the diet. This is because the bite depth of grazing animals corresponds to half of the forage height33, which have higher CP concentration compared to the whole plant, and also because animals select the more palatable species34. Therefore, the combination of the needs of stockpiled forage, the specific requirements of the animals and N-P fertilization criteria could be used as a reference to calculate the duration of the deferment period. Indeed, more experiments will be necessary to identify the role of the rainfalls and the temperature as primary drivers of the forage accumulation and its nutritional value. It is important to note that the present study was carried out during a relatively short deferral period, and in a year in which rainfall overcame historical trends. Although the magnitude of responses to fertilization is modified by the amount of water in the soil, spring is the time of year when weather conditions are generally favorable for the accumulation of forage by the plant communities present in the study region.
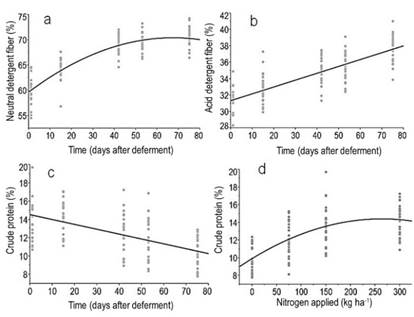
Figure 5: Relationships between time (days after deferment) with the forage contents (%) of a) neutral detergent fiber (NDF) = 63.3+0.13*day-0.0023*(day -39.11)^2, R2= 0.77, P<0.0001; b) acid detergent fiber (ADF) = 31,4 + 0,0835*day, R2= 0.61, P<0.0001, and c) crude protein (CP) = 14.5 - 0.05*Day, R2= 0.31, P<0.0001. Figure 5d shows the relationship between nitrogen applied and forage crude protein concentration (%) at the last evaluation moment (75 days of deferment). (CP) = 11 + 0.017*N-6.47e-5*(N-128.9)^2, R2=0.46, P<0.0001
NDF and ADF concentration showed a quadratic and linear response to deferment time, respectively, but they were not influenced by nitrogen application (Figure 5). As the plant became more mature, an increased cellulose deposition is observed in the secondary wall, associated with an increasing cross-link formation between lignin and hemicelluloses35. Therefore, the plant structure became more resistant to lodging, but at the cost of reducing the digestibility of cell wall components, especially of hemicelluloses, which is linked to lignin36.
Although the analyzes and interpretations of the results of the present work have focused on the effects of liming and N-P fertilization on the natural grassland, it is important to consider that the use of ammonium sulfate as a source of N also determined the application of significant amounts of sulfur. Knowing that sulfur is an element that can promote significant increases in forage production37 and in the N use efficiency38, its effects may have contributed to the responses presented in the present work.
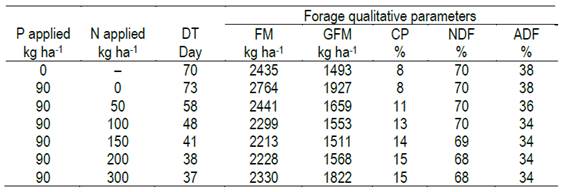
The regression equations generated in this research could be used to simulate different scenarios of forage accumulation and their quality as a function of deferment time in natural grasslands in shallow soils. Table 4 shows an example of combined application of these models. This simulation aimed to set the deferment period (days) required by the forage to reach 12-cm height depending on fertilization level. This criterion was based on the data obtained by Gonçalves and others39, who evidenced that the forage height that maximizes the bite mass and animal intake rate is 11.4 cm, corresponding to a forage mass ranging from 2000 to 2500 kg ha- of DM. Without nitrogen fertilization, we need 70 days to reach 12 cm of height, whereas using 200 kg ha-1 of N, the same height was achieved in almost half the time and doubling the protein content. There is no doubt that more natural grasslands deferring experiments should be performed in different years and places to design a support system that aid farmers in the selection of the optimum management strategies. By providing the regression models generated in this research, our study aims to contribute in this direction.
4. Conclusions
The results of the study revealed an inverse relation between the amount of forage accumulated as the deferment time increased and the quality of the stockpiled forage. Phosphorus and nitrogen fertilization showed a complementary and positive effect both on forage accumulation and on the nitrogen nutrition index of deferred forage, while increasing the nitrogen dose led to an increase in the protein content. A first version of regression models was proposed to simulate different scenarios of forage accumulation that need to consider more factors in future studies, e.g. soil moisture.