


 English (pdf)
 Article in xml format
 Article references

 Permalink
1. Introduction
Continuous grazing management1 with high animal density, high sheep:cattle ratio, and without resting periods2)(3)(4 has been traditionally applied in the Uruguayan basaltic region, causing overgrazing that produced a deterioration of the natural grass cover2.
The implementation of controlled grazing where grazing time and defoliation intensity can be adjusted allows mitigating the degradation process of the natural field, and could sometimes reverse it5)(6. Traditionally, the aboveground net primary production of pastures (ANPP), that is, the amount of biomass accumulated per unit area, was estimated from biomass cuts carried out in the field7. Nowadays, it is possible to estimate ANPP by remote sensors using synthetic images of improved vegetation index that detect the fraction of photosynthetically active radiation that is absorbed by plants (fPAR). This methodology allows covering larger areas and easily achieve repeated measurements over time from the same place8. To convert fPAR into ANPP, it is necessary to consider the efficiency with which plants transform radiation into biomass, which is the coefficient of radiation use efficiency (RUE)9. This coefficient is affected by environmental factors such as temperature and precipitation and by the floristic composition, which in turn is affected by livestock management8)(10.
The study aimed to determine the effect of the decrease in grazing intensity on the floristic composition, the ANPP and the RUE coefficient of the Basalto deep soil plant community, and to determine the seasonal variability of the RUE.
2. Materials and methods
2.1 Study area
The study was carried out between spring 2013 and summer 2015, in five farms of livestock producers with mixed grazing (sheep/cattle) on natural field (Table 1). The farms were located in the municipalities of Tacuarembó and Salto, Uruguay, in the Cuesta Basáltica geomorphological region11.
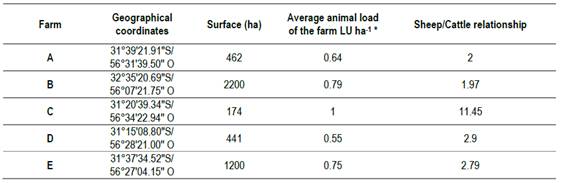
In each farm, the effect of the change in grazing management was evaluated on a paddock with a history of continuous grazing and high load (1.0-1.1 LU:ha), and on another paddock with the same grazing method but with load reduction over time. Loads are defined as the number of livestock units (LU) per hectare, which in Uruguay is equivalent to the maintenance requirements of a 380 kg live weight cow12. In each farm, considering the producers' opinion, two paddocks with a history of contrasting livestock management were selected, one with continuous grazing and animal load 1.0-1.1 LU:ha (hereinafter AC), and another with continuous grazing and animal load 0.69-0.8 LU:ha (hereinafter CC). During the study, paddock AC underwent a change in grazing management that implied a decrease in animal load to 0.8 LU:ha similar to CC, which maintained its management. As shown in Gomez Miller13, the animal load had a variation of 12% in the period of study and in all farms.
The study unit was the deep-soil plant community14 within each paddock.
2.2 Weather information
The region has an average annual temperature of 19.4 °C with an average of 25.2 °C in summer and 13.6 °C in winter15. During the study period (spring 2013-summer 2015) the evolution of the temperature was similar to the seasonal average for the period 1980-2009, with an annual average of 20.3 °C15. As for rainfall, the accumulation for the spring 2013-summer 2015 period was higher than the accumulated annual average for the region (1992 mm vs 1339 mm)15. At seasonal level, the highest rainfall records were in spring 2013 (388 mm) and summer 2015 (423 mm) (Table 2).
Table 2: Precipitation and temperature, historic average vs 2013-2015 average
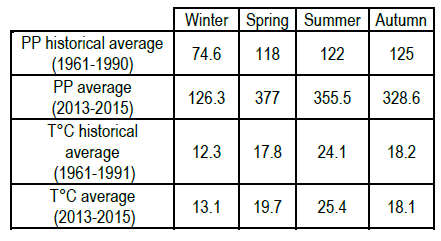
Source: Based on INIA15. PP: precipitation (mm); T°C: temperature (°C).
2.3 Measurements
The ANPP was determined by the regrowth technique using three mobile cages of 1 m2 per paddock, installed with prior homogenization of the vegetation at a height of 1 cm. The regrowth harvest was carried out every 45-55 days in two squares of 0.5×0.2 cm with scissors and a remnant height of 1 cm16. The harvested material was dried in a forced-air oven at 60 °C for 48 hours. The floristic composition was estimated by the cover:abundance of the species using the Braun-Blanquet scale modified by Lezama and others14. In the case of the Cyperaceae, the species level was not reached, so the determinations were made at family level. Recordings were made in a 1 m2 square inside the cage each time cuts were made to determine growth, and in five similarly sized squares outside the cage in fall and spring to consider possible seasonal changes. The RUE coefficient was estimated from the absorbed photosynthetically active radiation (APAR) and the aboveground net primary production (ANPP) following the Monteith equation9: RUE = ANPP / (APAR×10). APAR was calculated from fPAR obtained from synthetic images of improved vegetation index (spatial resolution 250×250m, US Geological Survey) and photosynthetically active radiation (PAR) calculated as 48% of incident solar radiation using radiation data from the agro-climatic stations of the Instituto Nacional de Investigación Agropecuaria (INIA)17. The following equation was used: APAR = fPAR×PAR.
2.4 Statistical analysis
The average daily growth rates for each farm and treatment were calculated from the ANPP data. Growth rates were analyzed from ANOVA using LSD Fisher test to compare differences between treatment means at baseline. Seasonal growth rates for each treatment were then calculated and analyzed through ANOVA using LSD Fisher test to compare separately the effect of each treatment over time. The average daily growth rates at baseline (spring 2013-summer 2014) and at the end of the study (spring 2014-summer 2015) were also calculated separately, and ANOVA was performed using LSD Fisher test to compare the difference between the means of the two treatments at both times. To carry out these analyzes, the InfoStat software was used18.
The floristic composition data at species level were standardized and grouped into functional groups19 in C4 grasses, C3 grasses, forbs, bushes, legume and graminoids; and analyzed with multivariate ordering techniques, carrying out principal component analysis to estimate variability between measurements and identify associations between functional groups20.
The data of the RUE coefficient obtained for the total period evaluated in all farms and treatments were grouped according to the season and the year in order to estimate the existing seasonal variability. Therefore, the data were analyzed from an ANOVA comparing the difference between the means for each season and year. Then, an ANOVA was performed for each treatment separately to compare the difference between the means at the beginning (spring 2013-summer 2014) and at the end of the study (spring 2014-summer 2015). Finally, from the data of the RUE coefficient obtained at the beginning of the study, an ANOVA was performed to compare the difference between the means of the two treatments. LSD Fisher test was used in the comparisons and the analyzes were performed with InfoStat software18.
3. Results
3.1 Aboveground net primary production
In both treatments, the obtained ANPP values showed a seasonal variation with statistically significant differences (P<0.05) (Figure 1). In the CC treatment, the highest ANPP values were recorded during summer 2015 (2.88 gDM.m2.day-1) and spring 2014 (2.46 gDM.m2.day-1), while the minimum values were obtained in the winter months of 2013 (0.72 gDM.m2.day-1), spring 2013 (1.19 gDM.m2.day-1), autumn 2014 (1.38 gDM.m2.day-1) and winter 2014 (1.26 gDM.m2.day-1) (Figure 1). Regarding the AC treatment, the maximum ANPP values were obtained in the summer 2015 (3.25 gDM.m2.day-1), while the minimum values were recorded in the winter months of 2013 (0.47 gDM.m2.day-1), spring 2013 (0.79 gDM.m2.day-1) and winter 2014 (0.78 gDM.m2.day-1) (Figure 1).
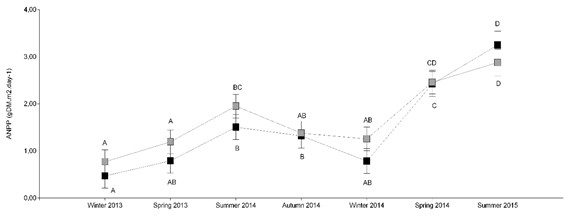
Figure 1: Seasonal variation of ANPP for both treatments. Black squares: AC treatment; grey squares: CC treatment. Different letters mean significant differences, P<0.05 (LSD Fisher test)
Furthermore, the values obtained at the beginning of the study (spring 2013-summer 2014) were significantly different from those obtained at the end of the study (spring 2014-summer 2015), both in the CC treatment (1.57 gDM.m2.day-1 vs 2.64 gDM.m2.day-1, P<0.05) (Table 3) as in the AC treatment (1.15 gDM.m2.day-1 vs 2.79 gDM.m2.day-1, P<0.05) (Table 3).
Table 3 Comparison of the initial (spring 2013-summer 2014) and final (spring 2014-summer 2015) average of ANPP for both treatments

Different letters mean different means, P<0.05 (LSD Fisher test).
When comparing the average APPN values obtained at the beginning of the study period (spring 2013) no statistically significant differences are seen between the two evaluated treatments (1.15 gDM.m2.day-1 vs 1.57 gDM.m2.day-1, P> 0.05) (Table 3).
3.2 Floristic composition
In the main component analysis of the AC treatment, the first two components of the floristic composition explained 98.3% of the variation (Figure 2). The CP1 axis, which explains 56.4% of the variance, represents time evolution since it clearly separates the floristic composition at the beginning (spring 2013 and summer 2014) and at the end (spring 2014 and summer 2015) of the study. At the beginning of the study, the floristic composition of the paddocks with AC livestock management was composed of winter species with C3 metabolism with a high correlation with the CP1 axis (0.96), summer species with C4 metabolism, forbs and legumes, while at the end of the study, the floristic composition was characterized by the presence of graminoids such as the species of the Cyperaceae family (correlation with the CP1 -0.90 axis) and shrubs.
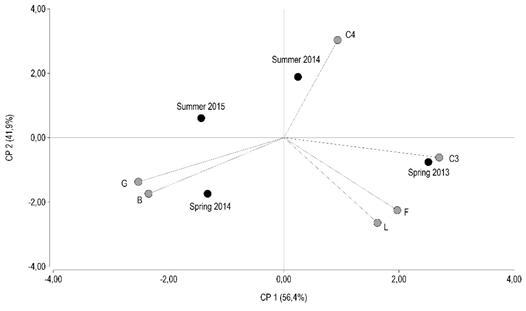
Figure 2: Principal components analysis of floristic composition × season. Treatment AC. G:graminoids; L:legumes; C4:grasses with C4 photosynthetic metabolism; C3: grasses with C3 photosynthetic metabolism; B:bushes; F:forbs
On the other hand, the CP2 axis, which explains 41.9% of the variance, represents the intra-annual variability of the floristic composition since it separates spring from summer (Figure 2). During the spring months, the floristic composition of these paddocks was characterized by the presence of C3 bush species, leguminous species, forbs, and graminoids, while during the summer months (2014 and 2015) grass species with C4 metabolism predominated, being this the variable that had the highest correlation with the CP2 axis (0.93) (Figure 2).
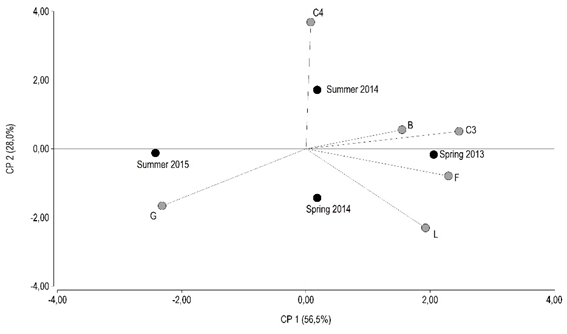
With respect to paddocks with CC treatment, the first two main components explained 84.5% of the occurred variation (Figure 3). The CP1 axis, which explains 56.5% of the variance, separates the summer 2015 season from the rest of the seasons, summer 2014, spring 2013 and spring 2014. According to this axis, the floristic composition of the paddocks with the CC treatment during the summer of 2015 was characterized by the presence of graminoids such as the species of the Cyperaceae family. In the rest of the evaluated seasons, the paddocks with CC treatment had a floristic composition made up of bushes, legume, forbs and C3 species, the latter functional group having the highest correlation with the CP1 axis (0.95). On the other hand, the CP2 axis explains 28% of the variance and separates summer 2014 with a floristic composition of mainly C4 species (correlation with the CP2: 1 axis) from summer 2015, spring 2014 and spring 2013 seasons with a floristic composition characterized by species of graminoids, forbs and bushes (Figure 3).
3.3 RUE coefficient
The values of the RUE coefficient obtained in the total period and for the two treatments showed a seasonal variation with an average of 0.41 g.MJ-1 and a maximum value obtained during the months of spring 2014 (0.62 g.MJ- 1, P<0.05) (Figure 4). Furthermore, the RUE coefficient showed an annual variation given that the values obtained during the second year (spring 2014 and summer 2015) were higher than those obtained during the first year in the months of spring 2013 and summer 2014 (0.25 and 0.37 g.MJ-1 vs. 0.62 and 0.51 g.MJ-1, P<0.05) (Figure 4).
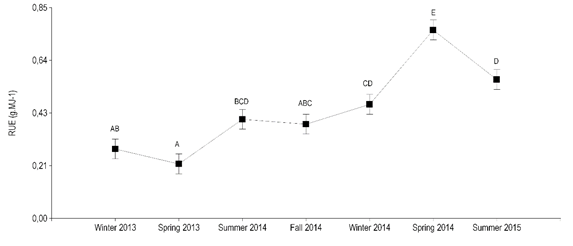
Figure 4: Seasonal variation of RUE coefficient average for all farms and treatments. Different letters mean different means, P<0.05 (LSD Fisher test)
The RUE coefficient values obtained at the beginning of the study (spring 2013-summer 2014) were statistically different (P<0.05) from those obtained at the end of the study (spring 2014-summer 2015) for the AC and CC treatments when comparing the results obtained within each treatment separately (Table 4). The RUE values obtained at the end of the study were higher than those obtained at the beginning both in the CC treatment (0.39 g.MJ-1 vs. 0.61 g.MJ-1) and in the AC treatment (0.22 g.MJ-1 vs. 0.53 g.MJ-1) (Table 4).
Table 4: Comparison of the initial (spring 2013- summer 2014) and final (spring 2014-summer 2015) average of RUE coefficient for both treatments
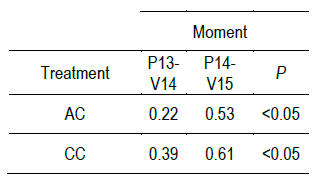
Different letters mean different means, P <0.05 (LSD Fisher test).
On the other hand, when comparing the RUE values obtained in the two treatments at the beginning of the study (spring 2013-summer 2014), it is observed that the average value of the RUE coefficient of paddocks with AC treatment was different from the value obtained in the CC paddock (0.22 vs 0.39 g.MJ-1, P <0.05) (Table 4).
4. Discussion
The ANPP values obtained are similar to those reported by Berreta and others21 in natural fields on deep Basalt soils in years with good precipitations, with maximum peaks in the summer months and minimum peaks in winter. The APAR values had a seasonal variation similar to that of the ANPP with maximum peaks in the summer months and minimum during the winter months. The maximum peaks recorded during the summer months would be associated with the moments with the highest APAR, and could be due to the floristic composition of the paddocks that were mainly composed of grass species with C4 metabolism22)(23.
The highest ANPP values obtained during spring 2014 and summer 2015, within each treatment, would be associated with rainfall and temperatures above the annual average that were recorded during the years in which the study was carried out.
The analysis of the floristic composition grouped by functional groups showed changes in the vegetation of the two treatments over time. During spring 2014 and summer 2015, an increase in the presence of species of the Cyperaceae family was observed, which would be associated with the climatic conditions existing during the study with high temperatures and above-average annual rainfall, added to the effect of grazing on promoting the presence of graminoids species24. Furthermore, the increase of Cyperaceae species classified by Rosengurtt25 as ordinary species with low palatability could adversely affect forage quality26.
The values obtained from the RUE coefficient are similar to those obtained by Oyarzabal and others10 in natural fields on deep basalt soils (0.3-1.0 g.MJ-1), but higher than those published by Baeza and others27 also in basalt fields (0.1-0.3 g.MJ-1). At seasonal level, the values obtained showed a variation in the RUE coefficient with maximum values in the spring and summer months and minimum values in winter. This seasonal variation of the RUE coefficient has been reported by other authors, although with maximum values in winter and minimum in summer8)(10. According to these authors, rainfall (positively) and temperature (negatively) are the main variables that affect the RUE coefficient. This implies that during the summer months in which high temperatures and periods of water deficits are recorded RUE has minimum values. The fact that the results obtained in this work regarding the seasonal variation of the RUE are contrary to those reported by these authors with maximum peaks in summer could be associated with the climatic conditions that were recorded during the evaluated period with rainfall above annual average. The favorable environmental conditions not only allowed maximum RUE values to be recorded in the summer months, but the values of this coefficient that were obtained at the end of the study were higher than those obtained at the beginning for all paddocks and treatments.
However, it is important to note that the RUE values presented here could have a prediction error associated with the work scale given by the size difference between the sites in which the ANPP was determined (exclusion cages of 1m2), and MODIS pixels (approximately 6 ha) from which the APAR data were obtained. Furthermore, since there were small changes in the animal loads during the study, the ANPP values obtained could be given by the residual effect of the animal loads before the study.
Therefore, the comparison of the AC and CC treatments at the beginning of the study showed differences regarding the RUE coefficient without ANPP differences. Thus, the RUE coefficient was higher in paddocks with CC treatment than in those with AC treatment. This RUE difference between treatments could be due to the differences in the diversity of the deep soil of basaltic communities of the two treatments, that would imply differences in the floristic composition, as reported by Nouvellon and others28.
5. Conclusions
Changes in the floristic composition, ANPP and in the RUE coefficient were recorded throughout the study in the two treatments that were mainly associated with rainfall and temperatures above the annual average recorded during the evaluated period. The RUE data obtained will help to estimate more accurately the ANPP in natural grasslands on deep soils of the basaltic region.

