


 Inglés (pdf)
 Articulo en XML
 Referencias del artículo

 Permalink
1. Introduction
Faecal egg count (fec) is used in sheep as a management tool to decide when to drench in order to reduce the parasite burden1. It is also used in sheep genetic evaluations, where selection for low fec is the aim2. In the latter case, fec recording should be carried out when the parasite burden is large enough to allow the expression of between animal variation. National and international protocols suggest drenching or recording the whole group when a fec range of 500 to 1000 is reached. It is also sought that the fraction of animals with a fec of zero should be less than 0.13)(4. In order to decide when to drench, or to record fec in the whole contemporary group in the case of genetic evaluations, a random sample of animals is monitored for fec. Two questions arise: (i) what is the necessary sample size to determine if average fec reached a value of 500 or 1000? and (ii) what is the necessary sample size to determine that the fraction of animals with fec equal to zero is less than or equal to 0.1?
Collecting faeces and recording fec is time consuming and costly. If the number of animals sampled is too large, time and money will be wasted. By contrast, if the number sampled is too small, the information gathered will be of no value, and the resources used would have been wasted. In order to determine the necessary sample size, one has to decide the accuracy with which to estimate the population parameters, based on the sample. Sample size will be the result of a balance between the desired accuracy of the estimate, and the effort and cost entailed in obtaining it.
Practical guides on internal parasite control recommend some target values. WormBoss5, the Australian program for the control of internal parasites in sheep and goats, recommends sampling no less than 20 animals, whereas Fiel and others6 in Argentina recommend a minimum of 10 animals, and “ideally”, 20. In Uruguay, Pereira7 recommends a minimum of 15 animals and an average fec of at least 600 to 800. Also in Uruguay, Castells8 recommends monitoring 15 to 20 animals, and recording the whole group when the average fec in the sample is greater than 500 and the animals with a record of zero are less than 20%.
In this paper we present a logical framework (theory and examples) to work out the sample size of monitored animals in order to decide when to drench or when to record fec in the whole contemporary group. The treatment of the subject matter follows the methodology given in statistical textbooks such as Freund9, Ott and Longnecker10, and Snedecor and Cochran11.
2. General considerations
There are two main considerations we should make when determining the necessary sample size: (i) specify the “tolerable” error, that is, the desired magnitude of the confidence interval, and (ii) establish the confidence level with which to make the estimate.
If we specify a confidence interval that is too broad, the estimate of the mean (µ) will not be very informative. Similarly, a low level of confidence will probably result in an erroneous confidence interval that might not include µ. By contrast, if we establish a narrow confidence interval and a high level of confidence, the necessary sample size may be too large and difficult to justify in terms of time and cost. That said, what constitutes an appropriate degree of certainty?
In practice, a confidence level of 95% is often chosen. This has been generally adopted in agriculture because it may be argued that it is acceptable for biological variables related to production12. In the long term it results in a probability of 1 in 20 of not including the parameter value of the population, a situation that may generally be considered acceptable for the type of work in question. The “tolerable” error depends on the context, namely, our knowledge about the implications of variability in the character under study. For example, we could establish a tolerable error of 200 or 400 for fec, implying confidence limits of 1000 ± 100 or ± 200, respectively. In the case of fraction of animals with zero fec, the tolerable error could be 0.02 or 0.04, corresponding to confidence limits of 0.1 ± 0.01 o ± 0.02, respectively.
3. Theory
Call µ and ȳ the population and sample mean, respectively. If we take a sample of size n, the standard error (S) of ȳ is equal to: S y = σ n 1-Φ , where σ is the standard deviation of the character in the population, Φ = n/N (fraction sampled) and N is the population size. When n is small relative to N (say, Φ < 0.1) the fraction sampled may be ignored without fear of incurring in any important error11. This means that the standard error of the mean in the sample is more dependent on the sample size than on the population size. We ignore Φ in the derivations that follow but we shall consider it later in relation to the correction for finite size of the sampled population.
Three factors determine the confidence interval estimated for a population mean µ from a sample: (i) the desired confidence level (z α/2 value, i.e. 1.96 for 95%), (ii) the standard deviation of the character, and (iii) the sample size. We may infer the magnitude of the standard deviation from earlier samplings or from other studies of the character in question.
Assume we wish to estimate µ with a confidence interval (tolerable error) E. The confidence limits are ȳ ± L, where ȳ is the sample estimate of µ and L = E/2. For a confidence level of 95%, our estimate of µ is: 𝑦 ± 1.96𝜎 𝑛 . Thus, 𝐿= 1.96𝜎 𝑛 , where σ is the standard deviation of the character and n is the sample size. Rearranging, we obtain: 𝑛= 1.96 2 𝜎 2 𝐿 2 . Consistent with what we earlier stated, sample size does not depend on the total number of animals in the population under study. We return to this point later in the paper in relation to small populations.
We treat the fraction of animals with zero fec as having a binomial distribution. Then, 𝐿=1.96 𝑝𝑞 𝑛 , where p and q are the proportion of animals with zero and greater than zero counts, respectively. Rearranging, we obtain: 𝑛= 1.96 2 𝑝𝑞 𝐿 2 . Note that p, q and L may be expressed as a proportion or as a percentage, but when performing calculations, the same unit must be used for p, q and L.
4. Results from a few examples
4.1 Estimating mean fec
Our experimental records of fec show that the standard deviation is always of similar magnitude as the mean, and often somewhat greater (~10 to 20%). This is consistent with the mean and standard deviation values reported by Goldberg and others13 for 8 to 12-month-old sheep. Hence, the mean and standard deviation values of fec chosen in Table 1.
Table 1: Necessary number of animals to be sampled to estimate fec with different confidence intervals, for a range of population means and standard deviations
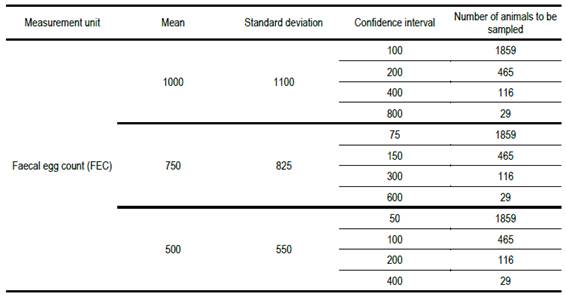
When the desired confidence interval for the estimate of mean fec is 10% of the population mean value, the required number of animals to be sampled is prohibitively high. It is only when the confidence interval is 80% of the population mean value that the necessary number of animals to be sampled is near the number sampled in practice (20). A sample of 20 animals implies a confidence interval of 96% of the population mean.
4.2 Estimating the fraction of animals with fec equal to zero
There are reports indicating that a large fraction of internal parasites in a flock may reside in a relatively small fraction of the animals3. This may be the reason why in the implementation of internal parasite control programs there is sometimes a requirement that the fraction of animals with fec equal to zero should not exceed 0.10, recorded with a precision of 100. The fraction of animals with fec equal to zero is calculated from the same sample used to estimate mean fec.
Our experimental records show that for mean fecs of 1000, 750 and 500, the corresponding fraction of animals with a fec of zero is around 0.05, 0.10 and 0.15, respectively. The values chosen in Table 2 to calculate the necessary number of animals to be sampled are consistent with this experience.
Table 2: Number of animals to be recorded for fec to estimate the fraction with zero count with different confi-dence intervals, for a range of population means and standard deviationsA - Calculated as (pq)0.5, where p is the fraction of animals with fec of zero
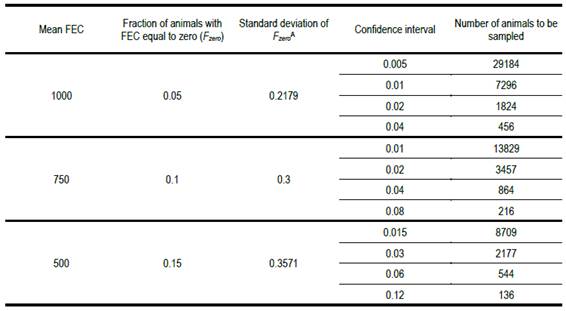
A - Calculated as (pq)0.5, where p is the fraction of animals with fec of zero
When the confidence interval with which we wish to estimate the fraction of animals with a zero fec is 10% of the population mean value, the necessary number of animals to be sampled is extraordinarily high. It is only when the confidence interval is 80% of the mean and the fraction of animals with a zero fec is 0.15, that the necessary number of animals to be sampled nears something that may be practicable. Note, however, that even in that case, the number is seven times greater than what the guidelines state. The recommended number (20 animals sampled) implies a confidence interval more than twice as large as the population mean. The recommended practice is questionable. The results in Table 2 show that it is not possible to adequately estimate the fraction of animals with a zero fec from a sample of animals smaller than 100.
5. Discussion and conclusions
In the calculations leading to the results presented in Tables 1 and 2 we ignored the correction for small populations mentioned by Snedecor and Cochran11. These authors recommend making the correction when the fraction of sampled animals is greater than 10% of the total. In such cases the value of n should be corrected as follows: 𝑛 𝑐 = 𝑛 1+𝛷 , where n c is the number of animals to be sampled corrected for finite size, and Φ is the fraction sampled. Snedecor and Cochran11 indicate that when the sampled fraction is smaller than 10% the correction is unnecessary.
Table 1 shows that the necessary number of animals to be sampled, for a range of confidence intervals of 10 to 80% of the mean, is greater than the greatest number currently recommended of 20. The same result is obtained for different mean fecs because we assumed confidence intervals proportional to the mean. The calculations also assume that fec is normally distributed or approximately so. We know that, particularly in small populations, that assumption is unlikely to be satisfied. This would make the problem even more serious.
As an example, using round numbers, for the case in Table 1 where the necessary number of animals to be sampled is 116 animals, if the total number in the group was 232, the correction would result in n c = 116 / (1 + 0.5) = 77,3 ~ 77, smaller than 116, but still much greater than the currently recommended sample size. If the most commonly encountered situations were defined, tables could be developed as a guide for populations in which the fraction sampled was greater than 10% of the total.
Table 2 shows that the necessary number of animals to be sampled to estimate the fraction with a zero fec is very high, even if we assume a fraction 0.15 have that value. This indicates that a sample of 20 or fewer animals is far from satisfactory. Even in the most favourable case (p = 0.15 and a confidence interval of 80% of the population mean) the necessary number of animals to be sampled is almost seven times greater than 20, the maximum number currently recommended.
Jointly considered, Tables 1 and 2 show that the current guidelines regarding number of animals to be sampled for fec suggest a number much smaller than that emerging from the present statistical study. Internal parasites in sheep have been mainly controlled by treatment with anthelmintics. This strategy has not been entirely successful. Among other problems, the parasites have developed resistance to some chemical groups, making treatments less effective, or in extreme cases, totally ineffective. At best, decisions about when to drench are made on the basis of fec performed in a sample of 10 to 20 animals. This sample size is well below the recommendations emerging from our statistical study of the problem. It is difficult to avoid the conclusion that the inappropriate (much smaller than required) sample size on which decisions about when to drench are made is at least partly responsible for the failure to control internal parasites in grazing sheep. Given the insufficient sample size currently used, we recommend that guidelines should be revised and that, based on statistical criteria, they should be reformulated.

