Inglés (pdf)
 Articulo en XML
 Referencias del artículo

 Permalink
1. Introduction
The importance of wheat in Uruguay is verified for being both the main winter crop1 and the main source of calories2. Globally, the average consumer demands are constantly growing, which forces the industry to meet increasingly stringent wheat quality requirements3.
It is very difficult to predict the exact behavior flour will have when baking, but there is a general consensus on a series of requirements: firstly, the industry will need the batch to be homogeneous4. In turn, for flour to have a good baking process it must include strong gluten, high protein content, low alpha-amylase activity content, and hard grain5. From these characteristics, the protein content, which basically depends on the nitrogen availability in the soil, has become the main limiting factor in the quality of Uruguayan wheat, due to the impoverishment of the soil from changes in agricultural practices6.
The complexity of how to obtain quality wheat increases when verifying that its main attribute, “baking strength”, is an ambiguous concept that allows multiple interpretations. The most generic explanation found was given by Wooding and others7, who defined it as the capacity the dough, obtained with flour and water, must have to support the structure of the bread when the dough leavens. In turn, it has been applied as a synonym for the broader concept of “flour quality”8 or functionality9; other times, it has been used as an equivalent of high protein content, good mixing properties10 and even resistance to extension11.
If there is no consensus on what baking strength is, let alone on how to measure it12. Varied equipment has been developed to measure the rheological properties of the dough formed with flour and water13, and new devices14)(15) are still being proposed. All of them generate valuable information, but none fully satisfies. Of all the devices, the most used by the Uruguayan industry is the alveograph (Chopin Technologies), which provides an “alveogram”16.
The alveogram is obtained from a dough prepared in a completely standardized way, mixing water, flour and sodium chloride. After a rest, the dough is extended so as to generate a balloon that inflates with constant airflow. The equipment allows recording the resistance to this extension until the balloon breaks. The alveogram is the graph of extension resistance versus time, from which several important parameters16) can be obtained. “L” or “extensibility” measures how much the dough can be extended without breaking, and it is the one that best relates to the volume of bread17. Another relevant parameter is “P” or “maximum extension resistance”, highly related to the shape of French bread18. “W” or “baking strength” is the most commonly used in markets, which is the energy needed to break that balloon, proportional to the area under the curve13.
Despite the multiple points of view found in the bibliography on what strength is and how to measure it, there is a clear consensus that the unique properties of wheat dough are due to the endosperm proteins. When flour is mixed with water, many of the reserve proteins are rearranged to form a structure known as gluten. Wheat endosperm proteins can be divided into four groups (albumins, globulins, gliadins, and glutenins) according to their solubility. Gluten is formed by the interaction between gliadins and glutenins. The base structure consists of glutenin polymers, which interact by different types of non-covalent bonds mainly with gliadins, but also with other dough components, such as pentosans, water, starch granules, etc.19.
It has been demonstrated that the key to wheat quality variability lies in the relative composition of the different gluten fractions. On the one hand, it is important to have a high content of gliadins to ensure greater extensibility. On the other hand, polymers of high molecular weight are key to assemble a stable structure that generates an elastic dough19)(20.
Different researchers conduct various studies on protein synthesis, storage, and polymerization in maturing grains21. Quality depends not only on the genotype, but also on the environment22. In particular, the gluten-forming protein composition is highly influenced by the environment23, although it has been proposed that both the accumulation and polymerization of gluten-forming proteins are predetermined24.
The most comprehensive and representative description reported on the components of wheat proteins has been achieved using different techniques of size exclusion high-performance liquid chromatography (se-hplc). Through this technique, four region chromatograms have been obtained, corresponding, in order of elution, to larger glutenin polymers, smaller glutenin polymers, larger monomeric proteins, and smaller monomeric proteins23)(24. As some polymers are very large, they cannot be extracted in any buffer, not even using sds. But Singh and others25 adjusted an extraction procedure in two successive steps, using sonication in the second, which solubilizes most proteins.
This study aimed to understand the relationship between the different proteins that compose Uruguayan wheat gluten with alveographic parameters, and how they are affected by genotype, environment, and their interaction. When studying the effect of the environment, it was intended to work with the most relevant environmental effect of the quality of Uruguayan wheat: nitrogen availability during grain filling.
2. Materials and Methods
2.1 Samples
To meet the objectives, a set of samples that could represent the variability of the wheat harvested in Uruguay was designed. Samples were selected from two tests with differential management to obtain different protein levels and from different locations, representative of the production area. Grain samples from 16 commercial wheat cultivars (Triticum aestivum L.) were analyzed from tests with two replications, carried out with differential nitrogen fertilization management, sown in 2014 in two locations of the main wheat area of Uruguay: La Estanzuela (-34.3444, -57.6997) and Young (-32.6831, -57.6575). Genotypes of different origins were selected; they were commercial cultivars in Uruguay or with potential to do so, namely: Arex, Fuste (Biotrigo Genética, Brazil), ACA 902 (Asociación de Cooperativas Argentinas), Klein Nutria (Criadero Klein s.a., Argentina), tec 10, tec 12 (Fundacep ccgl, Brazil), Génesis 2375, Génesis 6.81, le 2331 inia Don Alberto, le 2332 inia Madrugador, le 2333 inia Carpintero, le 2409 (inia, Uruguay), Biointa 1006 (inta, Argentina), Baguette 501 (Nidera Semillas, s.a., Argentina), syn 200 and syn 300 (Syngenta Crop Protection ag, Argentina). The plots had six rows 17 cm apart, 5 m long. In La Estanzuela trial, fertilization was carried out similarly to the commercially recommended, following the model proposed by García26. In order to achieve variability in protein content, Young's trial received additional fertilization in the Z50 to Z60 state (between booting and flowering) with ammonium nitrate at a dose equivalent to 30 kg/ha of nitrogen. For all the materials and jointly, preventive disease controls were carried out with fungicides at the appearance of the first symptoms.
2.2 Evaluation of wheat baking quality by means of conventional parameters
Wheat protein (wp) was determined in ground whole grains by near-infrared spectrophotometry (Unity Scientific 2500X trw SpectraStar, Unity Scientific, ma, usa) calibrated by Kjeldahl27. It is reported on a dry basis.
Alveogram was performed using the international standard technique28 (Chopin Alveograph ma 95, Chopin Technologies, France), obtaining the baking strength or alveogram W (aw, expressed in Joules/1000), maximum resistance to extension or alveogram P (ap, expressed in mm) and extensibility or alveogram L (al, expressed in mm).
2.3 HPLC
Size-exclusion hplc runs were performed in duplicate based on the protocol described below, developed in La Estanzuela for this study, based on Singh and others25, and Johansson and others23.
For each sample, two subsequent extractions were performed: first, the “extractable” proteins were extracted, and second the “non-extractable” ones. 16.6 mg of each flour were weighed in 2 mL Eppendorf tubes for extractable proteins. 1.4 mL of sds (sodium lauryl sulfate)-buffer were added to each tube and stirred in a shaker (Minibead Beater-96 Biospec) for 5 minutes. Then, the samples were centrifuged (Centrifuga Labnet HermLe) at 17000 g for 30 minutes. The supernatant was transferred to another Eppendorf and immediately heated in a water bath at 80 ºC for 2 minutes. Finally, the samples were cooled at room temperature, filtered by a regenerated cellulose filter of 0.20 um (Minisart rc), and placed in vials for analysis. To determine non-extractable proteins, 1.4 mL sds-buffer were added to the pellet obtained from the previous extraction and it was sonicated (Branson Sonicator) in amplitude 5 for 90 seconds. Then, the procedure continued from centrifugation as in the previous extraction.
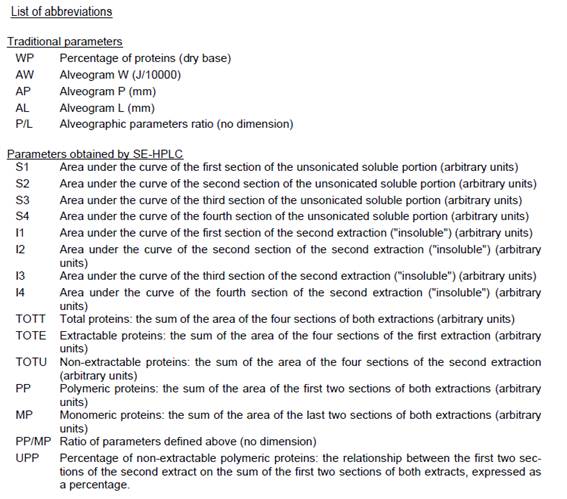
Protein extracts were analyzed in a Shimadzu lc-20 system with automatic injection of 20 uL and fractionated with a BioSep sec-s4000 (Phenomenex) column using a Security Guard (Phenomenex) pre-column. Phosphate buffer pH 6.9 containing 0.1% of sds, at a flow of 0.2 mL/min was used as a mobile phase. Following already published criteria29, the chromatograms obtained were divided into five sections; for the extractable (or soluble) proteins, the sections were identified as S1, S2, S3, and S4, discarding the fifth section. The chromatograms of the non-extractable proteins (or insoluble, in the first extraction condition) were divided at the same times and identified as I1, I2, I3 and I4. In both cases, the fifth section was discarded since, when running control samples, it could be verified that it corresponds to the sds-buffer. Standard chromatograms are shown in Figure 1.
“Total proteins” (tott) was defined as the sum of all four sections of both extractions (S1 + S2 + S3 + S4 + I1 + I2 + I3 + I4); “total extractable proteins” (tote) as the sum of the first four sections of the first extraction (S1 + S2 + S3 + S4); “total non-extractable proteins” (totu) as the sum of the first four sections of the second extraction (I1 + I2 + I3 + I4); “polymeric proteins” (pp) as the sum of the first two sections of both extractions (S1 + S2 + I1 + I2); “monomeric proteins” (mp) as the sum of the third and fourth sections of both extractions (S3 + S4 + I3 + I4); “polymeric-monomeric ratio” as the quotient pp/mp, and “percentage of unextractable polymeric proteins” (upp) as {(I1 + I2)/(I1 + I2 + S1 + S2) x 100}.

2.4 Statistical analysis
Correlation coefficients were determined and variance (anova) and principal components (pca) analyses were performed using the InfoStat30) package.
3. Results and discussion
3.1 Descriptive Statistics
Table 1 presents the descriptive statistics of the main parameters, both for the samples total, and separately for each environment. The results show a wide range of wp, going from a relatively low value for Uruguayan harvest (11.4%) to a desirable value, but uncommon at commercial level (16.2%). In particular, it is noticeable that the environment ranges almost do not overlap, since in La Estanzuela it goes from 11.4 to 13.9%, and in Young it goes from 13.5 to 16.2%; it is estimated that this difference between environments is not due to the localities, but is the one expected due to the differential fertilization used to obtain the samples, and confirms the usefulness of the sample set employed.
Table 1: Descriptive statistics of traditional quality data (protein content and alveographic parameters) and hplc parameters (gluten-forming proteins) of the total samples of Uruguayan wheat analyzed and of two studied environments.
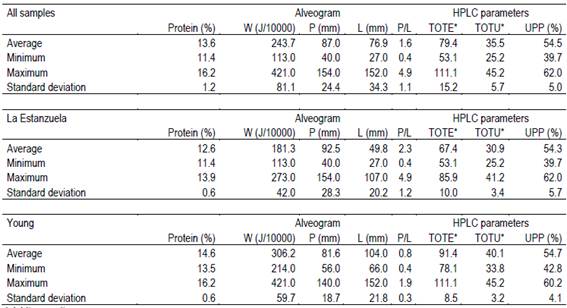
* Arbitrary units tote: total area of the first chromatogram; totu: total area of the second chromatogram, upp: percentage of non-extractable polymeric proteins.
The total average of aw (243 J/10,000) is within expectations in Uruguay, but the range of 113 to 421 J/10,000 is broader than the observed at commercial level, although similar to those obtained at experimental levels. As expected, in the environment with the highest wp, Young, the highest average W was obtained (181 versus 306 J/10,000). The difference between the average ap of both environments is smaller (93 versus 82 mm) because this parameter is more determined by the genotype than by the environment, but it is larger between the al (50 versus 104 mm), which is expected, since it mainly depends on the protein content18.
The difference between the environments of the hplc quantitative parameters (tote and totu) is relatively high: the average of the environment with the highest protein content is 30% or higher. On the other hand, the difference between upp environments, which characterizes protein types rather than quantifying them, is smaller than 1%; however, within each environment, the maximum is 55 and 40% higher than the minimum, respectively for La Estanzuela and Young; that is, high variability is observed between genotypes within the same environment.
3.2 Correlations
The traditional quality parameters (protein quantity and alveographic parameters) showed a high correlation with the values obtained with the hplc (Table 2).
Table 2: Correlation coefficients between traditional quality parameters (protein content and alveographic parameters) and the hplc parameters (gluten-forming proteins) from Uruguayan wheat samples.
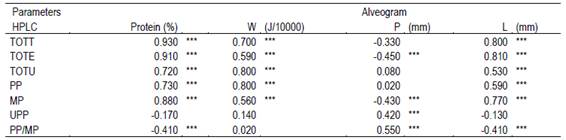
tott: total area under both chromatograms, tote: total area of the first chromatogram; totu: total area of the second chromatogram, upp: percentage of non-extractable polymeric proteins; pp: polymeric proteins; mp: monomeric proteins; pp/mp: polymeric proteins to monomeric proteins ratio. *** Significant at P<0.001 n=64
wp showed a highly significant correlation (P <0.001) with tott, tote, totu, pp, and mp, as expected since all these parameters quantify proteins. It should be noted that the highest correlation coefficient corresponded to tott (r=0.930), which is reasonable because both are estimators of the total protein amount. The correlation with the pp/mp ratio was also significant, although with a lower coefficient and negative (-0.410). Both pp and mp increase with wp, but monomeric proteins have been reported23)(24 to increase at a higher degree as protein content increases. In fact, the correlation coefficient of wp with mp (0.880) is greater than that corresponding to pp (0.730; Table 2). The high correlation with the rest of the parameters emphasizes the non-correlation of wp with upp, an estimator of protein quality, not quantity.
It is noteworthy that al had highly significant correlations with the same hplc parameters as wp, that is, with all but upp, and negative with pp/mp. This confirms the high relationship of extensibility to protein content31.
aw also had highly significant correlations (P<0.001) with tott, tote, totu, pp, and mp, but it was not significant with pp/mp. Although this is similar to what happened with wp and al, there is a clear difference in that the highest correlation coefficients correspond to totu and pp. Both parameters are related to protein size, since, on one hand, totu measures proteins that are not extracted with sonicating, which tend to be larger, and on the other, pp are the larger proteins by the parameter definition. In short, the correlations of the different hplc parameters allow us to suppose that, although the total protein content had an impact on the baking strength, in particular, the bigger proteins were the ones that influenced the most.
Correlations were different with ap than with the rest of the traditional parameters: not only were they not significant with tott, totu, and pp, but also, the correlation coefficients were negative with tote and mp, although they were significant. Furthermore, the highest correlation of pp/mp was with ap, and it was positive; that is, the larger the proteins, (higher pp/mp) the greater the maximum resistance to extension. This agrees with the models that assume that the resistance to extension is explained by the presence of large polymers32.
The only significant correlation of upp was with ap. upp is the percentage of polymeric proteins that can be extracted after sonication (known in the international literature as “unextractable”), with respect to the total polymeric proteins. The higher the upp, the greater the number of polymeric proteins that could not be extracted without sonication due to their big size. In other words, it is an estimator of the size of polymeric proteins. The significant and positive correlation between upp and ap shows once again the relationship between protein size and resistance to extension.
3.3 ANOVA and variance components
The anova results for the different parameters studied showed that genotype, environment and their interaction significantly influenced almost all the parameters studied, as can be seen in the parameters reported in Table 3. For the hplc individual peaks, the results were similar to those of tote and totu (data not shown). The only exception is upp, which is not significantly influenced by the environment.
To carry out a deeper evaluation, the variance components of the most relevant parameters are presented in Table 4. The environment explained 96 to 97% of the variability for wp, aw, al, tote and totu, as well as for all peaks (data not shown). This is expected, since protein is highly influenced by the environment22)(26)(33, and the other parameters are highly correlated with the protein. Furthermore, it is known that higher protein content increases strength and extensibility31)(34; in turn, tote and totu directly measure the total of soluble and insoluble proteins, respectively.
Genotype influence was similar to that of the environment for both ap and pp/mp ratio.
Table 3: anova values (P-value) of traditional parameters (protein content and alveographic parameters) and of the most relevant hplc values (gluten-forming proteins) from samples of 16 wheat genotypes in two Uruguayan environments.
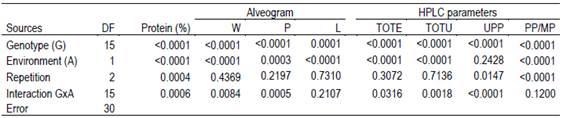
DF: degrees of freedom; TOTE: total area of the first chromatogram; TOTU: total area of the second chromatogram, UPP: per-centage of non-extractable polymeric proteins; PP/MP: polymeric proteins to monomeric proteins ratio.
Table 4: Variance components (%) of traditional parameters (protein content and alveographic parameters) and of the most relevant hplc values (gluten-forming proteins) from samples of 16 wheat genotypes in two Uruguayan environments.
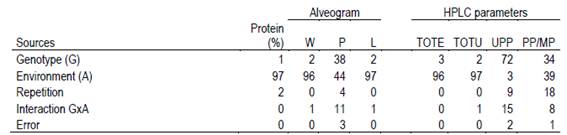
tote: total area of the first chromatogram; totu: total area under the second chromatogram, upp: percentage of non-extractable polymeric proteins; pp/mp: polymeric proteins to monomeric proteins ratio.
Both parameters are influenced not only by the quantity but also the quality of proteins. Therefore, this can be explained with the traditional theory that the quantity of proteins is influenced by the environment, and the quality by the genotype33.
Finally, most of upp variability was due to genotype influence (72%, Table 4). This suggests that the upp may be a useful parameter to detect varieties with adequate protein quality, since it is a cultivar inherent characteristic.
3.4 Principal component analysis
The first two components of the principal component analysis explained 77% of the variability. The load values of the analyzed parameters are presented in Figure 2. In the biplot it is clear that the three alveographic parameters are in independent zones, and each one is associated with a group of hplc parameters.
The region with high values of the first principal component (pc1) and positive but low values of the second principal component (pc2) (marked with a solid line circle) contains not only the two total protein quantity estimators (wp and tott), but also the extensibility (al) and various hplc parameters, in particular the estimators of lower molecular weight proteins (tote and mp), in addition to several individual peaks (S1, S2, S3, and I3), which confirms the relationship between the total amount of protein, amount of lower molecular weight protein and extensibility. In the area where both pc1 and pc2 have high values, aw, pp, totu and I2 are closely associated (marked with a gray ellipse). Therefore, the high number of large proteins are the ones associated with the baking strength.
The quadrant of negative pc1 and positive pc2 values contains the other three parameters (marked with a dotted line ellipse): ap, upp and pp/mp. As already mentioned, these last two are estimators of high relative molecular weights of proteins, which in turn is related to the resistance to extension (ap).
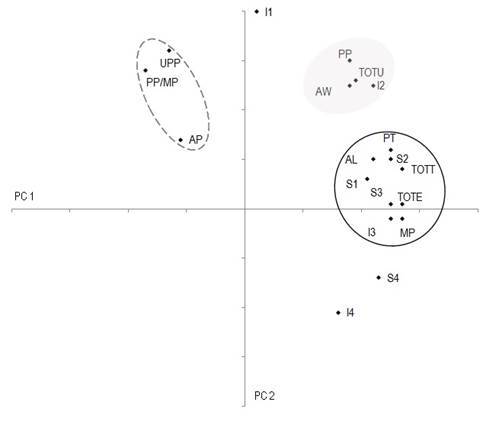
Figure 2: Loads of the first two components of the principal component analysis of the analyzed parameters. Three regions are marked, where related parameters are grouped, namely: high pc1 values and pc2 values close to 0, related to high total protein content, extensibility and high monomeric protein content, marked with a continuous line circle; high pc1 and pc2 values, related to baking strength and high polymeric protein content, marked with a gray ellipse; and negative pc1 and positive pc2 values, related to high molecular weights of polymeric proteins and resistance to extension, marked with a dotted line ellipse.
4. Conclusions
A strong relationship between different hplc parameters and the traditional quality parameters was demonstrated. In particular, it became clear that different parameters that define the characteristics of the complex wheat protein mixture are related to the different rheological properties necessary for good bread. First, it needs to have high extensibility, which is achieved with high protein content, estimated by wp or tott, but mainly with high extractable protein content, estimated by tote. Likewise, the dough has to be strong, which is achieved with a high content of high molecular weight proteins, estimated by totu, and with the size of the polymeric proteins, estimated by upp. Finally, it needs to have a good resistance to extension, which increases with the size of the polymeric proteins, associated with upp. These observations confirm that, in order to achieve wheat that meets the multiple rheological requirements that proper baking requires, it is necessary to maintain a delicate balance between different protein components.