


 Inglés (pdf)
 Articulo en XML
 Referencias del artículo

 Permalink
Introduction - Why integrating sensory evaluation into plant breeding programs?
Growers and marketers are facing many challenges in order to reach and maintain vegetable quality, balancing product origin from a natural crop exposed to ambient fluctuations and agronomic decisions that drastically impact on nutritional quality and contribute to the inherent sensory variability of plant-derived products. Traditionally, plant breeding goals have focused on increasing yield, product firmness, shelf life and pest tolerance, combining ambient adaptation and agronomic management, without making focus on the sensory characteristics of the products1. However, understanding which sensory characteristics/traits appeal to their customers is key to determine strategies to enhance the marketability and consumption of fruit and vegetables2.
The addition of sensory information into plant breeding programs provides breeders with unbiased tools to measure otherwise subjective fruit quality traits. Combining consumer preferences with descriptive information about the sensory characteristics of products can contribute to the development of consumer-driven improvements in diverse agronomical commodities2)(3)(4.
In this context, the objective of the present work is to describe a series of successful experiences where the sensory evaluation has contributed to breeding programs in order to develop cultivars with enhanced sensory characteristics and a higher likelihood of succeeding in the marketplace.
Sensory evaluation: Analytic and hedonic approaches to the sensory characteristics of fruit and vegetables
Sensory evaluation is a scientific discipline that ‘evokes, measures, analyzes, and interprets responses to the characteristics of products that are perceived by the senses’5. This discipline can be basically divided into two main areas: analytical tests, aimed at obtaining an objective of the sensory characteristics of products, and hedonic tests, aimed at evaluating consumers’ hedonic reaction to products6. In the following sections, a brief description of some analytic and hedonic tests is provided. Interested readers are advised to refer to sensory evaluation textbooks for additional details, as well as recommendations for best practice on how to design sensory tests5)(7)(8.
Analytic tests
Sensory evaluation uses different tests to gather objective information about the sensory characteristics of products5. Sensory characterization is the most relevant analytic test for breeding programs. It aims at obtaining a complete qualitative and quantitative description of the sensory characteristics of a product7.
Sensory characterization has been traditionally conducted with trained assessors, who are selected based on their superior sensory acuity and ability to discriminate among products5. After selection, the assessors are trained to recognize, describe and quantify the sensory characteristics of the target products in an objective and reliable way7.
Descriptive analysis has been regarded as the golden standard for sensory characterization9. It involves three main steps: descriptor generation, assessor training and sample evaluation7. In the first step, 8-12 assessors, previously selected using standardized procedures, select the attributes that describe the sensory characteristics of the target product and agree on their definition and how to evaluate them10. References are selected to facilitate the identification of the attributes and the quantification of their intensity11. The second step consists of training the assessors on how to recognize the sensory attributes and rate their intensity using 10 cm or 15 cm line scales7. The main aim of the training process is that all the assessors evaluate the sensory characteristics of products in the same way, which is the basis for the accuracy and repeatability of descriptive analysis. Depending on the product category, the training process can require up to 120 hours8. Once the training is finished, the assessors evaluate the products, at least in triplicate. The average intensity of all the evaluated sensory characteristics across assessors and replicates is calculated and differences between products can be determined using inferential statistics.
Although descriptive analysis provides detailed and reliable information, it is time and resource consuming, which limits its application in many breeding programs. In the last decade several alternative and flexible methods for sensory characterization have been developed, which can be conducted with assessors with different degree of training, from trained assessors to untrained assessors (which are usually consumers of the target product category)9. These methods have been proved to provide accurate and reliable information about the sensory characteristics of products12)(13. Alternative methods use different approaches to describe the sensory characteristics of products. The most common are the evaluation of sensory characteristics and holistic methods that rely on the evaluation of global similarities and differences among products13.
Methods based on the evaluation of sensory characteristics require assessors to focus on specific attributes, similar to what trained assessors do when conducting a descriptive analysis. Check-all-that-apply (CATA) questions are the most popular attribute-based method for sensory characterization with consumers14. They basically consist of a list of 10-40 terms from which consumers should select all that apply to describe the product. The percentage of consumers who select each of the terms to describe each sample is calculated, which has been shown to be correlated to attribute intensity15. At least 50 consumers are needed to obtain reliable information using this method16.
Holistic methods are comparative methods based on the evaluation of global similarities and differences among samples13. Projective mapping is one of the most widely used holistic methods. This method is usually conducted with untrained assessors or semi-trained assessors (who are briefly familiarized with the method and the main sensory characteristics of the products). In projective mapping, assessors are presented with a series of samples (at least 5) and are asked to position them on a bidimensional space (usually an A3 sheet of paper) according to their similarities and differences17. Samples that are located close to each other in this bi-dimensional map should be similar to each other, whereas samples that are perceived differently should be located far from each other. Each assessor selects the sensory characteristics that are most relevant for determining the degree of similarity and difference among samples. Apart from positioning the samples on the map, assessors are asked to provide a brief description of the sensory characteristics of each sample or group of samples13. The coordinates of each sample in the map of each assessor are determined and Multiple Factor Analysis (MFA) or Generalized Procrustes Analysis (GPA) are used to obtain a consensus map that represents the similarities and differences among samples.
Hedonic tests
Hedonic tests basically require frequent consumers of the target product category to indicate their personal impression of how much they like or dislike a sample or to select the sample they like the most7. The most common approach is to ask consumers to rate the magnitude of liking and/or disliking using a hedonic scale18.
The 9-point hedonic scale is the most popular approach to measure liking7. It is a labeled category scale, composed of 9 phrases, which cover a continuum from negative (dislike) to positive (like) hedonic reaction. The scale is basically a balanced bipolar scale, with four phrases denoting liking and four phrases denoting disliking, arranged around the neutral phrase ‘neither like nor dislike’ Several alternative presentations of the 9-point scale exist (e.g. with or without integer numbers in each category, checkboxes with text anchors only in the extremes and the neutral point).
Hedonic tests require a large number of participants in order to obtain reliable information, given the large heterogeneity in consumers’ reaction to products. According to Hough and others19, a minimum of 100 consumers of the target category are necessary. In a hedonic test, consumers are usually presented with a set of samples, presented one at a time, and are asked to select the category that best describes their degree of liking7. It is common practice to assign the number 1 to 9 to the categories (1 = ‘dislike extremely’ and 9 = ’like extremely’), and to treat the responses as points in a continuum18. Mean ratings are usually calculated, t-test or analysis of variance (ANOVA) are used to evaluate differences among products.
Applications of sensory evaluation into breeding programs
Analytic and hedonic tests have been applied in breeding programs in different contexts and with diverse objectives.
In this review we will focus on three different examples of products where sensory evaluation has been applied in order to facilitate decision making breeding programs aimed at improving the sensory characteristics of the products: strawberry, sweet potato and rice.
Sensory evaluation of fruits and roots
There is a global shared aim of increasing consumption of health-promoting foods such as fruit and vegetables in order to prevent the development of chronic diseases worldwide. According to FAO, average per capita daily consumption of fruit of vegetables (400 g per day) is below nutritional recommendations and comprises one of the top 10 risk factors for mortality in the world. In the specific case of Uruguay, the average fruit and vegetables consumption merely reaches 246 g/person/day. Several strategies have been implemented worldwide to promote consumption of fruit and vegetables, which have mainly relied on providing information about their positive health effects20. However, this approach has proven not to be successful21)(22. Therefore, it is necessary to implement new approaches to encourage people to consume more fruit and vegetables.
Pleasure is one of the main determinants of food choice and food consumption4)(23. Therefore, an alternative approach to encourage behavior change consists of positively associating fruit and vegetables with pleasure, which has been a successful approach for the promotion of unhealthy foods20. For this reason, it is crucial to improve the sensory characteristics of fruit and vegetables to increase the degree of pleasure experienced during food tasting. As Civille and Oftedal3 state: ‘no matter how healthy and nutritious a food is, if it does not appeal to its intended end user, it is unlikely to succeed in today’s marketplace’.
Strawberry
Strawberry is usually a well-accepted berry among consumers, being also rich in dietary fiber, micronutrients, and potential bioactive compounds such as phenols and anthocyanins whose consumption have been associated with a lower risk of chronic diseases24)(25. However, this health-claims promoting benefits are not strong enough to increase strawberry consumption. There is a need for attractive and appealing strawberries that could lead into a rise in global marketing and consumption.
Strawberry quality shows a significant inter- and intra-cultivar variation, revealing the great impact of the genotype, environmental and cultivation practices on quality and sensory characteristics26)(27)(28)(29)(30. Moreover, fruit to fruit variation has also been reported, which impacts physicochemical quality (color, soluble solids, acidity, firmness, volatile emission) and fruit flavor31. Therefore, the development of new appealing cultivars capable of reducing quality fluctuations associated with environmental factors or management strategies could be highly beneficial32.
In this crop there is a huge influence of environmental conditions in fruit quality and flavor due to its short maturation period and diversity in agronomical management what could negatively or positively influence strawberry cultivar liking results27 or assessor’s description of new cultivars33.
A strong interaction between cultivar sensory characteristics and harvest date is usually observed in this crop27)(30)(33)(34 while a significant genotype-by-harvest time interaction has been reported for soluble solids content35, total acidity and sugar content36 and sensory characteristics37. However, the interaction between genotype and environment does not affect all quality parameters to the same extent. According to Shaw38 soluble solids content of strawberries is more dependent on environmental conditions than genetic differences among cultivars, whereas total acidity is more dependent on the genetic characteristics of the cultivars. In this sense, research on the variability of sensory and physicochemical characteristics of strawberry cultivars can be useful to select cultivars that yield strawberries with stable sensory quality even under large changes in environmental conditions or unfavorable weather conditions33.
Sensory characterization of strawberry cultivars
Different countries have focused on improving strawberry flavor through conventional breeding, such as Australia31)(39)(40)(41, Brasil42, Croatia32, Germany43)(44, Greece26, United States of America30)(45 and Uruguay27)(28)(33.
Trained assessors have been frequently used in different works to provide descriptive profiles of strawberry under different scenarios26)(31)(32)(42)(45)(46 or to detect flavor changes associated with postharvest conditions47)(48. However, the implementation of sensory tests in the context of breeding programs is always a challenge. Classic analytic tests with trained assessors require time and economic resources, which are not always available. In this sense, the use of consumer-based sensory characterization can provide useful information to inform decision making. In particular, the use of CATA questions with consumers can be used to understand consumers’ sensory perception and to identify the characteristics that drive consumers’ preference27)(28)(49.
CATA questions have been used to detect differences in consumers’ perception of the sensory characteristics of different strawberry cultivars27)(39. Figure 1 shows an example of the information obtained from CATA questions in a study conducted with 110 consumers. They were presented with five cultivars. They were asked to try the samples and to select all the terms (from a list of 11 terms) that they regarded as applicable to describe them. After finishing the task, they were asked to do describe their ‘ideal strawberry’ using the same CATA question. A correspondence analysis was conducted on the frequency table containing the number of consumers that selected each term to describe each sample. Results showed that INIA Guenoa was described using the terms very sweet and regular shape, while INIA Yurí was described using the terms intense red color and was very firm. This last cultivar was located closer to the ideal strawberry than the rest of the samples (Figure 1).
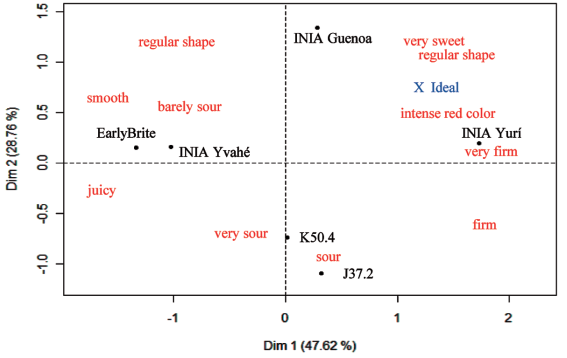
Figure 1: Representation of the six strawberry genotypes (EarliBrite, INIA Yvahé, INIA Guenoa, INIA Yurí and two clones, K50.4 and J37.2) on the first two dimensions of the correspondence analysis conducted on the frequency table of consumer responses to a check-all-that-apply (question). The ideal strawberry for the group of consumers is represented with an ‘X’.
The sensory data provided by consumers using CATA questions have shown a significant correlation with instrumental analyses (firmness, color, soluble solids and acidity), highlighting their validity27. A recent work showed that CATA is a time and cost-efficient alternative to the DA methodology39.
Holistic methods could also be used to obtain a rapid description of the sensory characterization of strawberry cultivars. Projective mapping (PM) was applied to find the main sensory characteristics of five strawberry cultivars and advanced selections at three different harvest dates, detecting similarities and differences among them. This method constitutes a quick alternative for the evaluation of new cultivars and comparison with standard commercial cultivars with minimal investment of time and resources33.
Drivers of liking in strawberry- valuable cues for breeders
Consumers’ hedonic perception is the main determinant of their willingness to consume the product. Therefore, detection of promissory materials in terms of consumers’ liking and in-season stability of this trait is highly desired in order to improve descendent behavior in these aspects. In this sense, the identification of the sensory characteristics that drive consumers’ liking is a valuable cue for breeders to inform decision making. Different methodologies applied at diverse scale-trials have been used to reveal important drivers of liking in this crop, which could vary among different countries and cultures27)(39)(40)(43)(44)(50.
Liking has been reported to be mainly influenced by sweetness and strawberry flavor intensity, which are undermined by environmental pressures that reduce sucrose and total volatile content30. Sweetness, flavor intensity and texture are dependent on sugar concentration (mostly sucrose), specific volatile compounds and fruit firmness, respectively30. In this sense, sensory attributes ‘aromatic’ and ‘sweet’ have been closely correlated to consumers’ liking in a principal component analysis44. This stresses that sensory studies are crucial for evaluating sensory quality since there is not a clear/direct correlation between the soluble solids content and sweetness or liking. In contrast, sourness is significantly correlated to citric acid content data44. Similar results have been reported based on results from projective mapping of strawberries from the national breeding program33.
A positive correlation (0.54) was found between soluble solids/titratable acidity and sweetness, evaluated by trained assessors26 whereas consumer trials (n = 166) revealed key individual volatile compounds that have an enhancing effect on perceived sweetness intensity of fruit, independent of sugar content30. Particular esters, terpenes, and furans have the most significant fits to strawberry flavor intensity30. Volatile terpenoids and lactones have been positively associated with consumer liking44, highlighting the importance of an abundant, diverse and intense volatile pattern for high sensorial quality26. Different works have demonstrated that a successful selection of strawberry cultivars needs to rely on the application of both an appropriate instrumental analysis and sensory evaluation44.
Similar approaches have been applied in different strawberry production zones worldwide. In North Carolina (USA), a collaborative program gathered plant breeders, culinary professionals and university on a strawberry varietal study which objectives were to enhance strawberry quality with a focus on flavor, texture, color, size and to improve economic value and marketability of local strawberries. Since strawberry is typically consumed as a whole fresh fruit, consumer’s opinions when eating plain strawberries highlighted that color, sweetness, juiciness and firmness or texture were the most relevant characteristics. In this sense, consumer feedback and perception shows that the preferred samples are usually associated with freshness and raw strawberry flavor, moderate sweet and sour, high juiciness and moist mass3.
Considering the main sensory characteristics that consumers appreciate when eating strawberries27)(39)(46, PM with untrained assessors has been used to identify the cultivars and advanced selections with the highest sensory quality in each harvest (early, mid or late season from June to October). In the June (early season) harvest INIA Guapa (SGL20.1), Festival and INIA Ágata (SGN48.3) showed similar sensory characteristics and were described using terms juicy, tasty and intense red color, that have been identified as the main drivers of liking of strawberries. Meanwhile, in the August (mid-season) harvest, INIA Yurí, INIA Guapa and INIA Guenoa were the cultivars associated with positive sensory characteristics such as sweetness and tastiness; whereas in the September (late season) harvest INIA Guenoa was perceived as having clearly different sensory characteristics than the rest of the cultivars and was described as tasty33. These trials throughout many consecutive years allowed to visualize the need for using PM by modality, i.e. to conduct separate PM trials based flavor and texture in order to obtain further insights on the main sensory characteristics responsible for similarities and differences (unpublished data).
Sweet potato
Sweet potato (SP) represents a production area of about 8 million ha, being the fourteenth most important food crop worldwide from the production point of view (103 million tons and an average yield of about 12.6 tons/ha)(FAOSTAT 2013). SP is a versatile crop which roots can be boiled, steamed, baked, or fried, with diverse applications, such as processed foods, alcohol or starch production, animal feed, and table use. In developed countries, SP has actually been reevaluated as a health-promoting food, due to its content of nutrients and functional components such as anthocyanins, carotenoids, and phenolic compounds, which have antioxidant and other functional activities51.
There are numerous SP genotypes worldwide with different sensory characteristics and contrasting contents of vitamins, pigments and dietary fiber. Moreover, genotypes also differ in their dry matter (DM) content, which directly influences texture after cooking; high DM genotypes are firm and mealy, whereas low DM genotypes show a soggy texture after cooking52)(53. Sweet potato cultivars are grouped in four types according to root flesh color, dry matter, total sugar and taste:1) white, yellow or cream sweet potato (WFSP), dry, low-sweet or staple type; 2) orange, moist, sweet or dessert-type; 3) orange fleshed sweet potato (OFSP) dry and starchy feeling rather bland in the mouth and 4) purple-fleshed type, usually dry and low in sweetness54.
From a breeding perspective, there is a multitude of potential objectives, being those related to yield, quality and pest resistance key targets of most National Agriculture Programes to focus on yield improvement. However, the sensory characteristics of new cultivars are generally ignored in traditional breeding programs55)(56. Critical quality attributes such as flavor, texture, starch chemistry, pest resistance, color, and nutritional properties, must be identified in modern breeding strategies, and an appropriate selection protocol developed in order to incorporate targeted and valued traits into new cultivars. This selection method is desired to be objective, accurate and amendable to the assessment of a large progeny57. Appearance, flavor, texture as well as nutritive value are key criteria for assessing the quality of processed/cooked SP roots58.
Flavor is a key component in sweet potato quality as it is strongly associated with consumer liking57)(59. Flavor preferences in sweet potato vary together with ethnic background and geographical location60. Perceived taste is influenced by sugar content which depends on the sugar content of the raw roots (sucrose, fructose and glucose) and on their changes after cooking (maltose)61. Due to the relevance of sweetness in the overall flavor of cooked sweet potato samples, the potential exists for tailoring flavor for specific consumer preferences and product uses, what could potentiate the utilization of this crop worldwide60.
Sensory profiles of OFSP or WFSP show that texture and sweetness vary considerably and that both variables play a key role in the liking of sweet potato62. In this sense, genotypes with different flesh color have been characterized by trained assessors using descriptive analysis. Orange materials were described with the descriptors fibrousness, moistness and residual fiber texture with earthy/canned carrot, dried apricot/floral flavor and aroma, visually moist, homogeneous in color and sour in taste. White/yellow fleshed materials were chalky, dense and firm/fibrous with white baked potato and vanilla aroma. Taste was described using the terms sweet, brown sugar and dried apricot flavor and smooth texture63.
Several studies have addressed the contribution of volatile compounds formed during cooking on the final perceived aroma and taste63. Breeding for the improvement of sensory aspects must consider that people from different regions vary taste preferences, being the extremes low DM, moist mouth feel, very sweet and deep orange color versus high DM, bland, dry mouth feel, low sweet taste and white, yellow or orange flesh colors64. Changing the flavor of crops via breeding is the primary mean of significant improvement of the diet, however, the selection of parent clones and superior progeny is the weakest link in the process. Flavor has been usually relegated as one of the last traits assessed due to the difficulty of evaluating a large number of materials63. Several authors have suggested the possibility of using aroma and taste chemistry (standardized and automated for large sample numbers) to determine the general flavor. Instrumental assessment of flavor (independent of sensory panels) has been proposed as a selection method mostly based on the accurately finger-print of individual clones and a large progeny, maximizing breeding program potential to select for the desired flavor. Using instrumental selection technique is possible to select multiple target populations showing different flavor preferences57)(65.
Several SP breeding programs decided to incorporate sensory evaluation into the selection of advanced materials or newly released varieties. Different examples illustrate the complexity and diversity of this task.
In Africa, traditional sweet potato varieties produced and sold show a pale-colored flesh while new varieties have introduced the orange color (OFSP) together with the nutritional added value of β-carotene (provitamin A). These materials could contribute to alleviate vitamin deficiency in Sub-Saharan Africa66)(67 and could be easily identified by consumers due to their orange pulp coloration, favoring marketing and promotion68. However, such drastic changes in appearance, texture and taste could constitute a primary barrier for consumer acceptance of fresh OFSP. In Africa consumers prefer high dry matter varieties which usually contrast with low DM contents found in OFSP. The International Potato Center (CIP) focused on developing materials with both high carotenoid and DM contents67.
OFSP varieties are often associated with sensory characteristics of high moist (watery texture) and pumpkin flavor, whereas WFSP are usually creamy, starchy, fibrous, hard and coarse and sweet in taste62)(69)(70. A profuse study of the main sensory characteristics of 11 sweet potato cultivars showed that carotenoid content (varying between 0.4 and 72.5 mg/g FW) was correlated to DM content (26.8-39.4 %) and to visual, odour, taste and textural characteristics, implying that carotenoids have a complex effect on root metabolism67.
Another recent example shows that there is a need for development of new SP varieties with versatile uses. Consumer and industry demand for SP french fries has increased but cultivars traditionally developed for the root market have an undesirable soggy texture after processing, a fact that triggered sensory and breeding teamwork53. Sixteen orange and yellow fleshed genotypes were evaluated (chemical, instrumental properties and sensory attributes) and demonstrated a great variety among genotypes. Sensory texture attributes (evaluated by a trained panel of 14 people using DA) were strongly correlated to chemical components of raw SP and instrumental texture measurements of processed french fries53. Therefore, detecting key components in raw roots that influence valuable traits for consumer would potentiate SP breeding with this industrial objective.
In the case of Uruguay, SP is one of five most cultivated vegetable crops, considering the total amount produced, productive area and number of growers71.The SP breeding program dates from 1990. The first WFSP variety released in 1998 (INIA Arapey)72, which was then replaced by INIA Cuarí due to its higher productivity, peel texture and color, and better general appearance. INIA Cuarí has a more humid texture (less DM content 18-20 % compared to 25-30 % in INIA Arapey) a characteristic associated with a faster cooking at home. The incorporation of sensory analysis into breeding process provided information that contributed to the recent release of INIA Cambará, (R0871.5), a yellow flesh cultivar characterized by its typical SP flavor and creaminess73. PM was the main sensory methodology used in the breeding program. It was concluded that PM is a quick, cost-effective and reliable tool for the selection of new advanced SP materials with superior sensory characteristics compared to reference varieties such as INIA Arapey and INIA Cuarí73. The application of this method showed the potential of sensory methodologies as a feedback tool for breeding programs. Selected clones were associated with the terms smooth, creamy, equilibrated moist, pale yellow, tasty, sweet and good texture, being all linked to positive hedonic terms (yummy, very good). Moreover, moisture, sweetness, creaminess and smoothness are relevant characteristics for SP consumers. This type of approach could allow future differentiation of cultivars in the marketplace based on their sensory characteristics, providing extra value to this local crop73.
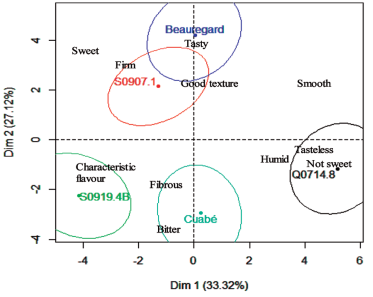
The internal market demand relies mostly on cultivars of purple skin and yellow flesh (60-70 %). However, demand for new cultivars with orange flesh increased in the last years. The INIA sweet potato breeding program has focused on the development of new cultivars of high sensory quality, without ruling out agronomic behavior and commercial needs71)(73)(74. As an example, the application of PM on OFSP grouped samples by their similarities and differences, being able to show relevant differences among new clones and reference varieties such as Beauregard or INIA Cuabé (Figure 2). Beauregard and S0907.1 were located in a similar position of the map and were described as tasty, sweet, with good texture and firm. The rest of the samples showed distinctive sensory characteristics. Cuabé was described as bitter and fibrous and S1909.4B presented a characteristic flavor. Assessors described Q0714.8 as humid, tasteless and not sweet (Figure 2).
The sensory analysis in rice
Rice is one of the main agricultural crops and the third export item in the country. In 2014, rice represented 6 % of the total exports in Uruguay, accounting for US $ 507 million (Uruguay XXI, 2014). In 2016, Uruguay ranked ninth in the world ranking of exporters of this crop being also the main exporter of Latin America.
According to FAO, in 2017 Uruguay exported 95 % of its 1214,000-ton of paddy rice production. Thus, the chain has focused on rice quality in order to ensure access to premium markets. This has been possible due to the strong integration and overall vision of the members of the entire rice chain, including producers, millers and research institutes. The accomplishments already achieved by the sector in terms of product quality, markets access recognition, and differential prices, have been based on these concepts.
The aforementioned focus on quality together with changes in consumer behavior, demand the development of new cultivars, which need to comply with the requirements of premium and demanding markets75)(76. In this context, the rice sector needs to increase the rate of incorporation of new varieties into the productive system. These new cultivars need to combine three important aspects; high agronomic performance to improve the economic equation of the growers; high industrial yields; and certainties about acceptability by the buyer’s markets. Therefore, investing in multidisciplinary research, to improve the quality of agricultural commodities and to increase agronomic and industrial yields, becomes of great importance.
Regarding quality, different methodologies have been assayed, but are still insufficient to completely understand the needs and demands of consumers77)(78. Taste and preference for rice vary tremendously across the world79. The authors showed how sensory evaluation has been used in the last years to understand the intrinsic (linked to the product) and extrinsic (linked to the consumer) factors underlying the wide range of preferences around the rice varieties. From a sensory point of view, rice is a complex product in which a number of components are involved including appearance, odor, flavor and texture.
Different approaches have been conducted to understand the specific sensory attributes of cooked rice that are appealing to consumers. For example, hedonic pricing analysis and regression analysis with raw grain characteristics are one of the most used approaches since 80‘ decades to establish the consumers preferred quality attributes80)(81)(82)(83)(84)(85. Furthermore, consumer tests are also widely used86)(87)(88)(89. As an example, Meullenet and other90 applied external preference mapping to consumer test data to explore the drivers of acceptance of jasmine rice by Asian consumers living in the United States. In this work, twenty-one rice samples covering examples of aromatic, long and medium grain, instant, and parboiled products were evaluated by a group of 120 Asian consumers, currently living in the United States. Imported Thai Jasmine rice was preferred by this group of Asian consumers over every other rice tested including domestically grown Jasmine rice. Authors also mentioned that the most important acceptance factors for Asian consumers were cooked rice appearance and aroma.
Nevertheless, the eating quality of cooked rice depends on several factors such as physicochemical properties, drying and storage conditions, processing factors and cooking methods91)(92)(93)(94)(95. In that way, sensory descriptive analysis is an important and widely used tool to quantify the sensory attributes of various food products including rice. The optimum water uptake in cooking is an important parameter affecting cooked rice quality96)(97. Sensory characteristics of cooked milled rice were not affected when rice surface lipid content (SLC), used as an indicator of milling degree, ranged from 0.15 to 0.55 %, obtained when cooking using an excess of water98. Similarly, surface lipid content, ranging from 0.40 to 0.95 %did not affect sensory characteristics of cooked parboiled rice. Additionally, the effect of cooking water-to-rice ratio on sensory characteristics of non-parboiled and parboiled rice was evaluated, showing that rice hardness decreased as water-to-rice ratio increased for both, non-parboiled and parboiled rice99. Descriptive analysis was also applied to evaluate the effect of the degree of milling on the sensory attributes of cooked and raw rice100. The authors reported that for rice cooked with a 1:2 rice-to-water mass ratio, samples with SLC= 0.25 % (highly milled) were glossier than samples with SLC= 0.64 %. As for the raw rice, the study concluded that the most noticeable differences in aroma and appearance were detected between brown and milled rice samples, while differences between samples with different degree of milling (SLC= 0.64-0.25 %) would probably not be detected by untrained consumers. The authors highlighted that this result could be used to decrease the degree of milling, with the corresponding nutritional and yields benefits, without impairing the sensory quality of the product.
Hence, the focus should be put in developing meaningful relationships to quantify the effects of cooking methods and the physicochemical properties of raw rice on the eating quality attributes of cooked rice. In this way, descriptive sensory analysis was applied to investigate the effects of cooking water-to-rice ratio on the sensory characteristics of cooked rice eating quality of 14 varieties of Thai rice in relation to their physicochemical properties101. The authors identified the intensity of sensory hardness as the main characteristic of cooked rice, which decreased with increasing water-to-rice ratio whereas sensory stickiness decreased. Authors found that the overall acceptability based on appearance, texture and flavor attributes reached peak levels corresponding to optimum water-to-rice ratios for different rice varieties and was highly correlated with sensory hardness and stickiness.
Moreover, sensory descriptive analysis can also be correlated to consumer tests in order to fully understand the sensory performance of rice. Kwak and others102 used descriptive sensory analysis to characterize cooked rice samples and established their relationship with the consumers’ acceptability. Prakash and others103 used a 12-member panel professionally trained in descriptive analysis of rice. Visual, texture and flavor attributes of cooked rice were analyzed by the trained panelists. The samples were also subjected to instrumental texture measurements. Then, by means of principal component analysis, rice samples were further classified based on the sensory and instrumental texture attributes. Bett-Garber and others91 used a descriptive sensory panel to study the influence of the amount of water during cooking on flavor and texture attributes. The effect of three water-to-rice ratios mentioned as low (less than recommended), recommended, and high (more than recommended), were evaluated. The recommended amount was based on amylose content and cook type for the cultivar. Authors compared four diverse cultivars: Dellmont (aromatic long-grain), Saber (conventional long-grain), Neches (waxy long-grain), and Bengal (conventional medium-grain). Results showed that the water-to-rice ratio did not significantly affect flavor attributes across all cultivars. The amount of water affected 11 of the 14 texture attributes evaluated. Of these 11, initial starchy coating, slickness, stickiness between grains, cohesiveness, and uniformity of bite increased in intensity with greater amounts of water at cooking, whereas hardness, stickiness to lips, springiness, and chewiness decreased in intensity.
Sensory analysis has been and will continue to be an important tool to know and understand how rice varieties and consumers behave. In that context, it becomes necessary for our small but well-positioned country, to join and increase efforts on strengthening knowledge on industrial performance and sensory characteristics of new cultivars, in order to guide growers, industrials and research programs, in the development and incorporation of these varieties into the production system.
At a national level, the rice genetic breeding program of Instituto Nacional de Investigación Agropecuaria (INIA) currently identifies a great number of new genotypes with outstanding agronomic characteristics each year.
Analyses related to the physical characteristics of the grains that affect the milling process, as well as the physicochemical characteristics, which are indirectly related to culinary quality, have been performed in the country for decades. However, and with the aim to attend sensory aspects and to reach a more exhaustive characterization, a methodology to evaluate sensory properties that feeds breeding programs was necessary.
In the context of the «Rice Industrialization Program» of Latitud and Laboratorio Tecnológico del Uruguay (LATU), and after an exhaustive review, it was agreed with INIA, Gremial de Molinos Arroceros (GMA) and Asociación de Cultivadores de Arroz (ACA) the need of training a sensory panel to evaluate the culinary quality of rice cultivars.
Thus, in 2014, a group of 14 panelists was trained in the facilities of LATU to evaluate rice. Since that moment, the panel, which has been maintained and updated, has been used for the characterization of both, commercial varieties and new cultivars in their final evaluation stages, developed by INIA and other developers. The sensory profile of 11 Uruguayan cultivars cooked in a 1:2 rice-to-water ratio was preliminary obtained104. The varieties were divided in three groups using PCA analysis. The first group was characterized by having lesser stickiness and gloss and higher grain integrity. A second group showed higher gloss and stickiness and lower hardness and grain integrity. Finally, a third group with intermediate sensory characteristics was identified. Moreover, in order to allow early understanding of the behavior of different varieties, correlations between sensory attributes and physicochemical and instrumental parameters are being studied.
The effect of cooking water-to-rice ratio on the sensory characteristics of Uruguayan commercial varieties was also investigated. Hedonic aspects of samples were evaluated in order to identify the ratio that expresses the best quality potential for each variety (unpublished data). Based on this characterization and with the aim to define the best cooking conditions for new cultivars, culinary quality analyzes are being carried out and compared with the commercial varieties using Principal Component Analysis.
Thus, the incorporation of the assessment of sensory characteristics to the characterization of rice cultivars will contribute to the selection of new cultivars and will provide valuable information to breeding programs with potential benefits to the entire rice chain.
Future Perspectives
In our opinion, the future in sensory improvement through plant breeding should rely on the integration of sensory and hedonic data with instrumental data which should both finally fusion with genetic information. The application of molecular markers associated with quality or sensory traits that are valued by target consumers or markets should be an outstanding tool for the selection of promissory genotypes form early steps of the breeding process.
A specific example is shown in strawberry, where key genes influencing quality and nutritional traits (vitamin C, sugar, acid accumulation) have been recently proposed as Quantitative-trait loci (QTLs) in strawberry105, providing information about the genetic control of these traits and a tool for molecular-marker assisted selection of new genotypes. The same group proposed an early detection of key genes related with volatiles (gamma decalactone and mesifurane) presence in strawberry, which could allow a rapid detection of sensory promissory materials106.
As another example, purple-flesh trait in sweet potato have been associated with the expression and function of IpMYB1 which functional allele was detected in all anthocyanin-containing materials; similar function of these family of transcription factors (TFs) was described in purple potatoes and other colored products51)(107)(108)(109. Similarly, in strawberry, FaMYB10 (positive) and FaMYB1 (negative) were described as regulators of anthocyanin accumulation during fruit ripening, and a specific role on fruit white core determination has been proposed for FaMYB1 (cited by Chaves-Silva109). Detection of the presence of functional or key alleles of these TFs would be a useful tool for the traditional breeding selection of these traits. MYBs are also involved in taste and flavor via regulation of aroma (scent), astringency and piquancy of different crops108)(109.
Other important issue is the development of new rapid methodologies that allow breeders to evaluate how the global breeding population is moving forward towards improvement of sensory or global quality traits. In this sense, the efforts in incorporating new methodologies that improve the characterization of culinary/sensory rice quality together with a better understanding of the consumer preferences, will allow directing the development of new varieties with greater certainty.

