


 Inglês (pdf)
 Artigo em XML
 Referências do artigo

 Permalink
Introduction
Cydia pomonella (L.) (Lepidoptera: Tortricidade) known as codling moth, is the main pest of apple, Malus domestica (Borkhausen), and pear, Pyrus communis L., but also attacks quince, Cydonia oblonga L., and walnut, Juglans regia L. The larva penetrates the fruit to directly feed on the seeds. In Uruguay, C. pomonella develops three generations by year, diapauses in the fifth instar larva occurring in the last generation (Núñez, 2006). Southern Uruguay has a heterogeneous agricultural orchard system which is composed of suitable host patches that vary in size, shape, species composition and management strategies. Apple and pear are the most important species present. Most control methods applied in these orchards are aimed at controlling apple scab and codling moth (Núñez & Scatoni, 2013). The systematic use of neurotoxic insecticides or their application based on forecasting systems which depend on the temporal variability of insect populations, fail to suppress the pest to acceptable damage levels (Núñez & Scatoni, 2013). Therefore, it is important to develop other management strategies.
Areawide pest management is the most effective approach to manage pests, reducing the use of insecticides and allowing alternative pest-control strategies that have a less negative impact on the environment and on farm growers. It involves synchronized and coordinated control measures over wide areas, instead of at farm levels (Faust et al., 2008). At the landscape scale, the fragmentation of farmland has resulted in a scattered resource distribution, so it is necessary to determine the final spatial pattern of a pest (Sciarreta & Trematerra, 2014). This is reflected in the spatial dynamics and dispersal of pest species from population sources toward population sinks. Understanding these patchy distributions can greatly influence the success of an area wide management programs (Caprio, Fave & Hankins, 2004). Therefore, to develop efficient area wide pest management strategies it is essential to know the insect population’s dynamic and spatial distribution, so control measures can be site-specific where populations are densest (Emmen, 2004). Analysis of the spatial distributions of insect populations is important for developing accurate and efficient sampling programs leading to more general pest monitoring programs (Southwood, 1978; Taylor, Woiwod & Perry, 1978; Taylor, 1984). Moreover, it helps to predict population density in unsampled locations (Liebhold, Rossi & Kemp, 1993), and thus to improve pest management strategies (Hughes & McKinlay, 1988), and to understand ecological relationships with different abiotic and biotic factors (Iwao, 1970; Hassel & May 1974). The development of two technologies has opened up new avenues for analyzing spatial patterns in insect populations: geostatistics and geographical information systems (GIS). These technologies constitute the basic tools of an approach to precision farming.
Geostatistics quantifies and models spatial and temporal correlations and enable the analysis of large data series in a very short time and thus carry out large-scale studies. This technique was first developed in the field of geology and has since been applied to agriculture (Emmen, 2004), and in a number of cases it has been employed to study the spatial distribution of insects (Midgarden, Youngman & Fleischer, 1993; Ribes-Dasi, Avilla & Bascuñana, 1998; Farias et al., 2004; Boiteau, 2005; Ramirez-Davila et al., 2005; Castillo et al., 2006; Moral García et al., 2004; Trematerra, Gentile & Sciarretta., 2004; Sciarretta & Trematerra, 2006, 2014; Basoalto et al., 2010; Calvo et al., 2011; Comas et al., 2012; Duarte, 2012; Duarte et al., 2015a, 2015b). Spatial analysis is based on the theory of regionalized variables put forward by Matheron (1970), whereby the value of a variable at a given point is related to the value of that variable at another point nearby (Rossi et al., 1992). On a small scale, biological variables usually have a chaotic structure, but on a larger scale, they have an identifiable spatial variability structure, and this can be modeled by the semivariogram using geostatistic techniques. The semivariogram is built up by graphically representing the semivariance of groups of pairs of data separated by similar distance intervals, in function of distance (Rossi et al., 1992). The semivariogram has three parameters. The nugget effect (Co) represents discontinuity at the origin, the sill (Co+C) is the maximum variability value, and the range is the limit of spatial correlation (Cuador, 2004). This information can be used to estimate the population by kriging geostatistical procedure. This estimation is based on the continuous variogram model. To predict a value in a not sampled point, it uses the existing knowledge of the data in its neighbourhood by taking account of the way that a property varies in space through the variogram model (Armstrong & Carignan, 1997; Journel & Huijbregts, 1978; Hohn, 1988; Isaaks & Srivastava, 1989; Rossi et al., 1992; Webster & Oliver, 2007). This makes possible to draw up population distribution maps that show the foci of greatest abundance, and this information can be used for defining pest-control strategies.
Forecasting systems based on the temporal variability of pests have proved to be useful, but they are limited when it comes to optimizing phytosanitary protection systems and even more for reducing the negative environmental impacts of pest-control measures in large areas (Faust et al., 2008). In Lerida, Spain, a forecast service to manage Cydia pomonella and Pandemis heparana on deciduous fruit has been developed using geostatistical analysis, allowing the determination of population levels at different areas (Avilla & Ribes-Dasi, 2004; Ribes-Dasi, Avilla & Bascuñana, 1998).
The aim of this research was to study the temporal and spatial variation in distribution and abundance of C. pomonella in the main deciduous fruit-growing area in southern Uruguay using geostatistical tools and relate it to local weather conditions.
Materials and Methods
Study area
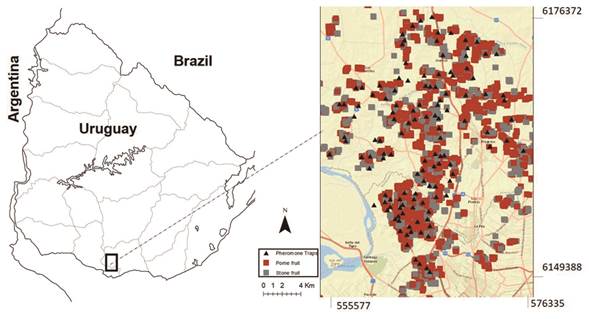
The spatial distribution studies were carried out from 2007 to 2009 in the main deciduous fruit-growing area in southern Uruguay, in approximately 50,000 ha, located between NW x = 555577 y = 6176372; SE x = 576335 y = 6149388 (UTM WGS 84 21H). About 90 % of the fruit production of the country is distributed within the study area. The fruit production area includes 3508 ha of apple, 2220 ha of peach and nectarine, 1003 ha of pear, 344 ha of plum, and 287 ha of quince. Most of the crops are grown on small farms, less than 10 ha, and all species are commonly grown together on the same farms (Figure 1) (DIEA, 2010).
Data collection
The activity of C. pomonella adult males was monitored weekly using wing traps baited with sex pheromone (Isca Tecnologias Ltda, 8.10 - (E,E) - dodecadien-1-ol, Codelmone- 1,4g/kg (0.14 %). Latex - 998.6g/kg (99.86 %)). Approximately 120 traps were installed in apple or pear orchards set between 500 to 1000 meters apart (Figure 1, Table 1). Traps were georeferenced and placed in the tree top at 1.8-2.0 m above ground. Pheromone dispensers were replaced every month and sticky bottom when necessary. Trapped adults were removed and counted weekly from October to March from 2007 to 2009.
Geostatistical analysis
Geostatistical analysis was performed according to Duarte et al. (2015b). The captures of male moths in traps were summed over each generation and over the entire growing season. All generations were delimited by the thermal constant (600 DD) using as lower threshold temperature 10 °C, and starting estimates of degree-days from October 1st until the end of March when capture of male moths ceased (overwintering generation, generation 1 and generation 2) (Núñez & Scatoni, 2013). The calculation of degree days and the analysis of weather conditions was based on records from the weather station in Instituto Nacional de Investigación Agropecuaria (INIA Experimental Station) located at Rincón del Colorado, Canelones (x = 560346 y = 6163235). Exploratory data analysis was performed, and the assumption of normality was verified using the Shapiro-Wilk test. The data were normalized using square root transformations except for the 2007-2008 accumulated growing season that logarithmic transformations were used. Presence of trends of the regionalized variable was also checked using regression linear models in all cases before adjusting empirical semivariograms to the data. We found no evidence of the presence of a trend.
Empirical semivariograms were constructed to provide a graphical representation of the semivariance of the captures as a function of distance, with a maximum of 15 lag intervals. The maximum distance for the structural analysis was 13,700 m, with small variations depending on the growing season, equivalent to half the distance between the two farthest points (Díaz-Viera, 2002). For each empirical semivariogram, two theoretical models were fitted using the mixed procedure of SAS software (SAS Inst. Inc., Cary, NC): the default model based on the lowest residual sum squares (RSS) and higher R squared (R2), and the spherical model, considered by some authors to be more adequate for biological studies (Moral García, 2004; Ramirez-Dávila et al., 2005). In all cases, only isotropic semivariograms were adjusted. In order to determine the presence/absence of spatial correlation of captures in each generation and in the entire growing season, the likelihood ratio test was conducted. It was applied to compare the fit of each semivariogram model to the null model (independent errors). This test expresses how many times more likely the data are under one model than the other, and it allows computing a p-value to decide whether to reject the null model in favor of the alternative model (spatially correlated errors). Afterward, based on the pre-selected spatial correlation models, interpolations were performed with ordinary kriging, and cross validation was applied to select models after kriging, using GS+ software. In this process, each sampled point was individually removed and its value estimated through kriging, obtaining for each trap the observed and the estimated value. To compare performance of statistical models, the Akaike Information Criterion (AIC) was used as described in Littell et al. (1996). The AIC is calculated based on log-likelihood values, taking into account the number of model parameters. Lower AIC values indicate better performance of the statistical model. For each model, the degree of spatial dependence was measured through the ratio between the nugget and sill parameters Co/(Co+C), and the range value was determined. The Co/(Co+C) ratio indicates the degree of uncertainty when the interpolation takes place (Table 2). The quotient indicates which proportion of the variability the model explains, and which proportion of the variability is independent of distance. If the Co/(Co+C) ratio value is less than 0.25, the level of spatial dependence is high, if it is between 0.26 and 0.75, the level is moderate, and if it is 0.76 or above, the level is considered low (Cambardella et al., 1994). Finally, the data were re-transformed and C. pomonella distribution maps were drawn based on the kriging estimations calculated using the GS+ software.
A six level scale with different shades of grey was used; the lighter the shade, the lower the population level. Scale shades were defined starting a threshold of one capture week; the intensity of gray was darkener when added up one capture week.
Results
Trap captures
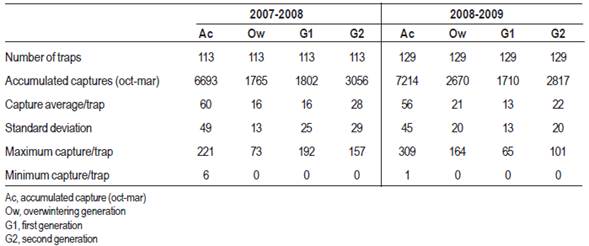
Table 1 shows the classic statistics for the two study seasons and the variations of populations in time. Capture averages per trap were similar in both growing seasons; the second generation had the highest captures, which is reflected in the high captures registered in the next overwintering generation.
Population fluctuation
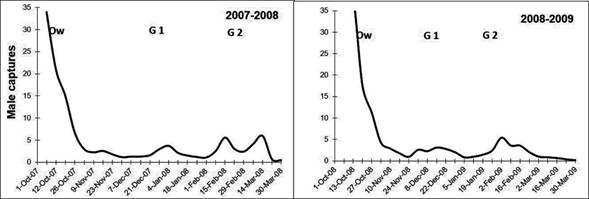
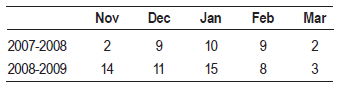
The fluctuation of the average populations of C. pomonella from mid-October to the end of March for each year is shown in Figure 2, where peaks of flights of adults are indicated (Overwintering generation, G1 and G2). Captures of C. pomonella during the two seasons followed a common pattern; however, for each generation the number of the insect caught and the timing of each generation were different. Most captures occurred in early October for the overwintering generation, while captures of the next generations were more extended in time (Table 1 and Figure 2).
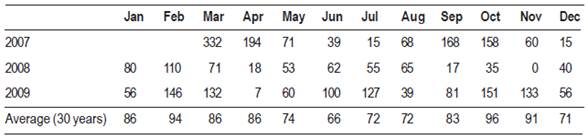
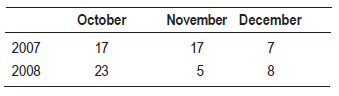
The 2007-2008 overwintering generation presented the lower accumulated captures. The autumn and early spring of 2007 were characterized by abundant rainfall (Table 2). The temperatures of the months of October and November were not favorable either. The minimum average temperature was 11 °C, while the next generations developed in more favorable conditions (Figure 3) (Núñez, 2006).
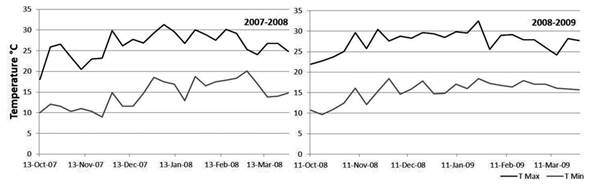
Figure 3: Weekly average of maximum and minimum temperatures according to records of INIA Las Brujas
Captures during the 2008-2009 overwintering generation were higher than the previous growing season, which reflects in the establishment of the generation 1 (Table 2). Temperatures from October to November (spring) were very favorable for the insect growth (Figure 3), the average minimum temperature of the period was 13 °C, three degrees above the development threshold of the species which allowed a greater thermal accumulation (DD). Therefore, the first and second generation flights occurred almost 10 days before than the previous season (Table 1 and Figure 2). Maximum temperatures above 25 °C are an indicator that the twilight temperatures are above the minimum requirements for copulation and oviposition (Table 3), during the last week of November the temperatures were exceptionally high, over 30 ºC (Table 4). These conditions remained during December and January (summer), and precipitation was scarce. From the beginning of November until the end of January the average catch in pheromone traps did not reach three adults/week/trap. After February, more favorable temperatures were registered that allowed the reestablishment of populations. The population density of the overwintering generation is the reflection of what happened at the end of the previous season (Figure 2).
Spatial distribution
The spatial analysis performed with the accumulated capture data resulted in semivariograms for each generation and complete growing season (Figure 4). A significant spatial autocorrelation was observed with the spherical model showing the best fit in all cases, with ranges between 1.7 and 2.7 km. Among the models calculated for each season and each generation, we selected those with better adjustment according to the AIC criterion, and better R2. For the 2007-2008 growing season, significant models were obtained for the accumulated generations and for generation 1 (R2 = 0.876 and 0.778 respectively). For the 2008-2009 growing season all generations presented significant models with R2 higher than 0.56 except the G2 that, although the spherical model was significant, the R2 was 0, therefore it was not considered in the analysis. These models presented levels of high or moderate spatial dependence (Table 5).
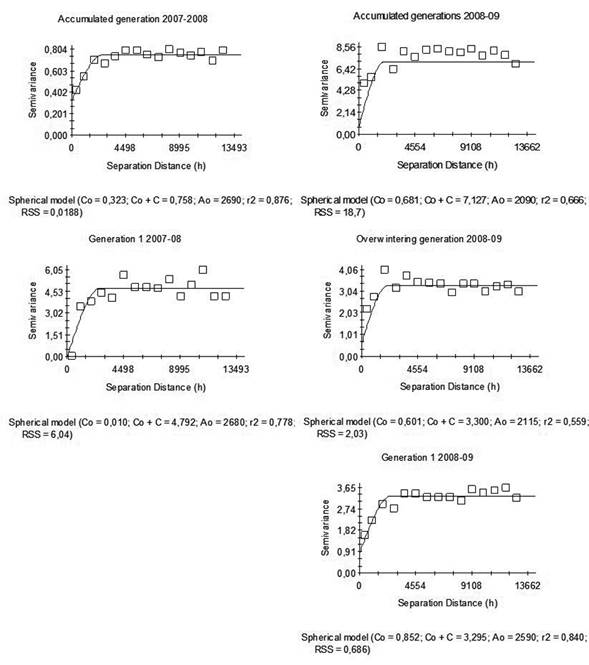
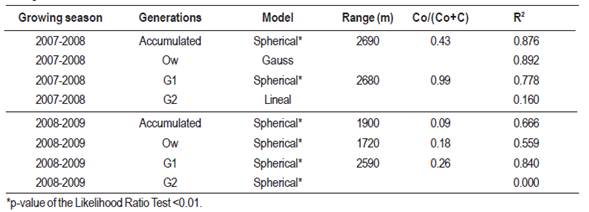
Table 5: Cydia pomonella models, range, spatial dependence level (Co/(Co+C) and determination coefficient (R2) obtained for each generation and season.
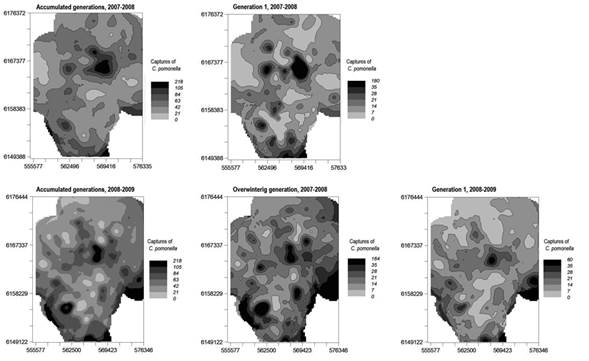
The spatial distribution maps for the accumulated captures of codling moth between October and March of each season were obtained from the estimated models and were constructed following the grey scale color convention described previously (Figure 5). We can observe in the 2007-2008 season the large darkest grey areas. These large foci were mainly associated with the captures of the second generation, leaving a significant population remnant for the following spring.
The 2008-2009 season began with favorable conditions for the development of C. pomonella, and the overwintering generation made the greatest contribution to the accumulated capture (Figure 2). The dark grey foci observed in the maps correspond to the large abundance of that generation (Figure 5). The extreme drought that occurred from 2008 until February of 2009 plus the high temperatures registered could explain that the following generations of codling moth were smaller.
Discussion
Multiple factors may influence the spatial distribution and the population fluctuation of codling moth populations. The fluctuation observed during the two observation periods showed important differences, which were associated with the climatic conditions of each year. For example, the low densities of the 2007-2008 overwintering generation could be explained because, as was mentioned by González (2003), rain affects both adult flights and neonatal larval mortality. In contrast, autumn, winter, and spring of 2008 were characterized by a marked deficit in rainfall, which favored the emergence of adults of the overwintering generation and the establishment of first generation larvae in fruits (Núñez, 2006). Probably the conditions observed during the last week of November through December (temperatures over 30 ºC and scarce precipitation) became limiting for flights of the first generation 2008-2009, which would explain the low abundance. Twilight temperatures above 28 °C also affect the flights of this insect (Núñez, 2006). As discussed before, although climatic conditions seem to be one of the factors that explain some of the variations in the abundance of this species, the population density of the overwintering generation is the reflection of what happened at the end of the previous season. When the population of the second generation is high (G2 2007-2008), during the next spring captures of the overwintering generation increases greatly (Ow 2008-2009), the opposite happens in the following season, the low populations of the second generation (G2 2008 -2009) determine low captures of the overwintering generation in the following spring (Ow 2009-2010, data not presented) (Calvo et al., 2011). The foci located in the same areas throughout the period may be due to particular factors of the pest and the heterogeneous agro-ecosystem. C. pomonella is a low dispersal species (50 m). When the fruit is available in the orchard, this pest overwinters in the same site that was attacked in the previous season (Núñez, 2006). If the populations are high, this condition will persist at the orchard until the next season, except that important natural mortality factors (such as climatic conditions) operate on diapausing larvae (González, 2003). External factors that control pest abundance are: sanitary management intensity carried out to control this pest, hosts (cultivated species and varieties), handling of damaged fruits, proximity to fruit packing areas, abandoned orchards, public lighting on roads and paths, etc. (Ribes-Dasi, Avilla & Bascuñana, 1998). In this sense, the 2007-2008 season was characterized by abundant rains at the time of the sprouting of the pomes fruit, affecting the flights of the overwintering generation of C. pomonella and giving ideal conditions for the development of apple and pear scab. Due to the severity of this disease on fruits, growers ceased the pesticide sprays for diseases and insects. This explains in most cases the large darkest grey foci that are observed in the map of 2007-2008 season.
All factors mentioned above influence the creation of foci that could act as a source of insects or work as corridors to disperse them to other areas (Trematerra, Gentile & Sciarretta, 2004; Basoalto et al., 2010). These authors found that C. pomonella distribution appears to be structured as metapopulations in heterogeneous agro-ecosystems. On the other hand, the high populations recorded in pheromone traps were related to high percentages of damages at harvest, and the conventional control methods adopted by individual farmers in small areas were not sufficient to mitigate these damages. Therefore, codling moth spatial distribution and management should be analyzed at larger scales, not at the individual farm level, as proposed in area-wide integrated pest management (Vreysen, Robinson & Hendrichs, 2007; Knight, 2008).
Geostatistic analysis has proved to be a useful tool for area-wide pest management for different insect populations, including Ceratitis capitata (Sciarreta & Trematerra, 2010), Grapholita molesta (Sciarreta & Trematerra, 2006; Duarte, 2012; Duarte et al., 2015a) and Xylella fastidiosa (Castillo et al., 2006). The spatial analysis of the distribution of C. pomonella done in the present study showed that its population is aggregated and also that significant spatial autocorrelation was found in here. These patterns were also observed in previous studies done in other areas such as Central Chile (Basoalto et al., 2010), Italy (Sciarreta & Trematerra, 2014) and Spain (Ribes-Dasi, Avilla & Bascuñana, 1998; Comas et al., 2012). We adjusted isotropic models for all the cases, as it was reported by Comas et al. (2012) that C. pomonella spatial patterns were in general isotropic. The best significant model adjusted in all cases was the spherical model, as it was also observed in previous studies (Ribes-Dasi, Avilla & Bascuñana, 1998; Basoalto et al., 2010). The range of spatial dependence estimated in this research varies from 1720 m to 2690 m. As it was suggested by Duarte et al. (2015a) the model with the lowest range (1720 m) should be considered to define the optimal distance for designing a pheromone trap sampling system, under our conditions. Ribes-Dasi, Avilla y Bascuñana (1998) obtained similar ranges (1500 m) in Spain, but Basoalto et al. (2010) and Trematerra, Gentile & Scierreta (2004) found ranges from 150 m to 300 m. These last authors explained that male codling moth may not disperse as far as other studies indicated, perhaps due to landscape features influencing the tendency to disperse.
One of the outcomes of geostatistical analysis is the creation of risk assessment maps (Sciarreta & Trematerra, 2014). As it was mentioned before, these maps allowed detection of all foci with a high population of C. pomonella in order to make a rational use of insecticide and predict where high populations will develop next season based on population levels at the end of the previous one. Maps also provide a useful outcome to be included in the forecasting systems provided to farmers. The information given would help farmers to decide where and when to apply any control measure. In this sense, the data obtained in this research offer important tools to modify the alert systems in Uruguay. This information supports the idea that geoestatistical analysis is a very promising tool in area-wide integrated pest management and is an important contribution for defining the control strategies to be used in area-wide pest management in deciduous fruits of southern Uruguay (Zoppolo et al., 2016).

