


 Inglés (pdf)
 Articulo en XML
 Referencias del artículo

 Permalink
Introduction
Sweet corn (Zea mays convar. saccharata var. rugosa) is a vegetable with a global economic importance. In relation to the world production of sweet corn, around 9.8 million tons were produced in 2013, with an average yield of 8.85 t ha-1 (FAO, 2016).
In Brazil, its production is mainly directed to industrial processing (Okumura et al., 2013). To comply with industry standards (Albuquerque et al., 2008), a good fertilization that meets the demand of the crop is necessary (Borin, Lana & Pereira, 2010), considering the soil fertility and the contribution of the soil to the availability of nutrients in order to obtain high yields and high product quality, ensuring greater profitability and less damage to the environment.
Studies about nutrient absorption rates and dry matter accumulation are of great importance to support the definition of the quantities and periods proper to fertilization. Based on the extracted quantities, the amount of nutrients exported at harvest may be estimated in order to be returned to the soil for fertility maintenance (Okumura et al., 2013). Among the studies that evaluated the accumulation of nutrients by the common and the sweet corn, it is observed that the results differ between accumulated and exported nutrients, either of the common corn cultivars (Pinho et al., 2009; Fallas & Echandi, 2011) or the sweet corn cultivar group (Maggio, 2006; Borin, Lana & Pereira, 2010; Hart et al., 2010; Heckman, 2007; Hirzel & Undurraga, 2013).
Accumulation curves reflect what the plant has absorbed under the conditions in which it has grown; that is, the potential of nutrient absorption and its rates are characteristic of the genotype, although highly influenced by the environment (soil, weather, cultural practices).
The objectives of this study were to quantify growth and macro and micronutrient accumulation by supersweet corn hybrid GSS 41243, in tropical conditions of weather and Acrustox Latosol of Guaíra region.
Material and Methods
The experiment was conducted on a rural property of Guaíra, Brazil (20º12’45" S and 48º26’57'’ W, at an altitude of 528 meters), from April 14 to August 12, 2013. The average temperature during the experiment was 20 °C. The cumulative rainfall for the period was 107 mm, while 86 mm occurred in the first 25 days after sowing. The climate is classified as tropical, Aw in the Köppen-Geiger classification system, with a dry season and a well-defined rainy period between March and August.
The soil of the Guaíra city, where the experiment took place, was classified as Acrustox Latosol (EMBRAPA, 2006). Prior to the installation of the experiment, the soil was sampled in the 0-20 cm layer, and analyzed according to Raij et al. (2001): pH(CaCl2) 5.4; organic matter = 28 g dm-3; P(resin) = 34 mg dm-3; 29, 3.9, 22, 11, and 67 mmolc dm-3 of H+ Al, K+, Ca2+, Mg2+, and cation exchange capacity, respectively.
Considering soil analysis and based on recommendations for the crop (Cantarella & Raij, 1997), the sowing fertilization to yields of 16-20 t ha-1 of sweet corn, made in grooves, consisted of 30 kg ha-1 of N (urea), 60 kg ha-1 of P2O5 (applied as simple superphosphate) and 50 kg ha-1 of K2O (applied as potassium chloride). Coverage fertilization was made at 10 and 22 days after emergence (DAE) with 96 kg ha-1 of N and 220 kg ha-1 of K2O.
The sowing of supersweet corn hybrid GSS 41243 (Syngenta) was held on April 14, 2013, with a depth of 0.04 m, and spacing 0.50 x 0.25 m. During the growing season, the plants were irrigated with a total of 460 mm of water, through a center pivot, during the cycle: it was applied 5 mm day-1 at stage V0 to V2; 20 mm in V3 to V8 (once a week); 25 mm in V9 to V14 (once a week) and 45 mm between Vt - R3 (once a week). The rain was discounted of the quantity of water to be applied. The control of weeds, pests and diseases were performed with products registered for the crop.
A completely randomized design was adopted, with nine dates of plant extraction (20, 30, 40, 50, 60, 70, 80, 90 and 100 DAE) and four replications, with 10 plants picked in each replication, totaling 40 plants per date. The plant extraction dates corresponded to the developmental stages V6, V7, V9, V12, V16, VT, R1, R2, R3, respectively.
The nutritional status of ‘GSS 41243’ was evaluated according to Cantarella & Raij (1997), at the start of flowering (stage VT). Middle third region of the leaves located on ear base was collected.
Leaves, stem, tassel (male inflorescence) and ear were washed in tap water, then with deionized water with a detergent solution at 1 mL L-1 and deionized water, and placed to dry into an oven with forced air circulation at 65 °C until constant mass. The dried samples were weighed to estimate dry matter accumulation in each vegetable part. In the last collection time of the plants, we harvested the ears, and the grains were separated and weighed.
Subsequently, according to Bataglia et al. (1983), macro and micronutrient values were determined in each plant and each collection time. Total N was determined by digestion with sulfuric acid (value was determined by Kjeldahl method). The P, S, K, Ca, Mg, Fe, Cu, Zn and Mn contents were determined by digestion with nitric-perchloric acid. The P content was determined by colorimetry with ammonium metavanadate, and the S content was determined by turbidimetry of barium sulfate with a spectrophotometer. Potassium (K), Calcium (Ca), Magnesium (Mg), Iron (Fe), Manganese (Mn), Zinc (Zn) and Copper (Cu) contents were determined with atomic absorption spectrophotometer. The B content was determined by digesting the dry matter by burning it in an alkaline medium using azomethine colorimetry, followed by measurement in a spectrophotometer.
To calculate the quantities of nutrients extracted by the crop (kg ha-1), 80,000 plants ha-1 were considered. The export of nutrients corresponded to the amounts of nutrients present in the ear (R3).
To represent growth data and accumulation of nutrients, the software ORIGIN 6.1 was used. Some equations were evaluated, and the logistic function [Y = A/(1+e-K(X-Xc))] was chosen due to its better adjustment (determination coefficient), where: Y = average value of the characteristic; A = asymptotic maximum (maximum quantity); K = average value of the increase of accumulated quantity; X = time (days); Xc = time to reach half of the maximum quantity. The significance level (F value) was calculated.
Results and Discussion
The emergence occurred 10 days after sowing. The development of supersweet maize ‘GSS 41243’ was characterized by the vegetative (until 73 DAE) and the reproductive stages (74-100 DAE under the thermal conditions of this experiment). The crop yield was 18.5 t ha-1 of ears and 5.3 t ha-1 of grains. Nutrient concentrations in the standard leaves of diagnosis of nutritional status were 26.5 g kg-1 of N, 3.2 of P, 16.6 of K, 4.8 of Ca, 1.5 of Mg 2.2 g kg-1 of S, and 13.5 mg kg-1 of B, 9.9 of Cu, 206.0 of Fe, 22.5 of Mn and 23.0 mg kg-1 of Zn.
The accumulation of leaf dry matter (LDM), stem dry matter (SDM), tassel dry matter (TDM) and ear dry matter (EDM) during the growing season can be divided into three phases (Figure 1A). Up to 30 DAE (V7), the plant accumulated 10.7 and 5.2 g plant-1 of LDM and SDM, respectively (Figure 1A), corresponding to 17.6 and 5.5 % of the total accumulated in these parts at the end of the cycle. From then on, there was a large accumulation of dry matter by the plant, primarily in vegetative parts, and from 70 DAE (VT) in the ear. Only about 15 days before the ear harvest, which occurred at 100 DAE, a slowdown in the accumulation of dry matter by the plant was observed.
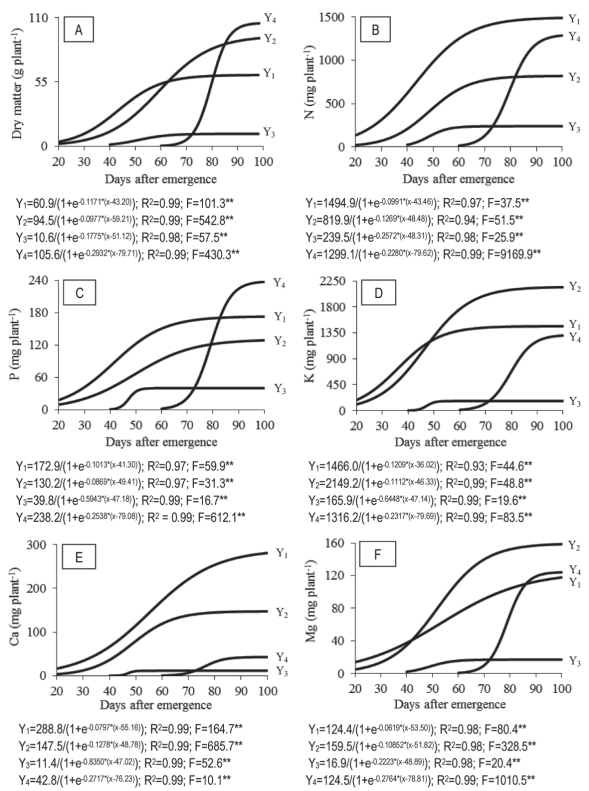
Figure 1: Accumulation of dry matter - A; nitrogen (N) - B; phosphorus (P) - C; potassium (K) - D; calcium (Ca) - E; and magnesium (Mg) - F; in leaves (Y1), stem (Y2), tassel (Y3) and ear (Y4) during the sweet corn cv. ‘GSS 41243’ cycle.
The highest growth rate of LDM (1.4 g plant-1 day-1) occurred between 30 and 60 DAE (V7 and V16 in this experiment), while in the preceding and subsequent periods the rates were 0.6 and 0.2 g plant-1 day-1, respectively. For SDM, the period with a greater accumulation was longer than the observed for LDM, between 30 and 80 DAE (V7 and R1) (Figure 1A). After this period, the plant accumulated 78.4 g of SDM, corresponding to 84.5 % of the total SDM accumulated at the end of the crop cycle. The slowdown in LDM accumulation, which occurred from 60 DAE (V16) was only verified to SDM from 80 DAE (R1). The issuance of leaves ceased during bolting (VT).
The male inflorescence onset occurred at 40 DAE (V9) and 20 days after it reached its maximum accumulation of dry matter. The bolting concluded between 68 and 70 DAE when the last branch of the tassel became fully visible and style-stigmas were still displayed in the ear.
Between 70 and 90 DAE (VT and R2), there was a rapid and large accumulation of EDM: 4.7 g plant-1 day-1. From 81 and 85 DAE, the amount of EDM exceeded the amounts of LDM and SDM, respectively. During this period, there was a large accumulation of EDM due to the accumulation of sugar, which occurs in this stage (R1 and R2). The grains experience a period of rapid accumulation of DM (Molina et al., 2013), and stem and ear husks grow up to the stage R2.
At the end of the cycle (R3), leaves, stem, tassel and ear accumulated 60.9, 92.7, 10.6 and 105.3 g plant-1, respectively, being equivalent to 22.6, 34.4, 4.0 and 39.0 % of the plant’s total dry matter (269.5 g plant-1), corresponding to 21.5 t ha-1. The accumulated amount was lower than the found by Maggio (2006), who studied the growth of ‘Tropical’ supersweet corn and found 26.3 t ha-1. The difference between both works can be attributed to the different genetic potential of cultivars, as well as to the growing season and different managements, generally growing conditions.
Macronutrient absorption
The demand for nitrogen (N) by ‘GSS 41243’ varied during the plant development, being smaller in the initial phase (up to 30 DAE, V6) and higher in the subsequent period until the end of the crop cycle. Although stabilizations occurred in the accumulated amounts of N in the leaf, stem, and tassel, from the stage VT, the demand for N by the ear keeps the plant N requirement at a high level (Figure 1B).
The leaves had a higher proportion of N than other parts of the plant, probably due to a high metabolic activity in these organs. Nitrogen works as a constituent part of amino acids and proteins and is present in the composition of ATP, NADH, NADPH, chlorophyll, and enzyme Rubisco (Hawkesford et al., 2012).
Up to 30 DAE (V6), when LDM represented 17.6 % of the maximum accumulated value at the end of the cycle, the amount of N present in this part was 21 % (315.0 mg plant-1) of the maximum accumulated. Maggio (2006), for ‘Tropical’ supersweet corn, observed a small absorption in the first 30 days after sowing, equivalent to 228 mg plant-1, increasing considerably from this point on, as also happened in this work.
In the following period, between 31 and 70 DAE (V7 and VT), 1,027.7 mg N plant-1 (70 % of the total) were accumulated by leaves, with a rate of 26.4 mg plant-1 day-1. In the last 30 days of the cycle, the rate was 3.0 mg plant-1 day-1. This result may be explained by a strong accumulation of mass by corn, which causes high demand and accumulation of nutrients, mainly N. According to Heckman (2007), this period is characterized by the appearance of leaves in succession every 2 or 3 days.
In the stem, the greatest demand of N occurred at 35-70 DAE (644 mg plant-1) at stages V8 to VT, with a rate of 18.4 mg plant-1 day-1, while in the preceding and subsequent periods the rates were 8.4 and 1.5 mg plant-1 day-1, respectively.
The decreased accumulation of N in the leaf and stem occurred from 70 DAE, a period that saw a strong demand for N by the ear. The formation and grain filling are directly related to the translocation of photosynthates and nutrients, including N, for this main drain (Molina et al., 2013).
The reproductive parts of the plant showed a great difference in the N accumulation rate, as did the accumulated amount (Figure 1). The tassel showed a higher increase from 40 to 55 DAE. Soon after, accumulated N stabilized. The ear, on the other hand, showed a rapid accumulation between 70 and 90 DAE in this experiment (VT and R2; 1057.5 mg plant-1, that is, 82 % of the total accumulated N in this part) (Figure 1B), with a daily accumulation rate of 52 mg plant-1 day-1.
At 55 DAE, the plant had accumulated 50 % of N at the end of the cultivation cycle. Borin, Lana & Pereira (2010), for the hybrid ‘Tropical’ in summer planting, found that half of the plant’s N was absorbed up to 36 DAE (V7). This difference can be attributed to the genetic material used, but also to the growing season, which was winter and summer, respectively, environmental conditions in general influence plant growth. Molina et al. (2013) stated that the corn crop accumulates 50 % of the required N between 25 and 45 days, showing the importance of nitrogen coverage fertilization, which should be made at an appropriate timing at stages V6 and V8.
At the end of the cycle, the accumulation of N in the leaves, stem, tassel and ear, were 1,489.2 (38.8 %), 818.7 (21.3 %), 239.5 (6.4 %) and 1,286.6 (33.5 %) mg plant-1, respectively, totaling 3,835.0 mg plant-1 (100 %). These N partitioning results corroborate the results obtained by Maggio (2006), who noted that N in the vegetative part amounted to 59.5 % and in the reproductive parts 40.5 %.
Assuming that the photosynthetic canopy of the plant is responsible in large part to supersweet corn yield and that N has a high correlation with the formation of this photosynthetic apparatus, it can be inferred that the period from V7 to V16 (30 and 60 DAE in this experiment) is a strategic period for nitrogen fertilization of the crop. Besides being characterized by a high demand of N by the leaves, this period also precedes a high demand of N by the ear because the number of grain rows per ear (V8), the number of grains and size of the spike (V12) and the number of kernels per row (V16) are then established (Carmo et al., 2012). Therefore, in this period, N must be available to meet the demand of the plant, which is influenced by the timing of application (partitioning of the N dose) and by environmental factors that can affect the efficiency of nitrogen fertilization. The high N requirements make this culture highly responsive for nitrogen fertilization.
At the beginning of growth and up to 30 DAE (V7), the plant accumulated in the leaves and stem 41.7 and 20.3 mg.plant-1 of phosphorus (P), respectively (Figure 1c), corresponding to 24 and 15.8 % of the total accumulated in the respective parts at the end of the cycle. It was found that the higher P rate in the leaves (3.6 mg plant-1 day-1) occurred between 30 and 60 DAE (V7 and V16), in coincidence with a large accumulation of DM in the leaves, at a rate of 1.4 g plant-1 day-1. In this interval, 108.64 mg plant-1 of P was accumulated, corresponding to 63 % of the total in the leaves. In preceding and subsequent periods, the rates of P accumulation were 1.4 and 0.5 mg plant-1 day-1, respectively.
Between 30 and 70 DAE (V7 and VT in this experiment), the greatest accumulation of P in the stem (91.2 mg plant-1; 71 % of all P extracted by the stem) was observed, with a rate of 2.3 mg plant-1 day-1. From 60 (V16) and 70 DAE (VT) for leaves and stem, respectively, the accumulation of P decreased greatly, while in the ear it grew up to 90 DAE (R2) (Figure 1C). The largest sink-power of the ear in relation to the leaves, added to the high mobility of phosphorus in the plant, can explain the result observed characterizing a P redistribution in the sweet corn plant.
Similar results were found by Borin, Lana & Pereira (2010), who observed the accumulation of P in the leaves and stem of supersweet corn increased until 63 DAE, and after the reductions occurred. The greatest accumulation of P by the ear, 202.5 mg plant-1 (85.5 % of the total accumulated by the ear), with a rate of 10.1 mg plant-1day-1, occurred between 70 and 90 DAE (VT and R2). In the final 10 days period, there was a stabilization in P accumulation in the ear.
At the end of the cycle, the total of P in the leaves, stem, tassel and ear was 172.5, 128.6, 39.8 and 237.0 mg plant-1, respectively (Figure 1C), corresponding to 29, 23, 7 and 41 % of the total P accumulated (577.9 mg plant-1) by ‘GSS 41243’. In the work by Maggio (2006), the maximum of P in the whole plant was 1,361.1 mg. The vegetative part represents 57 % of the accumulated P versus 43 % of the reproductive part. Heckman (2007) studied the accumulation of nutrients in «Senor» sweet corn and found 901.4 mg plant-1 at the end of the cycle.
P is a nutrient required by the grains (Molina et al., 2013), linked to the storage of organic compounds such as phytates in the ear. Phytates are presumably involved in the regulation of starch synthesis during grain filling (Hawkesford et al., 2012). Phosphorus is involved in metabolic processes of the plant, and more concentrated in active growth areas. Therefore, although the amount required by the plant is small, most of the P absorbed is exported, which implies a need for constant replenishment of this nutrient in the soil with corn cultivation.
A high accumulation rate of potassium (K) was observed during the first 30 to 50 DAE (V7 to V12 in this experiment), with an absorption rate even higher than that of N, suggesting a greater need for this nutrient in relation to N and P as a «trigger» element for initial growth. Based on the high demand for K in early developmental stages of the supersweet corn plant, the application of K should be made in the initial period, up to 30 and 40 DAE, as highlighted by Fallas & Echandi (2011). Cantarella & Raij (1997) proposed that the application of K in coverage should be carried out up to 25 to 30 days after germination; this nutrient has a low efficiency when applied subsequently.
At the early vegetative stage, the leaves had a higher K accumulation than the other organs (Figure 1D). From 20 to 50 DAE (V6 to V12), a period that has larger increments of K in leaves, 1,260.3 mg plant-1 of K (86 % of the total accumulated in this tissue) was accumulated, with a 42 mg plant-1 day-1 rate. After 50 DAE, the rate was 4.1 mg plant-1 day-1. Borin, Lana & Pereira (2010) observed an increased K accumulation rate up to 45 DAE in the vegetative part, and then stabilized.
The largest accumulation of K in the stem occurred from 30 to 60 DAE, when this nutrient accumulated 1,763.4 mg plant-1, i.e., 82.2 % of the total accumulated in this organ, with a daily increment of 44 mg plant-1. Subsequently, the increase was 8.9 mg plant-1 day-1. The accumulation of K in the stem was higher than the one in the leaves from 49 DAE, a period characterized by a high dry matter accumulation in the stem. In the end, K was more accumulated in the stems than in other organs of the plant (Figure 1D).
The ear showed an increased accumulation of K between 70 and 90 DAE (VT and R2: 1,079.6 mg plant-1), representing 82.8 % of the total accumulated by the organ (Figure 1D). The daily rate in this period was 36.0 mg plant-1, lower than that the observed in the leaf and the stem. Therefore, it can be proposed that differing from the observed for N, the largest demand for K by ‘GSS 41243’ was from 20 to 60 DAE.
The total K accumulation by ‘GSS 41243’ at the end of the cycle was 5,079.4 mg plant-1, corresponding 1,465.4 (28.9 %) to the leaves, 2,143.7 (42.2 %) to the stem, 165.9 (3.2 %) to the tassel and 1,304.4 (25.9 %) to the ear. Similarly, Hart et al. (2010), in a cultivation of hybrid Oregon, observed 40 % of K accumulated in the stem, 35 % in the leaves and 25 % in the ear.
Potassium was accumulated in greater amounts by the crop at the end of the cycle, confirming the results obtained by Maggio (2006), Heckman (2007), Borin, Lana & Pereira (2010), and Hart et al. (2010). However, the amount of K (7,334.9 mg plant-1) accumulated by the supersweet corn hybrid in summer as verified by Maggio (2006). The K extraction (8,400.0 mg plant-1) reported by Heckman (2007) was higher than the K extraction found in this study.
Calcium accumulation by leaves occurred especially between 30-80 DAE (V7 to R1 in this experiment), (219.6 mg plant-1, Figure 1E), i.e., 78.2 % of the total Ca accumulated in the leaves, with an average daily accumulation of 4.4 mg plant-1. In the previous period, the rate was 1.5 mg plant-1 day-1 and in the later period 1.2 mg plant-1 day-1. The stem was the second organ in Ca accumulation, and it did it in a shorter period than the observed for the leaves, between 30 and 60 DAE, in which 97.5 mg plant-1 were accumulated with a rate of 3.9 mg plant-1 day-1. In this period, 66.2 % of the total Ca in the stem was accumulated (Figure 1E). After 60 DAE, Ca accumulation in the stem remained constant until the end of the cycle.
In the tassel, Ca accumulation was negligible when compared to the total accumulated by the plant, i.e. about 2.3 %. There was also a small accumulation in the ear, with a greater rate observed between 70 and 80 DAE (2.5 mg plant-1 day-1). Up to 80 DAE (R1), 11.5 mg Ca plant-1 were accumulated in the ear, close to the value found by Borin, Lana & Pereira (2010), i.e. 10.1 mg plant-1 of Ca in the ear of ‘Tropical’ supersweet corn.
At the end of the cycle, the amounts of Ca in the leaves, stem, tassel and ear were 281.0 (30.5 %), 147.3 (58.3 %), 11.5 (2.4 %) and 42.7 (8.8 %) mg plant-1, respectively, totaling 482.5 mg plant-1. The proportion allocated in the ear, as observed in this study, was similar to the proportion found by Borin, Lana & Pereira (2010), i.e. about 8 %, and was below the range mentioned by Heckman (2007) of about 10 % to 15 % of Ca usually present in this part of the plant. Maggio (2006) reported more accumulation of Ca (795.4 mg plant-1) in ‘Tropical’ supersweet corn than the obtained for the hybrid ‘GSS 41243’ used in this work. However, this author observed that vegetative and reproductive parts accumulated 85 and 15 % of Ca, respectively, a partition similar to the one found in this study. Calcium is more accumulated in the leaves than in the stem and ear because it is an element with a low mobility, as the greater part of Ca is found in the form of calcium pectates, constituting the medium lamella of cell walls (Hawkesford et al., 2012).
A higher Mg accumulation in leaves (90.4 mg plant-1) occurred between 20 and 80 DAE (V6 and R1 in this experiment, Figure 1F) and it accounted for 76.7 % of the total Mg accumulated by the leaves throughout the cycle. In the stem, the largest Mg accumulation occurred from 35 to 75 DAE (V8 to R1; 117.9 mg plant-1), with a rate of 3.4 mg plant-1 day-1 of Mg, while in preceding and subsequent periods, the rates were 1.0 and 0.6 mg plant-1 day-1, respectively. The ear showed a rapid increase of Mg between 70 and 85 DAE (95.4 mg plant-1), corresponding to 77 % of the total accumulated by the ear, with a daily accumulation rate of 6.4 mg plant-1. After 85 DAE, an average of 0.77 mg plant-1 day-1 was observed.
At the end of the cycle, the amount of Mg in the leaves, stem, tassel and ear were 117.9 (28.2 %), 158.5 (38.0 %), 16.9 (4.1 %) and 124.0 (29.7 %) mg plant-1, respectively, totaling 417.3 mg plant-1 of Mg (Figure 1F).
Sulfur accumulation curves (S) during the supersweet corn growth resemble those of N, but with smaller amounts (Figure 2A). Throughout the crop cycle, S accumulation was mainly in the leaves (Figure 2A).
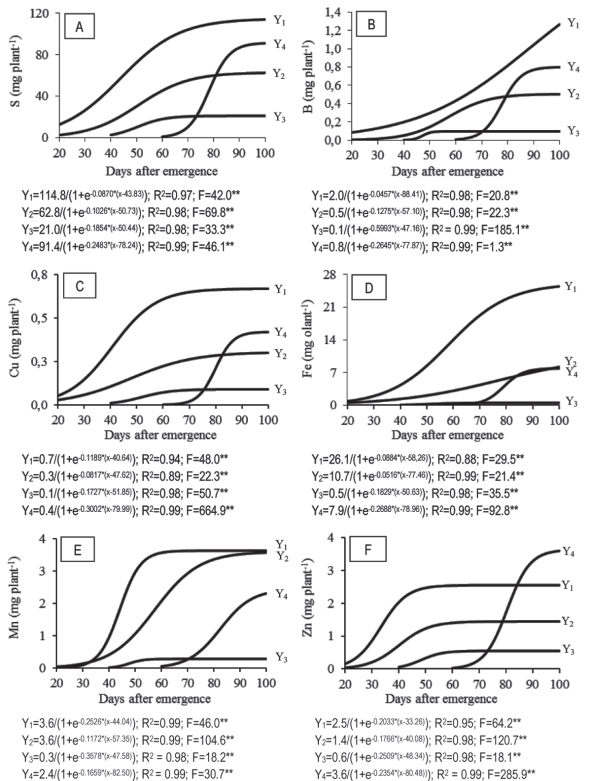
Figure 2: Accumulation of sulfur (S) - A; boron (B) - B; copper (Cu) - C, iron (Fe) - D; manganese (Mn) - E; and zinc (Zn) - F; in leaves (Y1), stem (Y2), tassel (Y3) and ear (Y4) during the sweet corn cv. ‘GSS 41243’ cycle.
The higher accumulation of S in leaves occurred in the period between the stages V7 and VT, 30 and 70 DAE, with 80.5 mg plant-1, equivalent to 70.6 % of the total accumulated by that organ. The rate observed in this period was 2.68 mg plant-1 day-1. Later, the rate decreased to 0.4 mg plant-1 day-1, showing stabilization until the end of the cycle. In the stem, the largest increase in S occurred from 35 to 70 DAE (40.6 mg plant-1), being 65 % of the total accumulated in that part of the plant. During this interval, there was a daily S accumulation of 1.16 mg plant-1. From 70 DAE, the accumulation of S in the leaves and in the stem showed stabilization, while it grew in the ear.
In the ear, an accelerated accumulation of S was observed between 70 and 90 DAE (76.3 mg plant-1), equivalent to 84 % of the total accumulated by the ear (Figure 2A), with a daily accumulation rate of 3.8 mg plant-1. From 90 DAE, the S accumulation rate decreased to 0.3 mg plant-1 day-1 until the end of the cycle. At the end of the cycle, the accumulation of S in leaves, stem, tassel and ear were 114.0 (40.0 %), 62.5 (21.5 %), 21.0 (7 %) and 91.0 (31.5 %) mg plant-1, respectively, with a total of 288.5 mg plant-1.
The maximum accumulations of S, as verified by Maggio (2006) and Heckman (2007), were 586.2 and 774.8 mg plant-1, respectively. Borin, Lana & Pereira (2010) found a lower value of S accumulated in supersweet corn: 199.0 mg plant-1. The period with the greatest demand for S by ‘GSS 41243’ occurred between V7 and R2, a period that coincided with an increased demand for N by the plant. Despite being the macronutrient with the less accumulated amount by ‘GSS 41243’, S is of fundamental importance in plant metabolism, because it is a part of the essential amino acids that are in the composition of all proteins, having also a structural function. It also participates as a component of the active group of the enzyme complex (Hawkesford et al., 2012).
Micronutrients absorption
Throughout the sweet corn cycle, there was a higher B accumulation in leaves if compared to other parts of the plant (Figure 2B). This is explained by its limited mobility in the phloem, hardly being redistributed in the plants. This may be related to its functions in the plant, such as in the structure of the cell wall and pectic substances associated with it (Broadley et al., 2012). The accumulation of B in the leaves increased throughout the cycle, with a growth rate of 0.012 mg plant-1 day-1.
In the stem, the accumulation of B was very small until 40 DAE (V9), a period in which the accumulation rate was was a greater increase (0.37 mg plant-1; Figure 2B), i.e. 70.4 % of the total B accumulated in the stem, with an average accumulation rate of 0.012 mg plant-1 day-1. In the ear, the greatest accumulation of the B was from VT to R2 (70-85 DAE), at a rate of 0.04 mg plant-1 day-1 reaching 0.60 mg B plant-1 (75 % of the total accumulated in the ear) and stabilizing after then.
At the end of the cycle, the total B accumulation was 2.67 mg plant-1, being 1.27 (47.6 %), 0.50 (18.7 %), 0.1 (3.7 %) and 0.80 (30.0 %) mg plant-1 in the leaves, stem, tassel and ear, respectively. A higher value was found by Maggio (2006), 3.69 mg plant-1 (55.0 % accumulated in the vegetative part of the plant).
During all the crop cycle, just as was verified for B, copper (Cu) was concentrated in the leaves, appearing in much larger quantities than in other organs of the plant (Figure 2C). The accumulation of the total Cu was 1.48 mg plant-1, being 0.677 (45.0 %), 0.301 (20.0 %), 0.09 (5.0 %) and 0.420 (30.0 %) mg plant-1 in leaves, stem, tassel and ear, respectively (Figure 2C).
The maximum accumulation of Cu in the sweet corn crop found by Maggio (2006), i.e. 1.48 mg plant-1, was the same than the one found in this work. On the other hand, the amount allocated to its vegetative part of the total of the plant (65 %) was slightly lower than the observed by Maggio (2006) (77.8 %). The maximum accumulation of Cu in the leaves relates to the function performed in chloroplasts, with more than half of the amount linked to plastocyanin (Broadley et al., 2012).
At the beginning of growth and up to 40 DAE, the plant accumulated small amounts of iron (Fe) in the leaves, 4.32 mg plant-1, with an accumulation rate of 0.26 mg plant-1 day-1 (Figure 2D). However, after 40 DAE, there was a large accumulation of Fe in leaves showing much larger cumulative quantities when compared to other organs in the plant. The highest Fe accumulation rate in the leaves (3.6 mg plant-1 day-1) occurred between 40 and 85 DAE, accumulating 77 % (19.5 mg plant-1) of the total of leaves.
The total Fe accumulated by ‘GSS 41243’ was 42.0 mg plant-1, distributed as follows: 60.5 % in the leaves (25.4 mg); 19.5 % in the stem (8.2 mg); 18.8 % in the ear (7.9 mg), and 1.2 % in the tassel (0.50 mg). Maggio (2006) found 99.25 mg plant-1 of Fe, 71.0 % in the vegetative parts, lower than the observed in this study (80 %).
At the beginning of growth, up to 30 DAE, ‘GSS 41243’ showed a little accumulation of manganese (Mn) in the leaves and stem (Figure 2E). In the leaves, the highest Mn accumulation rate occurred between 30 and 55 DAE, accumulating in this interval 91.4 % of the total in the leaves (3.3 mg plant-1). In the stem, the increase in Mn accumulation was present in a greater period, from 35 to 75 DAE (3.1 mg plant-1), with a rate of 0.067 mg plant-1 day-1.
At 70 DAE, a period in which the flowering began (R1), Maggio (2006) found that the plant accumulated 23.0 mg plant-1 of Mn against 7.22 mg plant-1 found in this work. At the end of the cycle, the distribution of total accumulation of Mn in ‘GSS 41243’ was 37 % (leaves), 36.7 % (stem), 2.8 % (tassel) and 23.5 % (ear), that corresponded to 3.6, 3.6, 0.3 and 2.3 mg plant-1, respectively, totaling 9.8 mg plant-1. Maggio (2006) observed 24.2 mg plant-1.
The period during which a greater accumulation of zinc (Zn) (1.63 mg plant-1) occurred in the leaves was 25-40 DAE (V7 to V9), equivalent to 64 % of the total in this tissue, and with a 0.108 mg plant-1 day-1 rate. After 40 DAE, the daily accumulation was 0.0073 mg plant-1 day-1, showing a stabilization until the end of the cycle. The decrease in Zn accumulation in leaves, which occurred from 40 DAE, was different from the one of the stem. This occurred from 50 DAE, because the remobilization of this nutrient to the ear became the main drain of the plant (Figure 2F). A growing accumulation of Zn was found in the ear between 70 and 90 DAE (VT and R2), with a value of 2.99 mg plant-1, equivalent to 83.3 % of the total accumulated in this organ. The daily rate of accumulation in this interval was 0.15 mg plant-1 and it reduced to 0.027 mg plant-1 after 90 DAE.
At the end of the cycle, the supersweet corn accumulated in the leaves, stem, tassel, and ear was 2.55, 1.45, 0.55 and 4.0 mg Zn plant-1, respectively, totaling 8.55 mg Zn plant-1. Conversely to other micronutrients, the maximum Zn accumulation obtained by Maggio (2006) was lower (6.3 mg plant-1) if compared to this work (8.55 mg plant-1). Zn accumulation values between the various parts of the plant represented 30 % (leaves); 17 % (stem), 6.5 % (tassel) and 46.5 % (ear). The higher accumulation of Zn in the ear, when compared to other organs, can be explained by the relation of this nutrient with the synthesis of the amino acid tryptophan, which is a precursor of the biosynthesis of IAA (indolyl-acetic acid), a plant hormone whose main function is to regulate cell elongation and plant growth (Haneklaus et al., 2007).
Conclusions
The amounts of nutrients accumulated by maize supersweet cv. ‘GSS 41243’ were 306.8, 46.2, 406.3, 39.0, 33.4 and 23.1 kg ha-1 of N, P, K, Ca, Mg and S, respectively, and 213.6, 118.4, 3,360.0, 784.0 and 684.0 g ha-1 of B, Cu, Fe, Mn and Zn, respectively, considering the population of 80,000 plants per hectare.
The period of highest demand for nutrients by supersweet corn was between 30 and 60 DAE (V7 and V16). The nutrients N, Ca, S, B, Cu, Fe and Mn accumulated with a greater proportion in leaves, P and Zn accumulated mainly in the ear, and Mg and K accumulated mainly in the stem.
Exports of macronutrients by ears were 103.0, 19.0, 104.5, 3.4, 9.9, and 7.3 kg ha-1 of N, P, K, Ca, Mg and S, respectively, and of the micronutrients Cu, Fe, Mn and Zn were 64.0, 33.6, 632.0, 184.0 and 320.0 g ha-1, respectively.
In proportional terms, regarding the cumulative total, 33 % of N, 41 % of P, 25 % of K, 8.8 % of Ca, 29.7 % of Mg, 31 % of S, 30 % of B, 30 % of Cu, 18 % of Fe, 23 % of Mn and 46 % of Zn were exported with the ears.

