Serviços Personalizados
Journal
Artigo
Links relacionados
Compartilhar
Agrociencia (Uruguay)
versão impressa ISSN 1510-0839versão On-line ISSN 2301-1548
Agrociencia Uruguay vol.18 no.2 Montevideo dez. 2014
Volume and Taper Equations for P. taeda (L.) and E. grandis (Hill ex. Maiden)
Rachid Casnati Cecilia1 2, Mason Euan G1, Woollons Richard1, Resquin Fernando2
1School of Forestry, University of Canterbury, New Zealand
2National Institute of Agricultural Research (INIA) Tacuarembó. Ruta 5 km 386, Tacuarembó, Uruguay
E-mail: crachid@tb.inia.org.uy
Recibido: 21/2/14 Aceptado: 9/7/14
Summary
We compared several taper and volume equations with emphasis in testing the suitability of compatible taper equations, so that they can be used in forest inventories or decision support systems. We used data from 863 and 932 trees of Pinus taeda and Eucalyptus grandis respectively, collected from the Departments of Rivera, Tacuarembó, Paysandú, and Río Negro in Uruguay. In general, rankings of the candidate models were consistent for both species. For volume estimation the most accurate equations were the models presented by Clutter et al. (1983) and Schumacher and Hall (1933) for P. taeda and E. grandis respectively, while for describing stem profiles the most accurate model was a variable exponent equation presented by Muhairwe (1999) and modified by Methol (2001). The best compatible taper equation tested remained in an intermediate ranking position, but represented a satisfactory option for foresters seeking to use the advantages of this class of equations.
Keywords: VOLUME, TAPER, PINUS TAEDA, EUCALYPTUS GRANDIS
Resumen
Ecuaciones de volumen y ahusamiento para P. taeda (L.) y E. grandis (Hill ex. Maiden)
Se compararon diferentes ecuaciones de volumen y ahusamiento, evaluando en especial el uso de ecuaciones compatibles, con el objetivo de ser utilizadas en inventarios forestales o sistemas de apoyo a la toma de decisiones. Utilizamos datos de 863 y 932 árboles correspondientes a las especies Pinus taeda y Eucalyptus grandis respectivamente, provenientes de plantaciones situadas en los departamentos de Rivera, Tacuarembó, Paysandú y Río Negro en Uruguay. En general, los rankings de ecuaciones fueron consistentes para ambas especies; para la estimación de volúmenes las ecuaciones con mayor ajuste fueron aquellas presentadas por Clutter et al. (1983) y Schumacher y Hall (1933) para P. taeda y E. grandis respectivamente, mientras que para la descripción de perfiles el modelo que mejor se ajustó fue la ecuación de exponente variable presentada por Muhairwe (1999) y modificada por Methol (2001). La mejor ecuación de ahusamiento tipo compatible rankeó en posiciones intermedias para ambas especies, representando igualmente una opción satisfactoria para aquellos productores forestales que deseen usufructuar las ventajas de este tipo de ecuaciones.
Palabras clave: VOLUMEN, AHUSAMIENTO, PINUS TAEDA, EUCALYPTUS GRANDIS
Introduction
Accurate taper and volume functions are essential tools for forest management. They complement inventory information intended to quantify volume stand production and evaluate profitability. They are often associated with growth and yield models and used for developing stand level volume equations.
Individual volume functions estimate wood volume using tree variables that are easy to measure such as diameter at breast height (d) and total height (h). Volume functions have been mostly formulated as linear or logarithmic combina-tions of d and h (Clutter et al., 1983). Taper functions describe changes in diameter under or over bark along the stem, and hence they facilitate estimation of log assortments from either inventories or model projections of inventories. Several different classes of equations have been used to describe taper: simple polynomial functions (Bruce et al., 1968; Gordon, 1983; Kozak et al., 1969), variable exponent functions (Kozak, 1988; Muhairwe, 1999; Valentine and Gregoire, 2001; Westfall and Scott, 2010), trigonometric approaches (Bi and Long, 2001; Thomas and Parresol, 1991) and spline functions (Koskela et al., 2006; Liu, 1980; Max and Burkhart, 1976). Compatible taper and volume equations have the big advantage that both taper and volume equations compute identical estimates of tree volume. The first formulation was presented by Demaerschalk (1971, 1972) and since then several authors have reformulated taper equations to be combined with volume functions (Cao et al., 1980; Fang et al., 1999; Jiang et al., 2005; Jordan et al., 2005).
In Uruguay there are only a few publicly available volume and taper models, especially for the Pinus genus, and compatible taper and volume equations are not available. Leites and Robinson (2004) fitted a segmented taper equation developed by Max and Burkhart (1976) augmented with crown variables such as crown length and crown ratio (calculated as the proportion of crown length with respect to total tree height) for Northern P. taeda plantations. Methol (2001, 2003) fitted a modified segmented equation by Max and Burkhart (1976) to represent the stem profile for Eucalyptus grandis and Eucalyptus globulus ssp globulus (Methol, 2006), while Moras and Vallejos-Barra (2013) adjusted volume equations for the latter species growing in the South of the country.
The objective of this study is to fit taper and volume equations for Pinus taeda and Eucalyptus grandis, with special emphasis in testing the suitability of compatible taper equations for plantations of the Northern and Western regions of Uruguay.
Methods
Data from 863 and 932 trees from P. taeda and E. grandis respectively, collected by private companies and the National Institute of Agricultural Research (INIA) from the Departments of Rivera, Tacuarembó, Paysandú, and Río Negro for inventory and research purposes were used. They included measurements of total height (h) and diameter breast height (d) for each tree, as well as diameters under bark (di) for every one metre from the stump height to the tip. Part of the E. grandis dataset also included measures of diameters between 0.6 and 0.7m of height. Total volume under bark (v) was calculated for each section using Smalian’s formula and summating all sections to the tip.
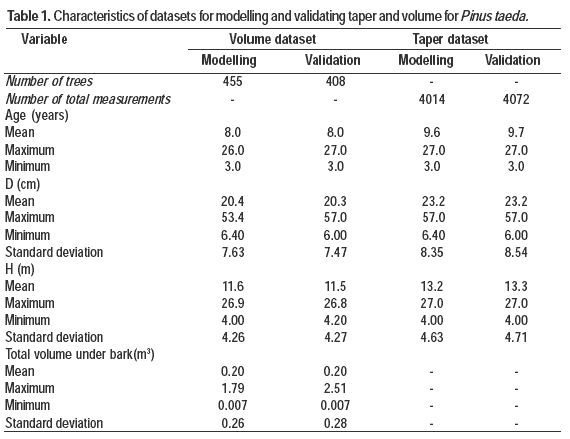
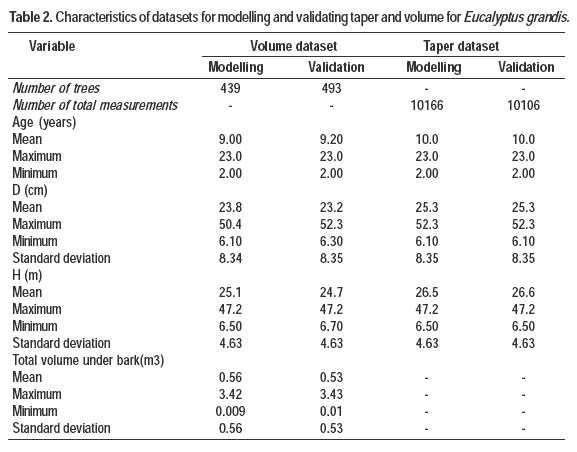
The large dataset available enabled cross-validation for fitting taper and volume equations; hence datasets for taper and volume were randomly split in half for both species. A summary of both datasets (modelling and validation) for each species is given in Tables 1 and 2.
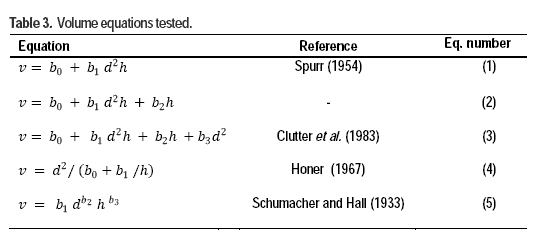
Methods included the following stages: screening, fitting and comparison of equations using the modelling datasets, and testing of equations using the validation dataset. Within the first stage, five linear and non-linear equations were evaluated for volume (Table 3), whereas six equations were tested for taper (Table 4). For the latter group, equations were selected in order to explore a range of approaches including simple taper models such as the model proposed by Ormerod (1973), a sigmoidal approach based in the von Bertalanffy-Richards model proposed by Biging (1984), the segmented polynomial equation developed by Max and Burkhart (1976), a variable-exponent taper equation proposed by Kozak (2004), a variation of Muhairwe (1999) equation proposed by Methol (2001), and finally a compatible polynomial taper equation as utilised by Goulding and Murray (1976).
The procedure followed to construct the compatible polynomial taper equations was basically the same proposed by Demaerschalk (1971, 1972) and extended by Goulding and Murray (1976):
Notation:
Where hi s height corresponding to any di diameter, and v is the volume estimate achieved by using the selected volume function.
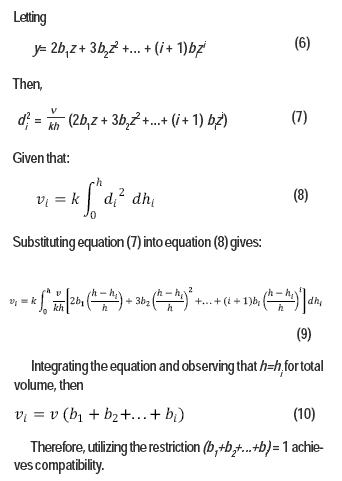
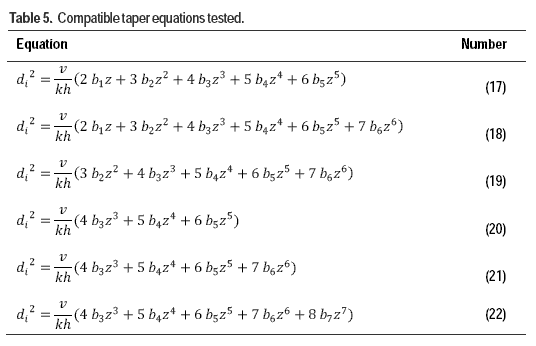
Equation 11 represents the generic form of the compatible taper equation. The final form of the equation was chosen by comparing several forms using up to seven parameters raised from the first to the seventh power (Table 5).
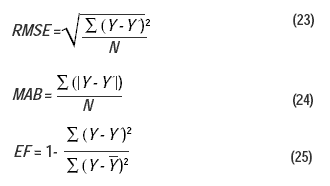
All the models (corresponding to taper and volume) were fitted using ordinary least squares (OLS), and compared with the following statistics: the root of mean squared error (RMSE) as a measure of precision, mean absolute bias (MAB) as a measure of bias (Kozak, 2004), and model efficiency (EF) (Pinjuv et al., 2006). These were calculated as it follows:
Where:
N = number of observations, Y = observed value, and Y’ = expected value, Y = overall mean
The prediction statistics specify how well the model estimates diameter under bark, as opposed to the fitting statistics which indicate how well the models adjust to the data used in its development (Muhairwe, 1999). All four fitting statistics were calculated, ranked and an overall rank for each model was calculated by summing up the rank values for all the statistics. Models with the lowest rank were selected. These steps were repeated for the prediction statistics using the validation dataset in order to verify the choice of the best model. Plots of residuals versus predicted values, as well as versus dependent and independent variables, were examined for detecting bias. In addition, predicted versus observed values were plotted to compare the actual slope with the ideal slope of 1 (Goulding, 1979), and 95 % confidence intervals were assessed.
Results
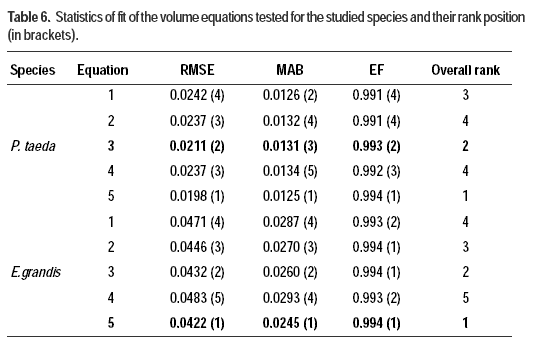
Table 6 shows a summary of the fitting statistics and their rank as well as overall ranks of volume equations for both species. Although differences between the statistics for all the candidate equations are small, model 5 ranked first for both species. Although equation 3 ranked second, it gave better residuals’ distributions and was selected ahead of model (5). For E. grandis the selected equation was eq. 5. Bias indicated by the residual analysis was minimal for both species (not shown).
For P. taeda, plots of predicted versus observed values (Figure 1) for the selected equation (eq. 3) showed that the slope was slightly different from 1. This was confirmed by the confidence interval calculated, which ranged from 1.034 to 1.051. For the volume equation selected for E. grandis (eq. 5), predicted and observed values were closer; the 95 % confidence interval ranged from 0.99 and 1.00.
The prediction statistics generally showed higher degrees of bias and lower precision than the statistics of fitting, which was expected due to the former being calculated with independent data. However, the ranks were very similar, with small differences between models, and the best equation for each species was confirmed.
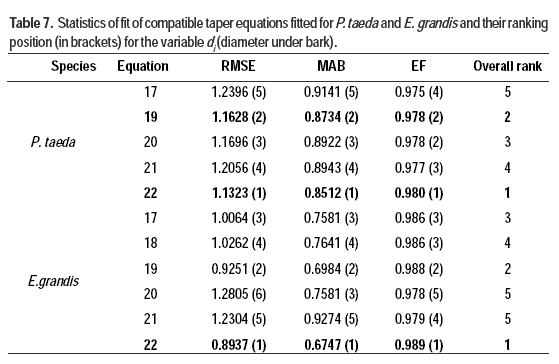
The best compatible taper equation for both species comprised a five parameter form with exponents raised from the third to the seventh power (Table 7), but with the linear and quadratic terms excluded. Equations 19 and 22 consistently ranked in the first and second place for both species whereas the rest of the equations varied in position. Equation 18 yielded inconsistent values for P.taeda and was excluded from further analysis.
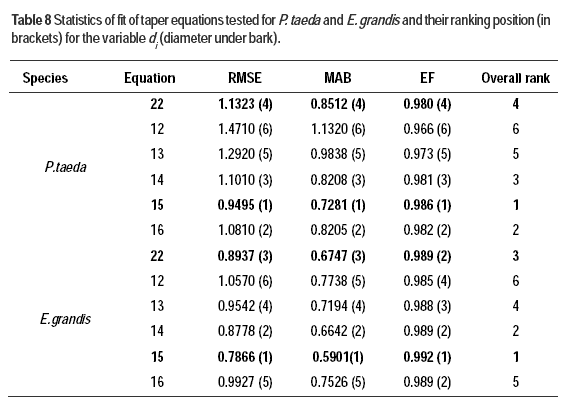
Taper models fitted for P.taeda and E.grandis, are compared in Table 8. The top ranked equations were consistent for both species with the exception of equation 16 which ranked second for P. taeda but showed an inferior performance for E. grandis. Equation 15 ranked first, whereas the compatible equation (22) ranked slightly worse than the segmented equation (14). Equation 12 showed the worst performance for both species. Equations 14, 15, and 22 were selected for further analysis while eq. 16 was excluded (in spite of its good performance for P. taeda) in order to compare different modelling strategies (eq. 16 is a variable-exponent taper equation as well as eq. 15)
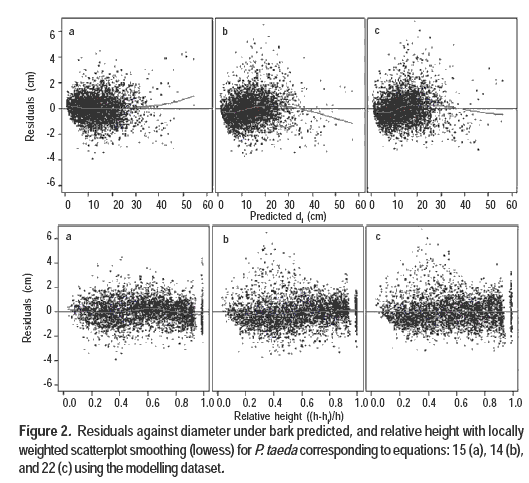
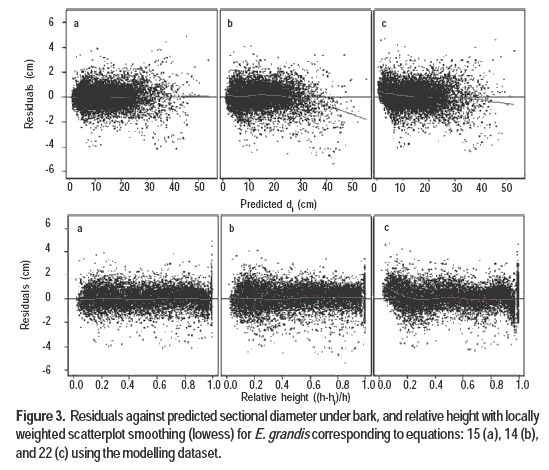
Residuals of the three selected models plotted against predicted values, and relative height are depicted in Figures 2 and 3. Residuals against d were also plotted but are not shown. For P. taeda’s sectional diameter (di), equations 15 and 22 showed the smallest bias. However, large trees were scarce in the dataset and a small bias was observed for di larger than 40 cm. Moreover, equation 22 showed some bias across the range of diameter breast height, overestimating small trees and underestimating larger diameters. For relative height, on the other hand, minimal bias was found for both equations.
For E. grandis, eq. 15 presented minimal bias in general while equation 14 showed a tendency to overestimate values of diameter under bark greater than 30 cm as well as trees with large d (greater than 40 cm). Equation 22 tended to underestimate di at the tip of the tree, but did not show bias with respect to diameter breast height as presented for P. Taeda.
The statistics of prediction developed with the validation dataset showed similar ranks to the fitting statistics. The residual plots obtained using the validation datasets were examined and presented the same tendencies observed for the fitting residuals.
Analysis of plots of observed versus predicted values for the compatible taper equation (eq. 22) indicated that for P. taeda a slope slightly less from 1, with 95 % confidence interval ranging from 0.961 and 0.969. For E. grandis the range included the value 1 for this equation: from 0.999 to 1.003 thus indicating an excellent fit. Plots of predicted versus observed for the compatible taper equations are depicted in Figure 4.
Average tree profiles using independent data and predictions using equations 15 and 22 suggest reasonable representation of taper for the species studied (Figure 5).
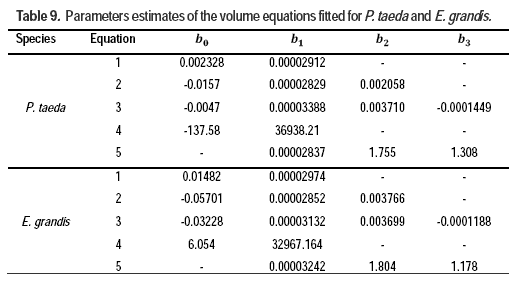
Finally, the parameter estimates for all the fitted volume and taper equations are depicted in Tables 9 and 10.
Discussion
In general, differences between the different models’ fitting statistics were greater for P. taeda than for E. grandis. In the case of taper equations, simpler models performed worse than more complex models.
The Clutter et al. (1983) and the Schumacher and Hall (1933) equations were the best models for estimating volume for P. taeda and E. grandis respectively; however the differences between volume equations were small. Although the selected equations exhibited minimal bias, a big majority of the data for P. taeda represents volumes smaller than 1 m3, hence predictions beyond 1.5 m3 should be treated with caution.
Results for the taper equations fitted for both species indicated that equation 15 is the most precise and least biased of the six equations studied for estimating sectional diameter. This modification of the Muhairwe’s variable exponent model proposed by Methol (2001), was developed for estimating diameter under and over bark for Pinus radiata plantations in New Zealand and diameter over bark for Eucalyptus grandis in Uruguay by Methol (2001) showing comparatively good estimations over 20 models. The original model was developed and fitted for E. pilularis and E. grandis (Muhairwe, 1999) and excelled amongst other equations but it was not so effective in studies involving other species (Rojo et al., 2005). In spite of its good performance, this variable exponent equation presents some disadvantages: (i) it is a complex model which involves nine parameters, (ii) for calculating volume, predicted diameters under bark the function must be numerically integrated, and (iii) merchantable height for any desired diameter cannot be calculated (Muhairwe, 1999).
Equation 14 ranked second and third for E. grandis and P. taeda respectively and precision and bias values were closer to the values corresponding to the compatible equation than the ones corresponding to the eq. 15. This model developed by Max and Burkhart (1976), originally for P. taeda, has been fitted to several species (Alegria and Tomé, 2011; Brooks et al., 2008; Figueiredo-Filho et al., 1996; Jiang et al., 2005; Rojo et al., 2005; Souza et al., 2008), and used as a reference to compare new equations (Cao et al., 1980; Muhairwe, 1999). Methol (2001), observed bias for the diameters predicted with respect to d for this species and proposed a modification of this equation. This particular problem was studied and small bias was observed for trees larger than 40 cm for both species. Moreover, overestimation of large di was found for both species but especially pronounced for E. Grandis.
This equation can be integrated to yield volume to any height (Brooks et al., 2007, 2008), and it can also estimate height to any desired diameter. However, it has the disadvantage that it is not compatible with estimations obtained through volume equations.
Equation 22 based on the polynomial compatible taper equation proposed by Goulding and Murray (1976) remained in intermediate positions in the ranks for both species. It has been suggested that this model does not represent the basal portion of the stem well in species with strong but- tswell. Gordon (1983) pointed out that the original five-parameter equation proposed by Goulding and Murray misrepresents the butt log region and also overestimates diameter at the tip in Pinus radiata, hence he suggested including an additional term well beyond the fifth degree to improve estimation. Muhairwe (1999) tested two models varying the higher terms but still found some bias for large d trees (larger than 60 cm) and for tips of all trees in Eucalyptus grandis and Eucalyptus pilularis. In this study, inclusion of a term raised up to the sixth and the seventh power, but excluding the first and second lower terms, exhibited minimal bias of diameter under bark estimates for P. taeda, although some bias with respect to diameter breast height was found. Although the slope of predicted versus observed values for this species differed from one, the average profile predicted shows very small variation with respect to the average of observations and with respect to the average of the best equation.
For E.grandis, the equation slightly underestimated di values on the tip beyond 85 % of height. Practically, this problem would have very minor implications for assessing wood products to commercial heights up to 4 to 6 cm of di. In general, equation 2.22 showed better fit for this species than for P. Taeda.
Goulding and Murray (1976), show that fitted compatible equations can also be used to estimate merchantable volumes, which is one of the major advantages of this equation. The expressions for P. taeda and E. grandis based on the equation 22 are as follows:
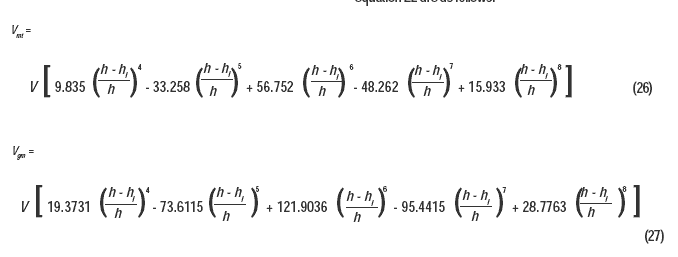
Where
vmt and vmg is merchantable volume for P. taeda and E. grandis respectively to any hi.
Although the fitted models cover a wide range of tree sizes, additional data from trees larger than 45 cm of d are required for both species in order to fit models for a wider d span, especially for sizes near clear-cut age for sawmilling purposes. A better description of the butt log of P. taeda is also needed to improve quality of data and models. In this sense, additional measures at 0.6 to 0.7m of height (Whyte, 1971) are recommended.
Conclusions
The equations recommended for estimating total volume for P. taeda and E. grandis are Clutter et al. (1983) (eq. 3) and Schumacher and Hall equation (eq. 5) respectively. For the former species the prediction error is 12.2 % while for the latter is 7.4 %. It is also recommended to use these equations between the ranges of 0.007-1.5 and 0.009-3.4 m3 for P. taeda and E. grandis respectively.
The expressions are as follows:

Where:
vt and vg = total volume for P. taeda and E. grandis respectively, and other variables as previously defined.
The variable-exponent equation (eq. 15) was the best equation for estimating diameter at any desired height with the lowest prediction errors of 6.7 % and 5.4 % for P. taeda and E. grandis respectively offering comparatively better estimates. The equation can be used between the d ranges of: 12 to 55 cm for P. taeda, and 7 to 50 cm for E. grandis. The expressions for each species are as follows:

With
Where:
dti and dgi = diameter at any height for P. taeda and E. grandis respectively, X = hi/h , and other variables as previously defined.
Based on prediction statistics the compatible taper equation (eq. 22) did not perform quite as well as eq. 15 but because of the advantages of (a) simplicity, (b) compatibility, and (c) relatively small differences with respect to bias and precision with the equation 15, the compatible taper equation can be used for forecasting systems and inventory with some restrictions for P. taeda. This equation should be used within the d ranges of 12 to 40 cm for P. taeda and 7 to 50 cm for E. grandis, and volume ranges as specified for the volume equations. The prediction errors are 8.00 % and 6.18% in diameter under bark estimations for P. taeda and E. grandis respectively. The expressions for each species are as follows:
Where:
dti and dgi = diameter at any height for P. taeda and E. grandis respectively, and other variables and constants as previously defined.
Acknowledgements
We acknowledge the companies: Global Forest Partners, Cloverly, Bosques del Sur, and Forestal Oriental for their generous collaboration by providing data for this study; and Cambium and Terrasys for their support.
References
Alegria C, Tomé M. 2011. A set of models for individual tree merchantable volume prediction for Pinus pinaster Aiton in central inland of Portugal. European Journal of Forest Research, 130: 871-879.
Bi H, Long Y. 2001. Flexible taper equation for site-specific management of Pinus radiata in New South Wales, Australia. Forest Ecology and Management, 148: 79-91.
Biging GS. 1984. Taper equations for second-growth mixed conifers of Northern California. Forest Science, 30: 1103-1117.
Brooks JR, Jiang L, Ozçelik R. 2008. Compatible stem volume and taper equations for Brutian pine, Cedar of Lebanon, and Cilicica fir in Turkey. Forest Ecology and Management, 256: 147-151.
Brooks JR, Jiang L, Clark A. 2007. Compatible stem taper, volume, and weight equations for young longleaf pine plantations in Southwest Georgia. Southern Journal of Applied Forestry, 31: 187-191.
Bruce D, Curtis RO, Vancoevering C. 1968. Development of a system of taper and volume tables for Red Alder. Forest Science, 14: 339-350.
Cao QV, Burkhart HE, Max TA. 1980. Evaluation of two methods for cubic-volume prediction of Loblolly Pine to any merchantable limit. Forest Science, 26: 71-80.
Clutter JL, Fortson JC, Pienaar LV, Brister GH, Bailey RL. 1983. Timber management : a quantitative approach. New York: Wiley. 333P
Demaerschalk JP. 1972. Converting volume equations to compatible taper equations. Forest Science, 18: 241-245.
Demaerschalk JP. 1971. Taper equations can be converted to volume equations and point sampling factors. The Forestry Chronicle, 47: 352-354.
Fang Z, Borders BE, Bailey RL. 1999. Compatible volume-taper models for loblolly and slash pine based on a system with segmented stems form factors. Forest Science, 46: 1-12.
Figueiredo-Filho A, Borders BE, Hitch KL. 1996. Taper equations for Pinus taeda plantations in Southern Brazil. Forest Ecology and Management, 83: 39-46.
Gordon A. 1983. Comparisosns of compatible polynomial taper equations. New Zealand Journal of Forestry Science, 13: 146-155.
Goulding CJ. 1979. Validation of growth models used in forest managament. New Zealand Journal of Forestry, 24: 108-124.
Goulding CJ, Murray JC. 1976. Polynomial taper equations that are compatible with tree volume equations. New Zealand Journal of Forestry Science, 5: 313-322.
Jiang L, Brooks JR, Wang J. 2005. Compatible taper and volume equations for yellow-poplar in West Virginia. Forest Ecology and Management, 213: 399-409.
Jordan L, Berenhaut K, Souter R, Daniels RF. 2005. Parsimonious and completely compatible taper, total, and merchantable volume Models. Forest Science, 51: 578-584.
Koskela L, Nummi T, Wenzel S, Kivinen VP. 2006. On the analysis of cubic smoothing spline-based stem curve prediction for forest harvesters. Canadian Journal of Forest Research, 36: 2909-2919.
Kozak A. 2004. My last words on taper equations. The Forestry Chronicle, 80: 507-515.
Kozak A. 1988. A variable-exponent taper equation. Journal of Forest Research, 1363–1368.
Kozak A. Munro DD, Smith JHG. 1969. Taper functions and their application in forestry inventory. The Forestry Chronicle, 45: 278-283.
Leites LP, Robinson AP. 2004. Improving taper equations of loblolly pine with crown dimensions in a mixed-effect modeling framework. Forest Science, 50: 204-212.
Liu CJ. 1980. Log volume estimation with spline approximation. Forest Science, 26: 361-369.
Max T, Burkhart H. 1976. Segmented polynomial regression applied to taper equations. Forest Science, 22: 283-289.
Methol R. 2006. SAG globulus: Sistema de apoyo a la gestión de Eucalyptus globulus. Montevideo : INIA. 34p. (Serie Técnica ; 158. )
Methol R. 2003. SAG grandis: Sistema de apoyo a la gestión de plantaciones de Eucalyptus grandis. Montevideo : INIA. 42p. (Serie Técnica ; 131. )
Methol R. 2001. Comparisons of approaches to modelling tree taper, stand structure and stand dynamics in forest plantations. Christchurch: University of Canterbury. 596p.
Moras G, Vallejos-Barra OS. 2013. Tablas de volumen para árboles individuales de Eucalyptus globulus ssp. globulus cultivados en la región sur de Uruguay. Agrociencia, 17: 11-24.
Muhairwe CK. 1999. Taper equations for Eucalyptus pilularis and Eucalyptus grandis for the north coast in New South Wales, Australia. Forest Ecology and Management, 113: 251-269.
Ormerod DW. 1973. A simple bole model. The Forestry Chronicle, 49: 136-138.
Pinjuv G, Mason EG, Watt M. 2006. Quantitative validation and comparison of a range of forest growth model types. Forest Ecology and Management, 236: 37-46.
Rojo A, Perales X, Sánchez-Rodríguez F, Álvarez-González JG, Gadow K von. 2005. Stem taper functions for maritime pine (Pinus pinaster Ait.) in Galicia (Northwestern Spain). European Journal of Forest Research, 124: 177-186.
Schumacher F, Hall F. 1933. Logaritmic expression of timber-tree volume. Journal of Agricultural Research, 47: 719-734.
Souza CAM de, Silva GF da, Xavier AC, Chichorro JF, Soares CPB, Souza AL de. 2008. Evaluation of segemented taper models in the estimation of height and merchantable volume of Eucalyptus sp. bole. Revista Árvore, 32: 453-463.
Thomas CE, Parresol BR. 1991. Simple, flexible, trigonometric taper equations. Canadian Journal of Forest Research, 21: 1132-1137.
Valentine HT, Gregoire TG. 2001. A switching model of bole taper. Canadian Journal of Forest Research, 31: 1400-1409.
Westfall JA, Scott CT. 2010. Taper models for commercial tree species in the Northeastern United States. Forest Science, 56: 515-528.
Whyte AGD. 1971. Sectional measurement of trees : a rationalised method. New Zealand Journal of Forest Science, 1: 74-79.


