


Services on Demand
Journal

Article
 English (pdf)
 Article in xml format
 Article references
Related links
Share

 Permalink
Agrociencia (Uruguay)
Print version ISSN 1510-0839On-line version ISSN 2301-1548
Agrociencia Uruguay vol.17 no.1 Montevideo June 2013
Factors Underlying Spatial Variability in Rice (Oryza sativa L.) Grain Quality at Field and Regional Level
Marchesi Claudia1, Thompson James F. 2, Plant Richard E. 3
1Instituto Nacional de Investigación Agropecuaria (INIA) Tacuarembó 45000, Tacuarembó, Uruguay. Correo electrónico: cmarchesi@tb.inia.org.uy
2Department of Biological and Agricultural Engineering, University of California. Davis, CA 95616, USA.
3Department of Plant Sciences and Department of Biological and Agricultural Engineering, University of California. Davis, CA 95616, USA.
Recibido: 7/2/12 Aceptado: 20/12/12
Summary
Accounting for the spatial variability of resources and yields has become both important and feasible in agricultural systems research. Such variability can be detected and addressed at various scales, from that of a small field to a whole region, and completely different problems arise at each scale. Traditionally, agricultural issues have been studied at a small scale (field plots) and then extrapolated in an ad hoc manner to a larger scale (field or region). Results of this process are not always accurate due to the intrinsic differences between the local and the regional level of analysis. In this paper we pursue different approaches as an example of a means of dealing with a particular issue, rice grain quality, at two scales, field and region. At the field level, we test a model that relates head rice (HR) to grain moisture content (GMC) and GMC pattern before harvest. At the region level, we propose a model to predict optimum harvest time for rice varieties in California, based on a degree days (DD) approach. Practical results obtained aid in reducing the risk of loosing HR grain quality at harvest.
Key words: GRAIN QUALITY, HEAD RICE, DEGREE DAYS, GRAIN MOISTURE CONTENT
Resumen
Factores que influyen en la variabilidad espacial de calidad de grano de arroz a distintas escalas
En los sistemas de producción agrícola es cada vez más importante y a la vez factible de tener en cuenta la variabilidad espacial de los recursos naturales y de los rendimientos. Esta variabilidad puede ser detectada y abordada a diferentes escalas, desde la chacra hasta una región, teniendo cada una de ellas problemáticas completamente distintas. Tradicionalmente en agricultura la investigación se ha realizado a pequeña escala (a nivel de parcela) para luego ser extrapolada en forma ad hoc a la escala grande (campo o región). El resultado de este proceso no siempre es preciso dada las diferencias intrínsecas que existen entre los distintos niveles de análisis. En este trabajo se realizan distintos abordajes de un mismo tema –la calidad del grano de arroz– en dos escalas contrastantes –a nivel de chacra y de región– a modo de ilustrar estas diferencias. A escala de chacra se validó un modelo que relaciona porcentaje de grano entero (HR) y contenido de humedad del grano (GMC), así como el patrón de des-humedecimiento de granos previo a la cosecha. A nivel regional se trabajó con un modelo basado en la metodología de los grados-día (DD) para predecir el momento óptimo de cosecha para las variedades más utilizadas en California. En la práctica los resultados obtenidos en estos trabajos contribuyen a reducir el riesgo de perder calidad de grano (HR) en la cosecha.
Palabras clave: CALIDAD DE GRANO, GRANO ENTERO, GRADOS-DÍA, HUMEDAD DE GRANO
Introduction
In the US, the price of rice per unit is based on the percentage of total rice (TR), defined also as the milling yield. The most important component of TR is HR, defined as the proportion of kernels with a length greater than 75% of the whole kernel length. HR is influenced by genetic and environmental parameters, as well as by crop management and post-harvest handling, storage and the milling process. Environmental conditions during the ripening stage can lead to grain quality differences (Geng et al., 1984; Siebenmorgen et al., 2003). There is an apparent relationship between HR and average grain moisture content (GMC) at harvest. Hill et al. (1992) reported for California conditions that as the average GMC of medium-grain rice decreases from 25 to 15%, HR decreases from 65 to 40%. Industry has settled on a threshold of 22 +/- 1% GMC to begin harvesting short and medium grain rice, but recent research shows that good HR values can be reached with a slightly lower GMC (20%), and that harvesting at the currently recommended values actually reduces rice value (Thompson and Mutters, 2006). Also, the pattern of change in GMC as influenced by weather conditions before harvest has an important role in determining the final HR (Thompson and Mutters, 2006).
The structure of rice plants determines the position where kernels are formed -main stem, primary or secondary tiller- affecting the ripening process. Moreover, ripening follows a similar pattern to that of flowering, and therefore all grains in a panicle are not at the same value of GMC at a given time (Holloway et al., 1995). Kunze and Calderwood (2004) mentioned differences about 10 percent between GMC among grains on a single panicle, and an even larger variation among grains in panicles of a single plant. Moreover, a larger variation among grains in panicles in an entire field was reported (Kocher et al., 1990). This GMC variability is important because it implies that the most mature and driest grains would be able to re-adsorb moisture (increasing susceptibility to damage) while the least mature ones would not. At typical harvest moisture contents, California medium grain can have a range in GMC of 20 percent between individual kernels within a field (Marchesi, 2006). This variation is caused by a non-uniform flowering date along the panicle, variation in plant density, and nutrient status. Based on the high variability in kernel GMC, Chau and Kunze (1982) concluded that the longer the crop is maintained in the field, the greater the possibility of the low moisture kernels to fissure before harvest. Previous works have denoted the association between the distribution of single-kernel GMC and the resultant HR, based on the proportion of the rice with GMC lower than a rewetting threshold, which depends on the variety (Kocher et al., 1990; Siebenmorgen et al., 1992). Environmental conditions such as high daytime temperature (common in California during harvest) and north winds induce grains to lose moisture rapidly; conversely, dew and occasional rain lead to moisture re-absorption by grains. Thompson and Mutters (2006) found that in California HR values were significantly reduced when average GMC dropped below 21% under typical calm conditions. They also found that under dry, windy conditions, small HR losses occurred when GMC was below 21%, but a high level of fissuring and HR reduction resulted if the dry weather was followed by a few days of dew (high humidity) and grain re-hydration. They proposed the proportion of individual kernels with GMC below 15% prior to re-hydration as a predictor of HR after re-hydration occurred, instead of relying solely on the average GMC.
Soil-related factors could also affect spatial variability in rice grain quality at the field level. Most California rice fields are laser leveled to achieve a small, uniform slope across the field. This allows the grower to maintain a nearly uniform water depth in each check and facilitates water distribution and other management practices such as tillage, stand establishment, weed control and harvest (Brye et al., 2003). On the other hand, the practice of land leveling increases variability in soil properties due to the cut and fill process, which transfers soil from higher parts of the field to lower parts. In California rice fields, the cut areas are typically left with a thinner and finer-textured surface layer, resulting in increased variability across the field in topsoil depth, texture and fertility. These characteristics have an important effect on crop development, causing an increased variability in rice growth and yield (Dobermann et al., 1997; Roel and Plant, 2004a). Roel and Plant (2004b) reported that the pattern of low yields in some areas within one of the fields they studied matched the pattern of plant growth and was explainable in part by the field’s laser leveling history. High clay content in soil surface horizons influences plant-water relationships, the ability of soils to adsorb nutrients and the activity of pesticides (Chen et al., 2004). Stands in the cut areas tend to be sparser, with smaller plants that mature more quickly (Roel and Plant, 2004b). As a result of this difference in maturation rate, plants in these areas tend to not only have lower yields but also lower moisture content at harvest. If HR is related to moisture content at harvest, these portions of the field may display reduced quality as well as reduced yield.
Grain quality, measured as HR, can also be quite different within maturity groups and grain type (Lan and Kunze, 1996; Geng et al., 1984). An early medium grain variety recently released in California, M-206, has shown superior quality over the most widely planted early medium grain M-202 in experimental trials. M-206 also flowers a little earlier and has less non-synchronized heading than M-202 (Jodari et al., 2004). It is not clear yet how the superior quality of M-206 relates to GMC at harvest. Questions about the pattern of association between GMC and HR for these varieties are not yet answered. It is of interest to compare the patterns of grain desiccation and HR in these two varieties to determine the factors underlying this difference. A better understanding of these factors would aid in better management of each variety to obtain higher quality yields.
When considering rice grain quality variability at a larger, regional, scale, soil heterogeneity and the effect of local weather are harder to evaluate, and one must focus on more general factors to pursue the analysis. Plant growth and development is highly correlated with ambient temperature. Rice plants follow a physiological time, meaning that they require a certain amount of accumulated heat units to complete a certain development stage. This physiological time can be characterized by a staging sequence termed degree days (DD), and is typically measured as the combination of time and temperature above certain threshold (Zalom et al., 1983) and is widely used to predict phenology phenomena such as flowering time and pest outbreaks. In the southeast US and in other countries DD are widely used to describe rice development and to aid farmers to manage the crop in a timely manner (Keisling et al., 1984; Counce et al., 2000) whereas in California there is almost no use of this methodology to estimate phenology and predict events in rice production systems. In California the timing of events such as 50% heading, time of drainage and time of harvest is based on the number of days after seeding. Such estimations could be completely unreliable in years when ambient temperatures are significantly different from mean conditions. Estimations based on DD could be much more precise in terms of predicting events, due to the possibility of monitoring the crop and weather together in real time. Although DD estimations will also have a range, the possibility of obtaining daily information could facilitate the prediction of events such as harvest date at a given GMC with more accuracy, leading to reduced quality loss.
We hypothesize that factors underlying variability of rice grain quality such as HR and prediction capability of events towards obtaining higher HR would differ when considering two scales of analysis (field and region). The objectives of this study were, at the field level, to test the model proposed by Thompson and Mutters (2006) that relates HR to GMC and GMC pattern just before harvest, with data from commercial fields, and at the region level, to predict optimum harvest time for the currently two most important medium grain varieties in California for different locations, based on a DD approach.
Materials and Methods
Field scale
Two laser-leveled fields (R and S) in northern California were monitored in 2003 and 2004 while they were in rice production. Medium grain varieties were used in all situations; Kokuho Rose and M-401 in the R field in 2003 and 2004, respectively, and M-202 in the S field-in 2003. Grain samples from georeferenced points were taken just before harvest in 2003 and during harvest in 2004, and after measuring GMC they were dried with room air and milled to obtain HR percent. Soil samples were also taken at the same points to characterize soil texture (percent clay, silt and sand). Crops were harvested by the farmers with combines equipped with a yield monitor system between mid and late October in each year. GMC data along with rice yield were extracted from the yield monitor and imported into a geographic information system, with further data cleaning before analysis. Two hundred kernels were taken from each quality sample to measure GMC of each kernel with a single grain moisture meter. The following equation was used to estimate the predicted head rice yield (PHRY) addressed in the model elaborated by Thompson and Mutters (2006):
PHRY = MHRY x (1 - TMC) (Eq.1)
MHRY: average maximum head rice yield (%), calculated as the average of samples harvested between 21% and 26% moisture.
TMC: proportion of kernels <15% moisture content at harvest (from the individual kernel moisture content).
Daily average relative humidity and daily maximum wind speed from each site for the 28 days prior to harvest in both years were collected from the California Rice Research Board (2008). Weather stations were located approximately 500 m from the R field and 10 km from the S field.
Regional scale
Using a collection of data from the statewide variety trials (Rice Experimental Station) from 1999 to 2007, detailed information about rice cultivars M-202 and M-206 in six locations was summarized. The locations considered represent, from north to south, Butte County (Durham), Colusa County (Colusa), Yuba County (Yuba- Marysville), Sutter County (Nicolaus), Yolo County (Davis) and San Joaquin County (Lodi West). The information summarized at each location includes management data (seeding and harvest date), crop phenology (time to 50% heading) and GMC at harvest. Weather data (daily minimum and maximum air temperature) was retrieved from the CIMIS (California Irrigation Management Information System, OWUE, DWR) or IPM (Integrated Pest Management, University of California at Davis) weather stations closest to the variety trial in each of the six locations. The information was entered into the DEGDAY worksheet (Snyder, 2005) and the resultant DD from 50% heading to harvest was obtained. Degree days were calculated using the single triangle method with 10 °C lower threshold and 35 °C upper threshold temperatures (Zalom et al., 1983; Caton et al., 1998).
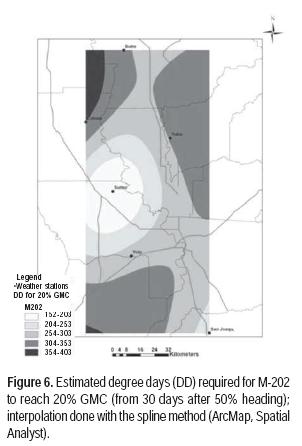
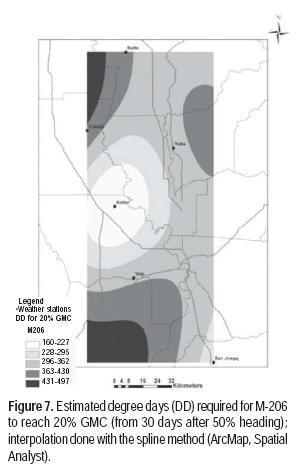
Although the GMC at 50% heading was not measured in the trials, the following assumptions were made based on concepts established by Kunze (1977); Tanaka et al. (1993); and Yoshida (1981). Independent of the moisture content at 50% heading, a fixed value of 30% GMC at 30 days after 50% heading was assumed. From that point, and knowing the GMC at harvest for each variety, year and location, the DD necessary to reach an optimum of 20% GMC at harvest for the two varieties in each location was estimated using a linear regression over all of the data at that location. Based on this relationship and the average minimum and maximum temperatures for the eight years at each location, the average number of days to reach 20% GMC from 30 days after 50% heading was estimated. Finally, the minimum and maximum numbers of days to reach 20% GMC from 30 days after 50% heading obtained in the analysis were used to build the range for each average in each location. Using a geographic information system (ArcMap 9.2, ESRI, Redlands, CA), a regularized spline interpolation method was used to obtain a map of estimated DD to harvest and average number of days to harvest for each variety in the Sacramento and San Joaquin valleys.
Results and Discussion
Field scale
Grain moisture content taken with the yield monitor during harvest is a reasonably good predictor of the crop grain moisture content in the field as measured when the harvested rice is delivered to the drying facility (Figures 1a - 1b; R2 = 0.67-0.73), although their values are different in precision and magnitude. This relationship may be highly dependent on the time lag between the field sampling and harvest date and the technology used (different moisture meters in the combine vs. in the dryer facility). Summarized results for HR, TR and GMC are presented in Table 1. In 2003 the relationship between GMC and HR was positive and significant in both fields (R2 = 0.77 and 0.74 for the R and S fields, respectively), where a drying north wind was present before harvest. The range of GMC at sampling was optimum in the S field (between 17 and 23%) and non-optimal (17 to 27%) in the R field (Table 1). In 2004, data from the R field indicate no relationship between HR and GMC at harvest. In this case, GMC (Table 1) was higher than usual (above 21%) and a north wind was not present until the day of harvest. These results are expected under the Thompson and Mutters (2006) theory and previous works (Siebenmorgen et al., 1992) that with high GMC there are no important HR losses.
Although not all combinations of weather and rice moisture were encountered, obtained results are in accordance with recent data (Thompson and Mutters, 2006). Specifically, the association between GMC and HR depends on the GMC level at harvest (below or above 21%), the weather conditions before harvest (presence or absence of rapid grain drying caused by north wind), and the presence or absence of re-hydration conditions after the dry wind ends. Both R and S fields in 2003 show a decline in HR at GMCs below 20 to 21% GMC (Figure 2).
The standard error between the PHRY and the actual HR (Table 2) is almost zero for the R field in 2003, thus the rice was subject to rehydration conditions before harvest and the north wind that occurred 10 days before sampling did not affect HR. The variability observed in the obtained HR (Table 1) is probably due to the intrinsic variability in the crop and field characteristics. In the S field, the difference between the PHRY and actual HR was -3.43 (Table 2) and the difference was likely caused by the north wind that occurred at sampling. A reduction in rehydration due to the low humidity during the nights may have caused the lower than predicted HR loss. The R field in 2004 was harvested with high GMC and the crop did not experience rewetting of fissuring susceptible, low moisture content rice. Although Siebenmorgen et al. (1992) always refers to the problem of grain rewetting due to rain, the same effect is found in California due to high dew conditions. Diurnal variation in ambient relative humidity during the pre-harvest period needs to be evaluated. In the 2003 R field high variability among individual kernel moisture content was observed (data not shown), confirming the non-uniform conditions of the crop and the field. Some of the individual kernel moisture content distribution curves from the R field coincide with those of a very mature crop and others with an immature one (Kocher et al., 1990; Holloway et al., 1995). On the other hand, in the S field there was high uniformity in individual kernel moisture contents, which would lead to a better grain quality. There is a strong association of HR with kernels harvested at less than 15% GMC (Figures 3a - 3b), indicated by the high R2 in both fields (0.76 in R and 0.58 in S). These results are in accordance with those reported by Thompson and Mutters (2006), which indicate that kernels with less than 15% GMC tend to fissure when subjected to high nighttime humidity.
Based on the available data and the Thompson and Mutters (2006) theory, the suggested association between head rice and grain moisture content at the field level is summarized in Figure 4. Without the north wind and associated nighttime rehydration conditions, HR depends on the GMC at harvest (i.e., GMC at harvest is a good predictor of HR and there is no difference between PHRY and HR). Under north wind conditions before harvest, HR results depend on the amount of kernel rehydration caused by high nighttime humidity or rain. If re-hydration conditions prevail, grains would gain moisture and be susceptible to fissuring, resulting in substantial reductions of HR. On the other hand, if weather conditions do not induce grain re-hydration, HR values are not much affected. There is no data in the tests to show the effect of non-re-hydration conditions producing high HR. In this situation a significant difference between PHRY and HR would be detected. Thompson and Mutter’s (2006) data support this conclusion.
In the R field, regions of poor crop development and yield were associated with more rapid soil and crop desiccation. Moreover, those areas (cut areas) coincide with high soil clay content. The association between soil clay content and soil water content appeared to be opposite from the expected, which is that higher clay content is associated with greater water retention (Troeh and Thompson, 1993). However, soil depth of the cut areas in rice fields could explain the relationship between soil clay content and water. The soil A horizon depth influences crop growth (due to chemical, physical and biological factors) and by affecting soil moisture and other properties related with water availability and water holding capacity (Troeh and Thompson, 1993; Dobermann, 1994). In the cut areas, although the soil had a higher clay content (data not shown), the depth of the root zone was less, leading to poorer plant growth and advanced maturity, lower GMC at harvest and lower HR. Based on the idea that soil properties could be related with grain moisture, we would advise to timing harvest based on the GMC of rice in the cut areas. In this way it may be possible to avoid fissuring after rewetting of rice grains, reducing the risk of obtaining low HR.
Regional scale
Figure 5 (a-f) shows the relationship between GMC at harvest and DD from 50% heading for the two cultivars for each harvest location and year. Each point represents one year for each cultivar. Seeding date of both cultivars at each location was the same in each year; nevertheless, seeding dates were not exactly the same between locations. Despite the fact that they accumulated a highly variable number of DD from 50% heading, when comparing the two varieties in the same location and year (data not shown) both cultivars show little difference in final GMC at harvest. That could suggest that M-206, which has more DD units from 50% heading, has a slower pattern of maturity rate than M-202. Unfortunately we do not have data about the time of the day when harvests were done or the pattern of GMC during the maturation period of the two cultivars. Also, the availability of HR quality from these trials would aid in doing a complete comparison between cultivars in the various years and locations. Regression lines show the expected inverse relationship between DD and GMC in most of the locations; with higher DD, the crop is more mature and reaches harvest with lower GMC. The slope of the regression line fitting the data is greater for M-202 than for M-206, suggesting a more rapid loss of moisture from grains during maturation in M-202 and a slower maturity rate in M-206 as previously mentioned. However, there is a shortcoming of the data presented above: the measured GMC in the variety trials was not monitored before harvest, so we can not be sure that the values of days or DD reported actually represent the first time grains reached the critical 20% GMC threshold. It is possible that in some cases measurements were made after grains had gone through cycles of GMC gain and loss about 20%.
Despite some variability between locations, M-206 always requires more DD than M-202 to reach 20% GMC (Tables 3 and 4). The difference between them is approximately 40 DD (41 DD when pooling the DD data for all locations or 44 DD if analyzing each location separately and then averaging). Spline interpolations of the required DD per variety and location (Table 3) are shown in Figures 6 and 7. Although maps look very similar in their distribution, the ranges differ. Variety M-206 requires more DD to reach 20% GMC than M-202, possibly due to a slower rate of moisture loss. The DD maps show that for both cultivars, more DD are required to reach 20% GMC in Colusa, Butte and Yuba and fewer DD are required at Sutter. Yolo and San Joaquin are in an intermediate position. For each variety, the differences in DD needed to reach 20% GMC per location could be associated with other climatic variables (air humidity, wind, evapotranspiration), or soil properties (associated with water holding capacity or nutrient availability). Average and range in the number of days to reach 20% GMC from 30 days after 50% heading, for each location and cultivar are shown in Table 5. As seen in the previous figures with DD, days to 20% GMC is variable per cultivar and per location; on average, M-206 requires five more days than M-202 to reach 20% GMC, and in both cases the average range between maximum and minimum days is around 10. It would probably be more appropriate to estimate harvest date based on DD rather than number of days, since DD is presumably a more precise descriptor of the grain maturation and drying process. However, due to the similarity of results and its greater simplicity, the use of «days to 20% GMC» is probably a more practical tool.

Conclusions
In summary, different factors were analyzed at the field and region levels, ending with practical results that aid in reducing the risk of loosing HR grain quality at harvest. At the field scale, if periods of dry winds are forecast, harvest rate should be maximized, especially in the case of more mature crops, to prevent losses caused by re-hydration of low GMC rice. One should scout areas of more mature crop and try to harvest a field based on these areas and not on the average field conditions, reducing the risk of quality loss. At the regional scale, the DD approach (DD from 50% heading or from 30 days after 50% heading) appears to be an effective method to predict harvest time, showing regular results between locations and varieties. However, prediction based on days to harvest from 50% heading (or 30 days after 50% heading) based on DD calculations follow the same tendencies as DD and is a more practical approach to predicting harvest date.
Acknowledgements
Thanks to the California Rice Research Board for partially financing this research, the Plant Sciences Department at the University of California, Davis, and INIA Uruguay.
Thanks to Randall Mutters and Ray Wenning for providing data from the Rice Experiment Station (Biggs, CA) variety trials.
References
Brye KR, Slaton NA, Savin MC, Norman RJ, Miller DM. 2003. Short-term effects of land leveling on soil physical properties and microbial biomass. Soil Science Society of America Journal, 67: 1405-1417.
California Rice Research Board. 2008. Cited 2 July 2012. Available from: http://www.syix.com/rrb/index.htm.
Caton B, Foin TC, Gibson KD, Hill JE. 1998 A temperature-based model of direct, water-seeded rice (Oryza sativa) stand establishment in California. Agricultural and Forest Meteorology, 90: 91-102.
Chau N, Kunze O. 1982. Moisture-content variation among harvested rice grains. Transactions of the ASAE, 25: 1037-1040.
Chen F, Kissel DE, West LT, Adkins W, Clark R, Rickman D, Luvall JC. 2004.Field scale mapping of surface soil clay concentration. Precision Agriculture, 5: 7-26.
Counce PA, Keislinf TC, Mitchell AJ. 2000. A uniform, adaptive and objetive system for expressing rice development. Crop Science, 40: 436-443.
Dobermann A, Goovaerts P, Neue HU. 1997. Scale-dependent correlations among soil properties in two tropical lowland rice fields. Soil Science Society of America Journal, 61: 1483-1496.
Dobermann A. 1994. Factors causing field variation of direct-seeded flooded rice. Geoderma, 62: 125-150.
Geng S, Williams JF, Hill JE. 1984. Harvest moisture effects on rice milling quality. California Agriculture, 11-12.
Hill J, Roberts SR, Brandon DM, Scardaci SC, Williams JF, Wick CM, Canevari WM, Weir BL. 1992. Rice production in California. California: Cooperative Extension, University of California, DANR. 24p.
Holloway GE, Siebenmorgen TJ, Counce PA, Lu R. 1995. Causes of multimodal moisture content frequency distribution among rice kernels. Applied Engineering in Agriculture ASAE, 11: 561-565.
Jodari F, Johnson CW, Oster JJ, McKenzie KS, Hill JE, Canevari WM, Greer CA, Mutters RG, Williams JF, Wenning RL. 2004. M-206 Rice: description and management guidelines [On line]. Departament of Agronomy and Range Science. (Agronomy Fact Sheet Series 2004-2) Cited 2 July 2012. Available from: http://cecolusa.ucdavis.edu/files/65324.pdf.
Keisling TC, Wells BR, Davis GL. 1984. Rice management decision aids based upon thermal time base 50ºF. Arkansas : Arkansas Cooperative Extension Services. (Rice Information Sheet ; 1). 7p.
Kocher MF, Siebenmorgen TJ, Norman RJ, Wells BR. 1990. Rice kernel moisture content variation at harvest. Transactions of the ASAE, 33(2): 541-548.
Kunze O, Calderwood DL. 2004. Rough rice drying : Moisture absorption and desorption. In: Rice: chemistry and technology. Champagne E. [Ed.]. St. Paul: AACC. pp. 223-268.
Kunze OR. 1977 Moisture adsorption influences on rice. Journal of food process engineering, 1: 167-181.
Lan Y, Kunze OR 1996. Fissure resistance of rice varieties. Transactions of the ASAE, 12: 365-368.
Marchesi CE. 2006. Spatial variability of rice at the field scale in the Sacramento Valley, California : grain quality and yield response to nitrogen. In: Plant Sciences. Davis : University of California. 80p. .
Roel A, Plant RE. 2004a. Factors underlying yield variability in two California rice fields. Agronomy Journal, 96: 1481-1494.
Roel A, Plant RE. 2004b Spatiotemporal analysis of rice yield variability in two California fields. Agronomy Journal, 96: 77-90.
Siebenmorgen T, Yang W, Bautista R, Cnossen A. 2003. Rough rice drying and milling quality. In: Rice: Origin, History, Technology and Production. Smith CW, Dilday RH. [Eds.] Hoboken : John Wiley & Sons. pp. 567-594.
Siebenmorgen TJ, Counce PA, Lu R, Kocher MF. 1992. Correlation of head rice yield with individual kernel moisture content distribution at harvest. Transactions of the ASAE, 36(6): 1879-1884.
Snyder RL. 2005. DEGDAY worksheet [on line]. University of California. Cited 19 July 2008. Available from: http://biomet.ucdavis.edu/DegreeDays/DegDay.htm
Tanaka K, Kasai Z, Ogawa M. 1993. Physiology of ripening. In: Science of the rice plant. Matsuo T, Kumazawa K, Ishii R, Ishihara K, Hirata H. Tokyo : Food and Agriculture Policy Research Center. pp. 97-118.
Thompson JF, Mutters RG. 2006. Effect of weather and rice moisture at harvest on milling quality of California medium-grain rice. Transactions of the ASABE, 49: 435-440.
Troeh FR, Thompson LM. 1993. Soils and soil fertilty. Oxford : Oxford University Press. 462p.
Yoshida S 1981. Fundamentals of rice crop science. Los Baños: IRRI. 269p.
Zalom F, Goodell PB, Wilson LT, Barnett WW, Bentley WJ. 1983. Degree-Days : The calculation and use of heat units in pest management. Berkeley: UCCE. 10p.

