


Serviços Personalizados
Journal

Artigo
 texto em
  Inglês (pdf)
 Artigo em XML
 Referências do artigo
Links relacionados
Compartilhar

 Permalink
Odontoestomatología
versão impressa ISSN 0797-0374versão On-line ISSN 1688-9339
Odontoestomatología vol.24 no.40 Montevideo dez. 2022 Epub 01-Dez-2022
https://doi.org/10.22592/ode2022n40e221
Research
Quality of care from the user’s perspective. Satisfaction survey of users seen at the School of Dentistry-UdelaR during 2019
1
 http://orcid.org/0000-0002-0745-0739
2
http://orcid.org/0000-0002-2505-4238
1Cátedra de Odontología Social. Facultad de Odontología, Universidad de la República, Uruguay. aleroif1851@gmail.com
2Servicio de Epidemiología y Estadística. Facultad de Odontología, Universidad de la República, Uruguay.
3Servicio de Admisión y registro. Facultad de Odontología, Universidad de la República, Uruguay.
The School of Dentistry of the University of the Republic of Uruguay provides oral health care within the school’s student learning program. The quality of care provided is not assessed.
Objective:
To know the quality of care of the School of Dentistry of the University of the Republic of Uruguay by evaluating the satisfaction of the users seen during 2019.
Methodology:
User satisfaction was studied through the dimensions of structure, process, and outcomes of care. A telephone survey was conducted on a sample of 500 adult users seen in 2019.
Results:
A total of 303 users answered the survey. Of them, 72.6% reported being very satisfied with the care provided, 94.1% would attend the service again, and only 14.2% dropped out of care.
Conclusions:
The quality of care at the School of Dentistry of the University of the Republic of Uruguay is very satisfactory for users. We found excellent ratings in all the dimensions studied and a lower dropout rate than in other studies.
Keywords: patient satisfaction; dental care
La Facultad de Odontología de la Universidad de la República del Uruguay brinda asistencia a la salud bucal asociada a la función de enseñanza de estudiantes. No cuenta con una evaluación de su calidad asistencial.
Objetivo: conocer la calidad asistencial de la FO a través de la evaluación de satisfacción de los usuarios atendidos durante 2019.
Metodología:
La satisfacción se estudió a través de variables relacionadas a las dimensiones de estructura, proceso y resultados de la asistencia. Se realizó una encuesta telefónica a una muestra de 500 usuarios adultos asistidos durante 2019.
Resultados:
303 usuarios contestaron la encuesta. El 72,6% relató estar muy satisfecho con la atención recibida, el 94,1% volvería a atenderse y solo el 14,2% abandonó la asistencia.
Conclusiones:
La calidad asistencial de la FO es muy satisfactoria para los usuarios. Se encontraron muy buenas valoraciones en todas las dimensiones, hallándose un abandono menor al reportado en otros estudios.
Palabras clave: Satisfacción del usuario; atención dental
A Faculdade de Odontologia (FO) da Universidade da República do Uruguai presta assistência à saúde bucal associados à função de ensino dos estudantes. Não há avaliação da qualidade do atendimento.
Objectivo:
conhecer a qualidade do atendimento da FO através da avaliação da satisfação dos usuários atendidos durante o ano de 2019.
Metodologia: A satisfação do usuário foi estudada através de as dimensões da estrutura, processo e resultados dos cuidados. Foi realizada uma pesquisa por telefone sobre uma amostra de 500 usuários adultos assistidos durante 2019.
Resultados:
303 usuários responderam à pesquisa. 72,6% relataram estar muito satisfeitos com atendimento. Apenas 14,2% abandonaram o atendimento e 94,1% retornariam ao atendimento FO.
Conclusões:
A qualidade dos cuidados de saúde na foi muito satisfatória para os usuários. Foram encontrados resultados favoráveis em todas as dimensões, encontrando uma taxa de abandono abaixo do esperado noutros estudos.
Palavras chave: Satisfação do paciente; cuidados dentários
Introduction
Quality care can be defined as care centered on people, families, and communities, with optimal levels of safety, effectiveness, timeliness, efficiency, and equitable access as its essential defining attributes.1,2 From a similar perspective, Donabedian (1973) states that quality care is that which maximizes patient welfare while minimizing risks and at the lowest possible cost.3 This author proposes a “systemic approach” to quality by studying interpersonal relationships, technical relationships, and the physical environment. The author classifies health care into three dimensions: the structure of service, the process of care, and the outcomes of care.4
User satisfaction is one of the potential ways of approaching quality of care. It is determined by elements related to the service, the subjects, and the economic and political model that society undergoes at a given historical moment.5,6 Satisfaction is a multidimensional category where user expectations interact with the resulting outcome or product.7,8 Several methods are used to measure user satisfaction. One of them is surveys, which are used to inquire about the user’s experience in the service, including the dimensions proposed by Donabedian.7
Few studies have attempted to connect user satisfaction with dental treatment adherence or dropout. These studies have found a weak association between dissatisfaction and treatment dropout.9 However, some elements that favor treatment dropout also seem to cause user dissatisfaction, such as cost, waiting times, and interaction with the staff.
Studies report that approximately 30% of patients treated at an oral health service drop out of treatment.10 When patients are asked why they abandon treatment, the main reasons are the cost of services and time issues (waiting time to receive care, duration of treatment and appointments, and travel time to the service). They also mention personal reasons related to anxiety, fear, and negative past experiences.8,10,11
This study was conducted in a program combining teaching and health care. The literature reviewed shows that users are satisfied with the clinics that combine care and teaching. However, waiting time until the first appointment and the appointment duration are often rated as unsatisfactory elements.6,7,12,13
The School of Dentistry of the University of the Republic of Uruguay (FO) is a public higher education institution. It is the leading institution in charge of training students in oral health care. Its mission is to combine education and care. Therefore, it has a public health care service that is freely accessible, but not free of charge, where users receive comprehensive care according to various levels of care.
The FO provides scheduled care (oral rehabilitation) and spontaneous demand care (emergencies and/or extractions) to children and adults. The care is provided by students and only exceptionally by faculty members. Users must pay for the services provided because the institution does not have funds to provide the care.
Currently, as a health care service, the FO does not have a systematic system for assessing or addressing its quality of care. Some background information: a survey was conducted in 2017 within the institutional self-assessment and Mercosur accreditation process. The survey was voluntary and not representative of the service. It was conducted in paper format and included 215 users who sought care at the FO and were in the waiting rooms. The following results stand out: 67% of respondents found the prices reasonable, 87% rated the care provided by students as excellent, and 70% said they were completely satisfied with the outcome of their treatment.14,15
It is essential to understand the quality of care provided at the FO from the user’s perspective to have the necessary tools to develop the institution’s potential to transform. This evolution will improve access to and continuity of care.
That is why this study aims to determine the quality of care by examining the satisfaction of users treated at the FO during 2019, and to describe the phenomenon of treatment dropout.
Methodology
We chose the opinion survey methodology because there are no previous quality of care studies from the user’s perspective, although it is well documented that this methodology overestimates user satisfaction and experience.16
A telephone survey was conducted on a sample of 500 adult users that underwent scheduled care in 2019. Probability sampling and a systematic sampling design (ordered by auxiliary information variables such as “age” and “sex”) were implemented. We used a specific sampling frame with the users meeting the inclusion criteria (over 15 years old who underwent scheduled care at the FO in 2019). The draw was self-weighted using the sampling library.17
The survey was conducted over the phone between January and April 2021. The average duration of each call was eight minutes. After the participant had answered, the researcher explained the project’s objectives and relevance. The user was then invited to participate by requesting their verbal consent. Participants were invited to resume their treatment at the FO if they were interested.
The form included general questions first, such as name, age, highest level of education, and main activity. Then, the questionnaire addressed the structure (waiting room, consultation room, privacy, cleanliness, bathrooms), the process (user-student, user-faculty member, student-faculty member interaction, the cost of the treatment, and difficulty in paying for it, time to be seen, punctuality, and appointment duration), and the outcomes of care (satisfaction with the outcomes, fulfillment of expectations, and satisfaction with the care provided). These questions were structured according to a numerical rating scale from 1 to 6: 1 was very dissatisfied; 2, dissatisfied; 3, neither satisfied nor dissatisfied; 4, satisfied; 5, very satisfied; and 6, don’t know or no opinion.
The “treatment completed” variable was created. Four categories are presented: discharge, dropout, in treatment, and other. For this purpose, two dichotomous “yes” or “no” (or don’t know or no opinion) rating questions were combined: Did you drop out of care? and Are you in treatment?
The “loyalty” variable was covered in the following questions: Would you seek care at the FO again? Would you recommend the FO? Both questions were dichotomous: “yes” or “no” (or don’t know or no opinion). We also included the variables “reason for choosing the FO,” “reason for dropping out,” and “suggestions” in the following questions: Why did you seek care at the FO? Why did you drop out of treatment? Do you have any suggestions? These three questions were open-ended, and the respondent’s answers were recorded. The answers to each question were grouped into categories (described in the Results section) according to similarity.
This research was approved by the FO’s Research Ethics Committee and the school authorities.
Results
Three hundred and three users answered the survey. They were 43 years old on average. The gender distribution was 65% female and 35% male. We had a 39% non-response rate. This rate was studied to detect potential biases but was shown to be random since the gender and age ratios were maintained. Forty-two percent did not answer the phone at any time, 37% were blocked numbers, had their phones off, or could not take calls, and 13% were wrong numbers.
The following distribution was found regarding the highest level of education: incomplete primary education, 2.9%; primary education, 13.5%; incomplete secondary education, 40.6%; secondary education, 17.2%; incomplete higher education, 17.5%; higher education, 8.3%.
Regarding main activity, 55.1% were employed, 18.2% were unemployed, 17.8% were retired or pensioners, 3.6% were neither working nor looking for work, and 5.3% are students.
The variable “reason for choosing the FO” yielded the following results: 34.7% did so because of the cost, 23.4% because a family member or acquaintance invited them, 21.5% received a third-party recommendation, 4.9% were FO students and attended the services as part of the courses, 4.6% had always attended the FO, 3.6% attended because of social media posts, and 7.3% cited other reasons.
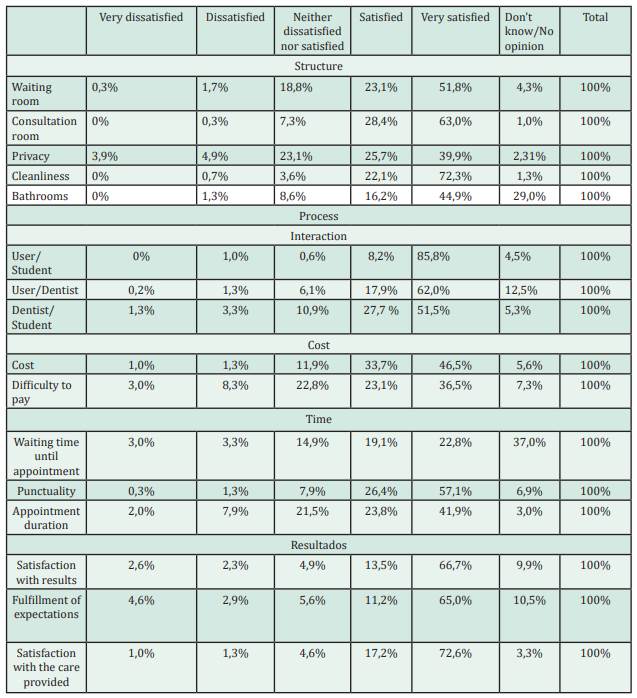
Table 1 summarizes the results of the survey in terms of the structure of the care service, the process, and the outcomes of care.
Table 1: Satisfaction rating on the structure, process, and outcomes of care in a sample of adult users treated at the FO in 2019
The “treatment completed” variable yielded the following results: 14.2% dropped out, 59.4% were discharged, 17.8% were in treatment, and 8.6% fell into the “other” category.
The average age of those who dropped out was 45; 70% were female users and had a 30% greater chance of dropping out than men. We also found that 67% of users who were very dissatisfied with the cost dropped out.
When asked about the reasons for abandonment, 31.4% cited personal reasons such as health problems, difficulty in attending at the scheduled time, and discomfort during the care process. In total, 31.4% reported ending the treatment because of its duration, 21.6% because of the cost, 9.8% because of personal interaction with the staff, 3.9% because of the distance to the FO, and 2% because of fear of care.
When asked if they would return to the FO, 94.1% said yes, 3.6% said no, and 2.3% replied don’t know or no opinion. As to whether they would recommend the service to someone else, 94.7% would, 2.9% would not, and 2.3% had no opinion.
In total, 22.1% made comments and suggestions. The answers were grouped into the following categories: congratulations to the FO for the excellent care provided (29.2%), more faculty members per class are needed (15.4%), very long treatment and/or appointment (15.4%), lower costs (9.2%), improve faculty members’ interaction with students (9.2%), others (21.5%).
Discussion
The response rate (61%) was lower than expected (70%). Thirty-nine percent of the people in the sample could not be surveyed, 42% did not answer, and 8% did not want to (or could not because they were too old) complete the survey. Fifty percent could not be surveyed due to wrong or blocked phone numbers. This might have happened because the number was recorded incorrectly, the user made an unintentional error when sharing their number, or others, such as the person changing their phone number.
This information is important because the service contacts users by phone, and lacking the correct phone number might hinder care. Standardizing telephone number verification and requesting a second contact number when users enter the system could help overcome this difficulty.
Regarding the respondents’ level of education, we found a higher percentage of people who had completed primary, secondary, and higher education than the average Uruguayan population in 2019.18 Additionally, we compared the respondents to the population in the study conducted by Lorenzo-Erro (2020) at the FO. Although the characteristics of the users are similar, our sample seems to have a higher level of education.19 This analysis is of interest because a low social and educational level may obstruct access to and continuity of care.20,21
Regarding the users’ main activity, 18.2% were unemployed, which exceeds the 2019 national unemployment rate: 8.9%. A total of 55.1% of users work, similar to the national employment rate for the same year: 56.7%.22 The ratio of unemployed people is striking, which could hinder the users’ ability to pay but also ensure greater time availability.
Cost ranked first (34.7%) among the reasons that led users to seek assistance at the FO. Next in order of frequency appears the category “acquaintance/relative invite” (23.4%). It includes people seeking care because a relative or acquaintance asked them to do so and they were seen by the same professional. Additionally, 3.6% of users attended the FO after seeing information posted by students on social media. These two facts are relevant because 25% of the people being treated do not access the service through the care service intended for that purpose. The institution does not consider patient recruitment by students and could create access inequalities for users of the institutional channels.
Let us continue analyzing the reasons why users sought care at the FO. We found that 21.5% did so on a recommendation. Recommending a service implies Satisfaction with the care received and great loyalty. A satisfaction survey was conducted in 2018 in the waiting rooms of the FO. A total of 87.8% of participants said they would recommend the care to others.14
Table 1 shows data regarding the structure of the service. It is observed that the bathrooms and privacy received the worst ratings. The 2018 FO survey did not ask about privacy, so there is no benchmark information we can use to make comparisons. However, as this variable was not included on that occasion, this shows that it is not always considered, although users find it valuable. These data agree with other studies, including a similar paper published in Colombia in 2016. This paper reported that privacy had the worst rating within the service structure.8,23
Regarding the care process assessed over time (see Table 1), the worst-rated element was the time elapsed between registering and receiving care, which is in line with the results of other similar studies.7,12 This wait is variable and is unknown to the user at the time of registration, which could pose difficulties since people are uncertain about when they will have the appointment. The people seeking assistance have a health need. Therefore, people need to have this information to evaluate their alternatives.
Table 1 clearly shows that punctuality was satisfactory, similar to what was reported in the 2018 survey as part of the FO institutional accreditation process, where 42.7% stated that the wait was short and 48.8% said it was normal.14 This element could facilitate continuity of care.
A total of 75.3% of users were satisfied or very satisfied with the appointment duration (see Table 1), and most of them stated that they understood that the longer duration was due to the context in which the care was provided but that this did not bother them. These results align with the institutional accreditation report, where 87.9% of users expressed total or moderate agreement with the appointment duration.14
The results shown in Table 1 regarding personal interaction are favorable and indicate high user satisfaction. However, the user-student bond is better perceived than the user-faculty member bond. In this sense, the literature consulted shows that users empathize with the student, collaborating in the teaching-learning process by encouraging them to ask questions and reflect, which may have influenced the high rating awarded to this bond.24
People reported that the cost was satisfactory and significantly lower than the market price. However, this price is not as advantageous when they assess their finances (see Table 1). Similar results were found in the 2018 waiting room survey. Although a different classification was used, it can be interpreted in the same way, as 67.1% found the costs adequate, 18.8% rated them as minimal, and 7% said the costs were high.14
The outcomes of care were ranked very positively in terms of the fulfillment of expectations and satisfaction with the outcomes (see Table 1). Both elements promote quality and continuity of care for the users. Regarding the “treatment completed” variable, 8.6% of the respondents could not identify the current status of their treatment, which shows a lack of knowledge about their health; hence, an aspect to be improved. A total of 17.8% of respondents considered themselves in treatment, a slightly lower figure than the results of a study with similar characteristics: 23.6%.9 We found that 59.4% of people were included in the “discharged” category. In the theoretical exploration, a similar value was found in a University of Antioquia study: 56.4%.9
A total of 14.2% of the participants reported having dropped out of care, a lower figure than expected according to other studies. Blanco (2018) found a 30% dropout rate in users of a free public dental program in Uruguay, while the University of Antioquia study reported a 20% rate.9,10
As for the reasons for dropping out of treatment, 31.4% were related to time, including the length of the appointment and treatment. This agrees with other studies reviewed where time appears as one of the barriers to continuity of care. A total of 21.6% of the people ended their treatment because of its cost. This is not surprising because although the respondents considered the costs satisfactory, 34% considered that paying for the care posed moderate or great difficulties for their household economies. In this sense, the cost of care appears in the literature as one of the major barriers to access to and continuity of care.6,11,25
Conclusions
This survey shows that the quality of the FO service is very satisfactory for adult users treated during 2019 in scheduled care clinics. The cost of the care provided and the time users must wait to be treated were highlighted as weaknesses. The results were favorable in all the categories addressed, and we found a lower dropout rate than expected according to other studies. This confirms the institution’s potential as a health care service and justifies efforts to improve access and achieve continuity of care.
It is well documented that the opinion survey methodology has limitations, such as overestimating user satisfaction and user experience. Therefore, future studies should apply a different design to minimize this bias. It is also necessary to address quality from the perspective of other institutional stakeholders, such as students, faculty members, and staff.
REFERENCES
1. World Health Organization. Estrategia y plan de acción para mejorar la calidad de la atención en la prestacion de servicios de salud 2020-2025. 2020; Available from: https://iris.paho.org/bitstream/handle/10665.2/51621/CD57-12-s.pdf?sequence=2&isAllowed=y [ Links ]
2. Uruguay. Ministerio de Salud Pública. Documento de trabajo para el taller 4 sobre la conceptualización de calidad en el SNIS Contenido [Internet]. Montevideo; 2017. Report No.: 5. Available from: https://www.gub.uy/ministerio-salud-publica/comunicacion/publicaciones/10-anos-del-sistema-nacional-integrado-de-salud [ Links ]
3. Donabedian A. The Quality of Medical Care Methods. Science. 1978;200(26):856-64. [ Links ]
4. Donabedian A. Evaluating the Quality of Medical Care. Milbank Q. 2005;83(4):691-729. [ Links ]
5. Donabedian A. Quality assurance in health care: consumers' role. Qual Health Care 1992;247-51. [ Links ]
6. Agudelo A, Valencia L, Oullón E, Betancur L, Restrepo L, Pelaéz L. Satisfacción y factores asociados en estudiantes usuarios del servicio odontológico de la institución prestadora de servicios de salud "IPS Universitaria". Rev Facultad de Odontología Universidad de Antioquia 2008; 19: 13-23. [ Links ]
7. Ahmady AE, Pakkhesal M, Zafarmand AH, Lando HA. Patient Satisfaction Surveys in Dental School Clinics: A Review and Comparison. J Dent Educ. 2015;79(4):388-93. [ Links ]
8. De Paula Amorim L, Senna MIB, Alencar GP, Rodrigues LG, De Paula JS, Ferreira RC. User satisfaction with public oral health services in the Brazilian unified health system. BMC Oral Health. 2019;19(1):1-9. [ Links ]
9. Lopez-Portilla JE, Pilataxi-Sánchez S, Rodriguez-Escobar LD, Velásquez-Rivera AC, López-Blandón MA, Martinez Delgado CM, Agudelo-Suárez AA. Determinantes de la satisfacción de la atención odontológica en un grupo de pacientes atendidos en la Clínica del Adulto de la Facultad de Odontología de la Universidad de Antioquia. Rev Gerenc y Polit Salud. 2013;12(24):209-25. [ Links ]
10. Blanco S, Toassi RFC, Laurino CG, Abegg C. Abandono de la atención odontológica en programas sociales desde la perspectiva de participantes y operadores sociales: el caso Uruguay Trabaja. Interface - Comun Saúde, Educ. 2019;23:1-15. [ Links ]
11. Alás-Guillén NJ, Arias Rivas DA, Calles Girón SY, Chacón Rico EA. Afluencia Permanencia Y Grado De Satisfacción De Pacientes Adultos De Las Clínicas De La Facultad De Odontologia De La Universidad De El Salvador, Periodo 2010-2014. Tesis de grado. Universidad de El Salvador, 2016. Disponible en: http://ri.ues.edu.sv/13836/1/17100421.pdf [ Links ]
12. Betin Portacio A, Guardela Simancas A, Infante Franco K, Díaz Caballero A. Satisfacción de los pacientes respecto a calidad de la atención odontológica en una institución pública universitaria de la ciudad de Cartagena. Duazary. 2009;6(2):95-101. [ Links ]
13. Hincapié A, Carvajal L, Alejandro L, Arias MAR. Satisfacción de los usuarios frente a la calidad de la atención prestada en el programa de odontología integral del adolescente y ortodoncia. 2001. Rev Fac Odontol Antioquia. 2004;15(2):5-11. [ Links ]
14. Universidad de la República. Facultad de Odontología, Comisión de Acreditación. Encuesta usuarios de la Facultad de Odontología. 2018. [ Links ]
15. Universidad de la República. Facultad de Odontología. Informe autoevaluación 2018 (Internet) 183p. Disponible en: https://odon.edu.uy/sitios/acreditacion/wp-content/uploads/sites/50/2018/05/FORMULARIO-DE-DATOS-2018.pdf [ Links ]
16. Esperidião MA, Viera-da-Silva LM. A satisfação do usuário na avaliação de serviços de saúde: ensaio sobre a imposição de problemática. Saúde em Debate. 2018;42(spe2):331-40. [ Links ]
17. Tillé Y, Matei A. R. Sampling: Survey Sampling (Internet). 2016. Disponible en: https://cran.r-project.org/package=sampling [ Links ]
18. Gómez G, Pereira L, Zoppis D, Orós C, Ascué N, Manber D, et al. Logro y nivel educativo alcanzado por la población. Montevideo: Ministerio de Educación y Cultura, 2018. [ Links ]
19. Lorenzo-Erro SM, Alvarez-Vaz R, Skapino E, Massa F, Moliterno P, Fabruccini A, Massa F, Moliterno P, Vilas B, Piovesan S, Cossetti L, Pisón F, Pesce R, Sanguinetti R, Gardiol M. Salud Bucal y Enfermedades no transmisibles en pacientes de un centro de enseñanza universitaria, Montevideo-Uruguay. Parte 1. Odontoestomatologia. 2020;22(36):55-64. [ Links ]
20. Dho MS. Factores asociados a la utilización de servicios de salud odontológicos. Cienc e Saúde Coletiva. 2018;23(2):509-18. [ Links ]
21. Miranda C, Peres M. Determinantes da utilização de serviços odontológicos entre adultos: Um estudo de base populacional em Florianópolis, Santa Catarina, Brasil. Cad Saúde Públicade Publica. 2013;29(11):2319-32. [ Links ]
22. Uruguay. Instituto Nacional de Estadística (INE). Actividad , Empleo y Desempleo Anual , Cuarto Trimestre y Diciembre 2019. Montevideo; 2020 [ Links ]
23. Moncada ÁMS, Tabares MAC, Sánchez A, Moreno MAG, Arévalo M, Peláez Y. Satisfacción de los pacientes atendidos en Clínica Odontológica de la Universidad Cooperativa de Colombia. Rev Nac Odontol. 2016;12(23):31-40. [ Links ]
24. Fachinetti Lembo V. La singularidad de la enseñanza ante la presencia del otro (paciente) en los espacios de formación pre-profesional del área de salud. Tesis de Maestría. Universidad de la República; 2015. Disponible en: https://www.colibri.udelar.edu.uy/jspui/handle/20.500.12008/4471 [ Links ]
25. Ruiz Rios M. Factores que condicionan la deserción de los pacientes a la atención odontológica en la clínica estomatológica de atención de la Universidad de la Universidad de Huanuco 2017. Tesis de grado. Universidad de Huanuco; 2018. Disponible en: http://repositorio.udh.edu.pe/bitstream/handle/123456789/1152/T_047_72257132-T.pdf?sequence=1&isAllowed=y [ Links ]
Conflict of interest declaration: The authors have no conflict of interest regarding the publication of this paper.
Authorship contribution: 1. Conception and design of study 2. Acquisition of data 3. Data analysis 4. Discussion of results 5. Drafting of the manuscript 6. Approval of the final version of the manuscript. FA has contributed in 1, 2, 3, 4, 5. RA has contributed in 1,3,4,6. AP has contributed in 2,3,6. SB has contributed in 1,3,4,6.
Received: June 14, 2022; Accepted: August 25, 2022
 Este es un artículo publicado en acceso abierto bajo una licencia Creative Commons
