


Serviços Personalizados
Journal

Artigo
 texto em
  Inglês (pdf)
 Artigo em XML
 Referências do artigo
Links relacionados
Compartilhar

 Permalink
Odontoestomatología
versão impressa ISSN 0797-0374versão On-line ISSN 1688-9339
Odontoestomatología vol.24 no.39 Montevideo jun. 2022 Epub 20-Abr-2022
https://doi.org/10.22592/ode2022n39e215
Research
Erosive tooth wear in 5-year-old preschool children from Montevideo-Uruguay: first population study
1
 http://orcid.org/0000-0003-2734-8878
1
http://orcid.org/0000-0003-4546-2404
1Cátedra de Odontopediatría. Facultad de Odontología. Universidad de la República. Uruguay inescaviglia@gmail.com
2Servicio de Epidemiología y Estadística. Cátedra de Odontología Social. Facultad de Odontología. Universidad de la República, Uruguay
Objective:
To assess the prevalence, extent, severity, and distribution of erosive tooth wear (ETW) in preschool children of Montevideo.
Methodology:
Cross-sectional population-based study with a representative sample of public and private educational centers. Sociodemographic, biological, and behavioral aspects were studied through a self-reported questionnaire administered to parents/guardians. The examinations were performed by two examiners (Kappa ≥ 0.7). The ETW was recorded with the modified O’Brien index reported in percentage and average; the confidence interval (CI) was 95%. We analyzed the association between sex and socioeconomic status.
Results:
614 preschool children were examined. Prevalence: 57% (95% CI: 52.7-62.5). ETW extent: 4.8 (95% CI: 4.3-5.3). Severe ETW: 8.2% (95% CI: 5.5-10.9). The most affected areas were the palatal surfaces of the upper incisors. Preschoolers of high socioeconomic status had higher ETW than those of lower socioeconomic status; 73.1% (95% CI: 61.9-84.2) and 48.4% (95% CI: 39.2-57.7), respectively (p≤0,01).
Conclusion:
ETW prevalence and extent were high. These data can contribute in modifying actions that aim to control ETW prevalence.
Keywords: erosive wear; preschool children; cross-sectional studies
Objetivo:
determinar prevalencia, extensión, severidad y distribución del desgaste erosivo (DE) en preescolares de Montevideo.
Metodología:
estudio transversal de base poblacional, muestra representativa de centros educativos públicos y privados. Fueron indagados aspectos sociodemográficos, biológicos y de comportamiento con un cuestionario auto-reportado por padres/responsables. Los exámenes fueron realizados por dos operadores Kappa ≥ 0,7. DE fue registrado con el índice O´Brien modificado, reportándose porcentaje y promedio; intervalo de confianza (IC) 95%. Se realizaron análisis de asociación con sexo y nivel socioeconómico.
Resultados:
se examinaron 614 preescolares. Prevalencia: 57,6% (IC95%: 52,7-62,5). Extensión: 4,8 (IC95%: 4,3-5,3). DE severo: 8,2% (IC95%: 5,5-10,9) Las superficies más afectadas fueron palatino de incisivos superiores. Los preescolares de nivel socioeconómico alto presentaron mayor DE que los de nivel bajo; 73,1% (IC95%:61,9-84,2) y 48,4% (IC95%:39,2-57,7) respectivamente (p≤0,01).
Conclusiones:
la prevalencia y extensión del DE fue alta. Estos datos pueden contribuir en la modificación de medidas que apunten a controlar la prevalencia de DE.
Palabras clave: erosión dental; niños preescolares; estudios transversales
Objetivo:
determinar prevalência, extensão, severidade e distribuição do desgaste erosivo (DE) em pré-escolares de Montevidéu.
Metodologia:
estudo transversal de base populacional, amostra representativa de centros educacionais públicos e privados. Aspetos sociodemográficos, biológicos e comportamentais foram investigados por meio de questionário autorreferência pelos pais/responsáveis. Os exames foram realizados por dois operadores Kappa ≥ 0,7. DE foi registado com o Índice O´Brien modificado, relatando porcentagem e média; intervalo de confiança (IC) 95%. Foi realizada análise de associação com sexo e nível socioeconômico.
Resultados:
614 pré-escolares foram examinados. Prevalência: 57,6% (IC95%: 52,7-62,5). Extensão: 4,8 (IC 95%: 4,3-5,3). DE grave: 8,2% (IC 95%: 5,5-10,9). As superfícies mais afetadas foram palatinas dos incisivos superiores. Pré-escolares de alto nível socioeconômico apresentaram maior DE que os de baixo nível; 73,1% (IC 95%: 61,9-84,2) e 48,4% (IC 95%: 39,2-57,7) respetivamente (p≤0,01).
Conclusões:
a prevalência e extensão da DE foi alta. Esses dados podem contribuir em la modificação de medidas que visam controlar a prevalência de DE.
Palavras-chave: erosão dentária; pré-escolares; estudos transversais
ETW is defined as the progressive and irreversible loss of dental hard tissue caused by a chemical process of acid dissolution that does not involve bacteria.1) It is associated with lifestyle behavioral variables. Its etiology is multifactorial. However, a strong association was found with acids in the oral cavity of extrinsic (consumption of different beverages and food) and intrinsic (gastroesophageal reflux) origin. (2-4)
In recent years, its prevalence has increased in young populations, and it is considered a significant problem for dentists and patients. (5-6 International epidemiological studies in preschoolers and adolescents show highly heterogeneous results. While the prevalence in children aged 3 to 5 reported in China was 5.7% with the O’Brien index,7 the O’Sullivan index yielded an 86% prevalence in children aged 2 to 6 in Japan.8 In Latin America, specifically Brazil, a 51.6% prevalence is reported in children aged 3 to 4 in Diadema, Sao Paulo.4 This large variability in reported prevalence may be due to methodological differences.
Some time-series studies in preschoolers show ETW variation over time. The United Kingdom reported the following prevalence rates: 52% in 1993, 53% in 2003, and 57% in 2013.9-11 This shows a slight 5% relative increase over 20 years. In Brazil,4 constant values remained stable over four years: 51.6%, 53.9%, and 51.3% in 2008, 2010, and 2012. ETW affects over half the population in both countries and shows no sign of decreasing.
Sociocultural factors such as socioeconomic status and maternal education are associated with ETW onset and progression.12 In general, people of low socioeconomic status are at greater risk because they have less access to education and health services and find it more challenging to eat healthy foods. However, the associations with ETW were found to be ambiguous. Some studies have shown that people of high socioeconomic status have a higher ETW prevalence because they have greater access to acidic foods (juice, sweets, candies, energy drinks).13-14 In this sense, a recent study of 12-year-old Montevideo schoolchildren with a 52.9% prevalence (95% CI: 46.0-59.8) agreed with these findings. Children of high socioeconomic status had a 60.4% ETW prevalence (95% CI: 49-71.9), while those of lower socioeconomic status had a 41.2% prevalence (95%CI: 29.0-53.4).15
It is essential to know the prevalence, extent, severity, and distribution of ETW in preschoolers aged 5 to prevent its onset and progression in later life by controlling sequelae that may affect their quality of life.5,16)
Uruguay has no epidemiological data for this age group. This study aims to determine and describe the prevalence, extent, distribution, and severity of ETW in 5-year-old preschool children in Montevideo, Uruguay. It also studies its association with sex and socioeconomic status.
Methodology
A descriptive, cross-sectional, population-based study of ETW in 5-year-old preschoolers from public and private early education centers was conducted in the department of Montevideo from May to November 2017. This work also included other oral conditions such as caries and gingivitis.
Population and sample
The sample size was calculated considering two independent features: public and private preschools. For each component, we considered a 51.3% prevalence,2 a 95% confidence level, a 5% precision level, and a 1.2 design effect. Finally, a 20% non-response rate was added, resulting in a sample size of 1003 children.
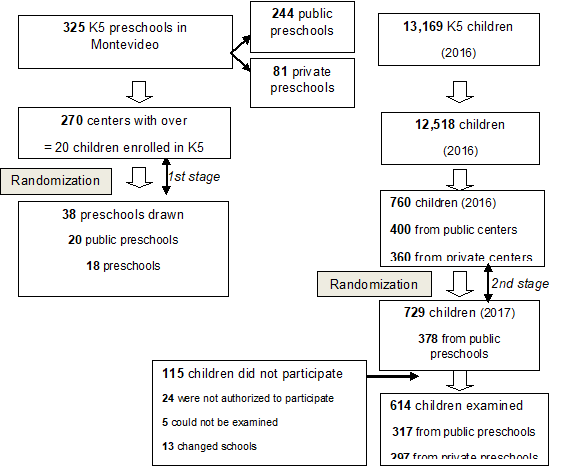
A two-stage stratified probability cluster sampling was designed. The sampling frame for the first stage draw included 270 centers (12,518 K5 preschoolers) according to the 2016 National Public Education Administration (ANEP) records. These centers were selected because they had 20 or more K5 children enrolled per class. The centers drawn for the first stage were 38 preschools—20 public and 18 private centers—with 760 preschoolers—(400 in public centers and 360 in private centers). This reduction in the number of preschools in the original calculation and the centers drawn (schools to be visited) was made to ensure the efficiency of existing logistical and human resources. This changed the accuracy rate slightly to 5.9%.
In a second stage, 20 preschoolers were selected from those enrolled in K5 in each preschool. Five of the educational centers drawn (4 public and 1 private) did not have a minimum of 20 children in 2017, so all the enrolled children were invited to participate. Population examined: n=614 children. (Figure 1).
Ethical issues
This study was approved by the Ethics Committee of the School of Dentistry Universidad de la República (No. 227/16). The children’s parents’ or legal guardians’ consent was obtained.
Information collection
A structured self-report questionnaire was sent to the children’s parents or legal guardians to determine their sociodemographic, medical, and behavioral characteristics and their family’s socioeconomic status. The latter was determined with the simplified Socioeconomic Level Index (INSE). This index is used to classify households according to the educational level and access to health services of the person with the highest household income and the household’s purchasing power. A value between 0 and 100 is obtained; the lowest values correspond to the lowest socioeconomic status. The socioeconomic strata were determined according to the following score ranges: low (0 to 29 points), medium (30 to 51), and high (52 to 100).17
Two operators performed the clinical examinations in a classroom with the children supine. The following materials were used: frontal LED light, a flat mirror without magnification, CPI probe recommended by the World Health Organization (periodontal probe 11.5 B), and disposable materials under current biosafety standards. Dental biofilm was recorded with the Visible Plaque Index.18 After removing biofilm manually with a toothbrush and dental floss, the humidity was controlled with cotton gauze. All the free surfaces of all the teeth present (lingual/palatal, occlusal, and buccal) were recorded according to the modified OʼBrien index.11 Two codes were noted for each surface: depth and area. The recorded depth was always considered. In case of doubt, the code of lesser severity was noted. The surfaces that could not be examined were considered code 9 for depth and area.
The original depth code 3 was modified; pulp exposure was considered by proximity: a thin layer of remaining dentin that sometimes allows the pulp to show through and sometimes shows a slight darkening.2
The O’Brien Index (1993)11) was created to survey children’s oral health in the United Kingdom and is the index used internationally to describe ETW in preschool children. It is a precise index with well-defined classification criteria.
As we needed to report the results according to the BEWE Index, we created a table of equivalences (Table 1) comparing both indices. This made it possible to complement the results with the national study of 12-year-old children. 15) A slight underestimation was observed in modified BEWE code 3 in some lesions classified with O’Brien code 2. Additionally, a lesion with a different defect covering over 50% of the tooth surface would be BEWE code 3 without distinguishing whether it was a pulp or dentin lesion. Both situations are minimized by setting thresholds for ETW prevalence.
Table 1: O’Brien Index and BEWE. Index equivalences
| O’BRIEN | BEWE | ||||
| PROF. | AREA | ||||
| 0 | 0 | Healthy | Healthy | 0 | |
| 1 | 1 | Enamel < 1/3 of the surface | Initial loss of surface texture. Enamel | 1 | |
| 1 | 2 | Enamel > 1/3 but < 2/3 | 1 | ||
| 1 | 3 | Enamel > 2/3 | 1 | ||
| 2 | 1 | Dentin < 1/3 of the surface | Different defect, tissue loss < 50% of the surface | 2 | |
| 2 | 2 | Dentin > than 1/3 but < than 2/3 | 2 | ||
| 2 | 3 | Dentin > than 2/3 of the surface | Different defect, tissue loss > 50% of the surface | 3 | |
| 3 | 1 | Pulp < 1/3 of the surface | Different defect, tissue loss < 50% of the surface | 2 | |
| 3 | 2 | Pulp > 1/3 but < 2/3 | 2 | ||
| 3 | 3 | Pulp > 2/3 of the surface | Different defect, tissue loss > 50% of the surface | 3 | |
Theory sessions with images were implemented for ETW training and calibration conducted by an expert (MB). Cohen’s Kappa reproducibility coefficient for intraoperator O’Brien’s index: depth code - 0.89 (CI), and 0.82 (GG); area code - 0.71 (CI), and 0.60 (GG). The interoperator test yielded a depth of 0.88 and an area value of 0.60, the latter being a weak value. During the survey, 5% of the participants underwent double examinations with a minimum interval of 7 days between the first and second examination, reaching an intraoperator reproducibility for the depth code of 0.95 (CI) and 0.98 (GG), and for the area code, 0.94 (CI) and 0.96 (GG).
Statistical analysis
ETW was considered present when preschoolers had at least one tooth with a value ≥1.1 according to the O’Brien index, while ETW was considered severe when preschoolers had at least one tooth with a value ≥ 2.1. In addition, ETW was measured across the extents; the mean number of affected tooth surfaces was calculated with a ≥1.1 value, and the mean number of affected tooth surfaces was calculated with a value ≥2.1 for severe extents. ETW was determined through the most frequently affected teeth and surfaces, with percentages of enamel and dentin lesions reported for each one (code 1.1 and from code 2.1 onwards). The same criteria were considered for the modified BEWE index following the equivalences in Table 1.
A data sheet with restrictions was designed and frequency tables were created to identify conflicting values and/or outliers to reduce typing errors.
Sample calibration was obtained through initial sampling weights (via a self-weighted design according to whether they were public or private preschools), which were then post-stratified using complementary information. In the private sector, this was done according to sex and geographic region, while in the public sector, according to sex and socioeconomic status. Finally, the sampling weights were adjusted for out-of-date sampling frames and non-responses.
Descriptive data on enamel ETW (O’Brien ≥1.1) and dentin ETW (O’Brien ≥ 2.1) are reported in percentages and averages with a 95% CI. Chi-square and Kruskal-Wallis tests were applied for association analysis. All the analyses were performed with R software. 19
Results
A total of 614 preschoolers were examined with a mean age of 68.9 months (95% CI: 68.4-69.4), and a response rate of 84.5% (81.3% in public schools and 88.1% in private schools). Sociodemographic characteristics of the population: 310 girls (50.5%) and 304 boys (49.5%), 297 (48.4%) from private schools and 317 (51.6%) from public schools.
ETW prevalence on enamel according to the modified O’Brien index was 57.6% (95% CI: 52.7-62.5), 58.4% for females (95% CI: 51.6-65.2), and 56.7% for males (95% CI: 49.6-63.9). This difference was not significant. The children from high socioeconomic status families had significantly higher ETW than children of low socioeconomic status: 73.1% (95%CI: 61.9-84.2) and 48.4% (95% CI: 39.2-57.7), respectively (Table 2).
Table 2: Distribution of ETW prevalence, extent (O’Brien ≥ 1.1), and severity (O’Brien ≥2.1) in preschoolers in Montevideo, Uruguay.
| n | PREVALENCE (%) | CI (95%) | p ᴂ | EXTENSION () | CI (95%) | p Φ | LEVELS (%) | CI (95%) | p ᴂ | ||||
|---|---|---|---|---|---|---|---|---|---|---|---|---|---|
| Sex | |||||||||||||
| Female | 310 | 58.4 | 51.6-65.2 | 0.74 | 4.5 | 3.8-5.2 | 0.46 | 8.5 | 4.6-12.4 | 0.82 | |||
| Male | 304 | 56.7 | 49.6-63.9 | 5.1 | 4.3-5.8 | 7.9 | 4.2-11.6 | ||||||
| Socioeconomic status | |||||||||||||
| Low | 137 | 48.4 | 39.2-57.7 | ≤0.01 | 3.8 | 2.9-4.7 | ≤0.01 | 6.4 | 2.0-10.8 | 0.57 | |||
| Middle | 338 | 60.7 | 54.1-67.3 | 4.9 | 4.3-5.6 | 9.5 | 5.7-13.4 | ||||||
| High | 130 | 73.1 | 61.9-84.2 | 7.8 | 6.2-9.5 | 8.5 | 0.8-16.3 | ||||||
| TOTAL | 614 | 57.6 | 52.7-62.5 | 4.8 | 4.3-5.3 | 8.2 | 5.5-10.9 | ||||||
ᴂChi-square test, Φ Kruskal-Wallis test
The average number of tooth surfaces affected by ETW on enamel was 4.8 (95% CI: 4.3-5.3). In the opposite direction to prevalence, males presented 5.1 surfaces (95% CI): 4.3-5.8) affected, while girls showed 4.5 surfaces affected (95% CI: 3.8-5.2). This difference was not significant. This average was significantly higher in preschoolers of high socioeconomic status than in middle and low levels. This figure doubled among preschoolers of high socioeconomic status: 7.8 (95% CI): 6.2-9.5) compared to those of low status: 3.8 (95% CI: 2.9-4.7).
The severity of dentin ETW was 8.2% (95% CI: 5.5-10.9). It was higher in girls than in boys, as was the prevalence. Severe ETW was higher in middle-class preschoolers than in the other two socioeconomic groups. However, these differences were not statistically significant.
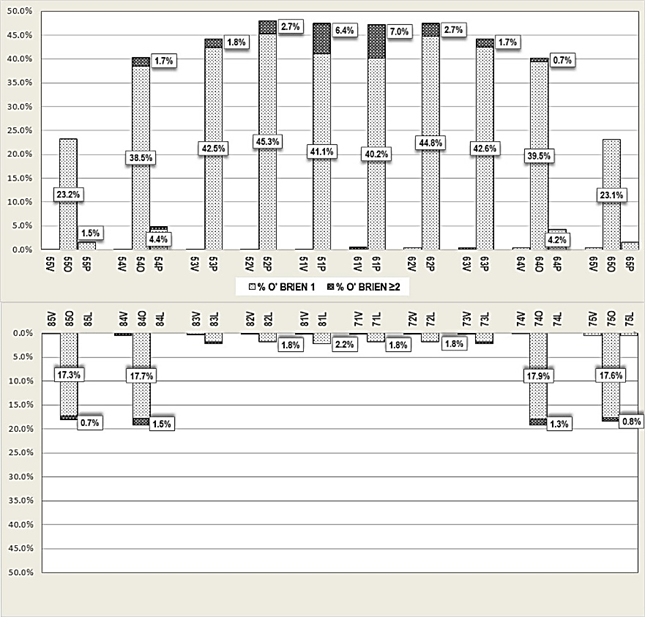
The distribution of lesions showed a higher prevalence in the palatal face of the upper incisors, followed by the palatal face of the upper canines. The ETW ≥1 most affected area was the palatal surface of the right lateral incisor (48.0%), while ETW ≥2 affected the palatal surface of the left central incisor (7.0%) more frequently. In the posterior sector, the most affected area was the occlusal surface of the upper first molars (40.2%), followed by the occlusal surface of the upper second molars (23.0%). Severe ETW was more frequent in the occlusal face of the upper right first molar (1.7%), followed by the lower first molars (1.5% and 1.3%). (Chart 1).
Both indexes yielded the same estimation of prevalence and severity, while there is a slight difference in the extent, so they can be compared directly.
Discussion
This study was the first population-based survey to determine the prevalence and severity of ETW in 5-year-old preschoolers in Montevideo, Uruguay. This population has a high enrollment rate in preschools (94.2%). This enabled us to obtain reliable information about Montevideo’s 5-year-old children.
The O’Brien prevalence of ETW ≥1.1 found in this study was 57.6% (95% CI: 52.7-62.5), while O’Brien ETW severity ≥2.1 was 8.2% (95% CI: 5.5-10.9). This difference between ETW prevalence and severe dentin ETW, as indicated in other reported studies,20,21 may be because the population studied was very young. They probably needed more exposure time to present more severe ETW.
One of the study’s weaknesses is that it did not achieve a Kappa interoperator reproducibility ≥0.70 for the code area in the O’Brien index, a problem reported by other authors as a diagnostic difficulty, mainly in enamel. 22 However, when recording the depth code, the interoperator reproducibility Kappa score was 0.88, and during fieldwork (5% sample), we obtained an intraoperator Kappa score of 0.94 (CI) and 0.96 (GG) for the area. Furthermore, all the estimations for the analysis were reported with the O’Brien index depth code.
We have reported ETW with the O’Brien index, as most studies found for this age group.8,9,23) We also presented the data with the modified BEWE index to have unified national information under the same criteria. Both indexes reported equal estimations since they were used in a modified version, recording all the surfaces (B, P/L, O) of the teeth present. In addition, these estimates were made from enamel ETW (O’Brien ≥1.1 and BEWE ≥1) for prevalence and from dentin ETW (O’Brien≥2.1 and BEWE≥2) for severity, which unified the criteria for both indices. Only a very slight difference was found between the indices in estimating ETW extent (average area affected).
The ETW prevalence found in this study was high, similar to that found in previous studies in the United Kingdom by Chadwick et al.,9 in Brazil by Murakami et al.,2 and more recently in the United Arab Emirates by Vellore et al.24
The distribution of the lesions showed a higher prevalence in the upper incisors on the palatal face, which coincides with the findings of Murakami et al. and Wiegand et al., among others.(4, 25) This is probably because incisors are some of the first teeth to erupt and are exposed to the acidic challenges of the oral cavity for longer. In addition, the palatal face of the teeth accumulates less biofilm, 26 which could protect the enamel by avoiding direct contact between acids and tooth surfaces.14 The lower teeth generally showed less ETW, which could be due to the protective role of saliva and the tongue on the lower occlusal surfaces. 26-27.
In particular, the prevalence on enamel according to the modified O’Brien index was similar to that of the regional study conducted in Brazil by Murakami et al.2 However, as that study was performed in children aged 3-4, we could state that the ETW in this study is less prevalent than in the region.
ETW prevalence and severity according to the BEWE index were higher compared to the values reported in the study of 12-year-old schoolchildren in Montevideo15 52.9% (95% CI:46.0-59.8) and 4.4% (95% CI:2.5-6.6). Preschoolers had 5% more enamel ETW than schoolchildren, while dentin ETW almost doubled that of schoolchildren. If they maintain the same eating habits, we could infer that the children in this study will present higher ETW at age 12 than that found in the schoolchildren surveyed in 2010-2011. This is so because the average per capita spending in Montevideo on food and non-alcoholic beverages increased by 17.6% as reflected in the 2005/2006 and 2016/2017 household expenditures and income surveys.28
Several studies show a higher prevalence in boys than in girls.14,29) Some authors24 say that boys consume more acidic beverages and need 20% more sugar than girls to feel the taste. However, no significant differences in ETW between girls and boys were found in this study, as did Murakami2 in Sao Paulo, among others.24,30 In contrast, the study of 12-year-old schoolchildren in Montevideo found higher ETW in boys (56.1%) than girls (49.5%).15 This may be because the population of this study is very young, and behavioral habits such as diet and physical activity differ with age.
As mentioned above, the literature shows an ambiguous relationship between socioeconomic indicators and ETW. The high prevalence found in this study in children from high socioeconomic status families coincides with authors such as Mangueira14 and the study conducted in Uruguay among 12-year-olds.15
Conclusions
This study was the first population-based study in 5-year-old preschoolers in Montevideo-Uruguay that recorded ETW. ETW prevalence and severity were high: 57.6% (95% CI: 52.7-62.5) and 8.2% (95% CI: 5.5-10.9). On average, five surfaces were affected, and the palatal face of the upper incisors was the most affected surface. Preschool children from high socioeconomic status homes had higher enamel ETW and more affected surfaces than preschool children of medium and low socioeconomic status.
The high ETW prevalence among children and adolescents points to the need for more attention to this pathology in the syllabus of the Doctor of Dental Medicine and Dental Assistant and Hygienist courses. This must be done to implement early control measures that improve ETW’s prognosis and thus avoid affecting adults’ quality of life.
The results obtained in this study are important to implement or modify comprehensive educational actions and early treatments at the population level to change eating habits and decrease ETW prevalence and other pathologies influenced by lifestyle.
Acknowledgments:
To the Sectoral Commission for Scientific Research (CSIC) for funding this study as an early-career project, 2017 call.
To Colgate for donating the toothbrushes and toothpaste given to all the children participating in the study.
To the Graduate School of the School of Dentistry, UDELAR, for the funds granted by the Graduate Academic Committee of the Institutional Support Program for Graduate Studies of Universidad de la República.
REFERENCES
1. Ganss C. Definition of erosion and links to tooth wear. Monogr Oral Sci. 2006;20: 9-16. [ Links ]
2. Murakami C, Oliveira LB, Sheiham A, Nahas Pires Correa MS, Haddad A. E, Bönecker M. Risk Indicators for Erosive Tooth Wear in Brazilian Preschool Children. Caries Res. 2011; 45(2)121-129. [ Links ]
3. Ranjitkar S, Smales RJ, Kaidonis JA. Oral manifestations of gastroesophageal reflux disease. Journal of Gastroenterology and Hepatology. 2012;27(1)21-27. [ Links ]
4. Murakami C, Tello G, Abanto J, Oliveira LB, Bonini GC, Bönecker M. Trends in the prevalence of erosive tooth wear in Brazilian preschool children. Int J of Paed Dent. 2016;26(1):60-5. [ Links ]
5. Schlueter N, Jaeggi T, Lussi A. Is Dental Erosion Really a Problem? Adv Dent Res. 2012;24(2):68-71. [ Links ]
6. Kreulen CM, Van´t Spijker A, Rodriguez JM, Bronkhorst EM, Creugers NHJ Bartlett DW. Systematic review of the prevalence of tooth wear in children and adolescents. Caries Res. 2010; 44:151-9. [ Links ]
7. Luo Y, Zeng XJ, Du MQ, Bedi R. The prevalence of dental erosion in preschool children in China. J Dent. 2005; 33:115-121. [ Links ]
8. Nakane A, Sasaki Y, Miwa Z, Kitasako Y, Tagami J. Prevalence of dental erosion and related factors in the deciduous dentition of Japanese children. Pediatric Dental Journal. 2014; 24:97-105. [ Links ]
9. Chadwick BL, White DA, Morris AJ, Evans D Pitts NB. Non- carious tooth conditions in children in the UK, 2003. Br Dent J. 2006; 200:379-84. [ Links ]
10. Pitts N, Chadwick B, Anderson T. Children's Dental Health Survey 2013. Report 2: Dental Disease and Damage in Children England, Wales and Northern Ireland. Leeds: Health & Social Care Information Centre; 2015 [ Links ]
11. O´Brien M. Children´s dental health in the United Kingdom 1993: Her Majest´s Sationery Office. 1994. [ Links ]
12. Millward A, Shaw L, Smith A. Dental erosion in four-year-old children from differing socio-economic backgrounds. ASDCJ Dent Child. 1994; 61:263-6. [ Links ]
13. Tao DY Hao G, Lu HX, Tian Y, Feng XP. Dental erosion among children aged 3-6 years and its associated factors. Journal of Public Health Dentistry. 2015; 75:291-7. [ Links ]
14. Mangueira DF, Sampaio FC, Oliveira AF. Association between socioeconomic factors and dental erosion in Brazilian schoolchildren. Journal of Public Health Dentistry. 2009;69(4):254-9. [ Links ]
15. Alvarez L, Fabruccini A, Severo L, Alvarez R Maltz M. Erosive Tooth Wear among 12-Year-Old Schoolchildren: A Population-Based Cross-Sectional Study in Montevideo, Uruguay. Caries Res. 2015; 49:216-25. [ Links ]
16. Shaik R. Dental erosion in primary dentition-a review. J Evid Based Med. 2017;4(50):3070-6. [ Links ]
17. Llambí C, Piñeyro L. Índice de Nivel Socioeconómico (INSE). http://www.cinve.org.uy/informesproyectos/indice-de-nivel-socioeconomico-inse/. 2012 [ Links ]
18. Bordoni N. Índices Epidemiológicos para Realizar Diagnóstico de Situación Dental. Preconc, Organ Panam la Salud. 1992. [ Links ]
19. R Foundation for Statistiacl Computing, Vienna AU https://www. R org/). R: A language and environment for statistical computing. (R Core Team 2017). [ Links ]
20. Mantonanaki M, Koletsi-Kounari H, Mamai-Homata E, Papaioannou W. Dental erosion prevalence and associated risk indicators among preschool children in Athens, Greece. Clin Oral Invest. 2013;17(2):585-93. [ Links ]
21. Berg-Beckhoff G, Kutschmann M, Bardehle D. Methodological considerations concerning the development of oral dental erosion indexes: literature survey, validity and reliability. Clin Oral Invest. 2008;12(SUPPL.1):51-8. [ Links ]
22. Taji S, Seow WK. A literature review of dental erosion in children. Aust Dent J. 2010;55(4):358-67. [ Links ]
23. Luo Y, Zeng XJ, Du MQ Bedi R. The prevalence of dental erosion in preschool children in China. J Dent. 2005; 33:115-121. [ Links ]
24. Vellore KG. The prevalence of dental erosion in 5-year-old preschoolers in Sharjah, United Arab Emirates. Eur J Dent. 2016;10(2):215-9. [ Links ]
25. Wiegand A, Müller J, Werner C, Attin T. Prevalence of erosive tooth wear and associated risk factors in 2-7-year-old German kindergarten children. Oral Diseases. 2006;12(2):117-24. [ Links ]
26. Rios D, Magalhaes AC, Honorio HM, Buzalaf MA, Lauris JR. The prevalence of deciduous tooth wear in six-year-old children and its relationship with potential explanatory factors. Oral Health Prev Dent. 2007;5(3):167-71. [ Links ]
27. Richards D. Impact of diet on tooth erosion. Evid Based Dent. 2016;17(2):40. [ Links ]
28. Uruguay. Instituto Nacional de Estadística. Encuesta Nacional de Gastos e Ingresos de los Hogares 2016-2017. https://www.ine.gub.uy/c/document_library/get_file?uuid=3b50400d-c42f-44e7-83a6-339f30798068&groupId=10181. 2017 [ Links ]
29. Gatou T, Mamai-Homata E. Tooth wear in the deciduous dentition of 5-7-year-old children: risk factors. Clin Oral Invest. 2012;16(3):923-33. [ Links ]
30. Raza M, Hashim R. Dental erosion in 5- and 6-year-old school children and associated factors: a pilot study. J Int Dent Med Res. 2012;5(1):36-40. [ Links ]
Conflict of interest declaration: The authors have no conflict of interest regarding the publication of this paper.
Authorship contribution: 1. Conception and design of the study 2. Acquisition of data 3. Data analysis 4. Discussion of results 5. Drafting of the manuscript 6. Approval of the final version of the manuscript ICAL has contributed in 1, 2, 3, 4, 5, and 6. GAGR has contributed in 1, 2, and 6. SMLE has contributed in 5, 6. AFF has contributed in 1, 3, 4, 5, and 6.
Received: July 20, 2021; Accepted: October 12, 2021
 Este es un artículo publicado en acceso abierto bajo una licencia Creative Commons
