Introduction
This paper corresponds to the project “An experience of clinical-epidemiological teaching-research in oral health for university outreach” and it is the first publication of a series of papers that will result from the analysis of the data obtained. This analyzes the global prevalences of some of the variables surveyed, both in Montevideo and outside Montevideo, according to sex.
Given the considerable increase in consultations for Temporomandibular Disorders (TMD) and bruxism in patients attending the School of Dentistry of Universidad de la República in Montevideo, Uruguay, and as there are no data available to measure its importance for the health of the Uruguayan population, it is necessary to have epidemiological data to prove its prevalence.
Mc Neill1) uses the generic term “Temporomandibular Disorders” to describe a heterogeneous group of psycho-physiological disorders with common characteristics of orofacial pain, masticatory dysfunction or both; Okeson 2-3 defines it as pathologies of multifactorial origin where the triggering factors are conditioned by predisposing and perpetuating factors.
Studies conducted in several countries present epidemiological results that show a significant prevalence: symptoms 16% to 59% and signs 33% to 86% for Carlsson G, LeResche4; 30% of symptoms and 44% of signs in a meta-analysis of 51 studies that included 15,000 individuals by De Kanter RJ, Kayser GJ 5; 25% of muscular disorders, 3.3% of discopathies and 4.2% of osteoarthritis for LeResche L, Dworkin SF 6.
We can then say that our country is not an exception in a phenomenon that has become widespread in the world due to the strong change in lifestyles 7. As a consequence, and as it happens in developed countries, chronic-degenerative diseases are the main leading causes of death 8. We could then state that Uruguay has an epidemiological profile similar to that of developed countries.
Therefore, we considered it necessary, from the academic and teaching perspective, to conduct an epidemiological survey at a national level to know the profile of Uruguay in relation to the reference pathologies, supporting the need to make greater emphasis on the contents of the degree to help students achieve the best possible training, and the development of prevention programs, and to make an early diagnosis and develop therapeutic measures within public health policies.
Materials and methods
A descriptive and cross-sectional study was conducted. The sample design is complex and stratified by cluster in several stages, where the final sampling unit is the person (child, adolescent, adult and older adult examined) based on the “Pathfinder” sampling strategy described in the WHO Oral Health Surveys - Basic Methods manual 9. We adapted this material to improve the representativeness of the sample for some sociodemographic characteristics (socioeconomic level and age groups) and according to the relevant pathologies. The method was different in Montevideo than outside Montevideo.
In Montevideo, the strata were selected in the first instance according to the infant mortality rate 10. We considered four geographic areas where the mortality was very low, low, medium and high, which was taken as an indirect indicator of the socioeconomic level (high, medium-high, medium-low and low). In each of the areas, we selected the schools that best represented the stratum, that is, the most homogeneous, according to the recommendations of the Council of Primary Education of Uruguay 11, which classifies the schools in the country according to the following fundamental dimensions: educational level, socioeconomic level and level of social integration of the students' households. We then selected secondary schools (high schools or UTU schools) in each of the areas. In the case of a very low infant mortality area associated with a high socio-economic level, we chose a prestigious high school in the coastal area. The number of individuals in each institution and in each age group varied between 25 and 50 people. We chose the following age groups: 6 to 11 (school age), 12 to 17 (high school age), 18 to 39 (young and young adult) and 40 to 70 (adult and older adult). The sample size in Montevideo was 390 people.
Outside Montevideo, the departments were represented by the departmental capitals and by two clusters larger than 5000 inhabitants in each selected department. To this end, the national territory was divided into four geographical areas: East: Rivera and Cerro Largo; West: Paysandú, Río Negro and Colonia; South: Canelones, San José and Maldonado, and Center: Florida.
Outside Montevideo, we chose the schools according to the aforementioned primary classification, and for adolescents, we selected the departmental high school, which was generally only one. In the areas where there was more than one, we chose the high school in the city center and one in the outskirts. For the other age groups, we included people who belonged to the family group of the children or adolescents surveyed and teaching and non-teaching staff of the educational centers but who belonged to the area (as in Montevideo).
Originally, the proposal was to reach a minimum of 100 individuals per capital and 40 people from each of the two villages of each department. This would result in a total of 1620 people outside Montevideo.
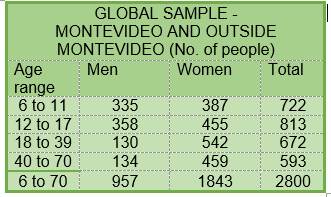
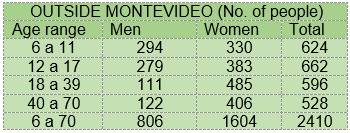
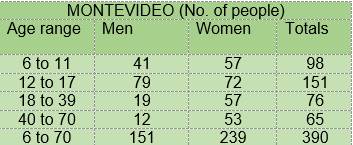
Finally, the total sample was 2800 people (Table 1), 2410 outside Montevideo (Table 2) and 390 in Montevideo. (Table 3)
Once we completed the survey, we analyzed the characteristics of the sample. Given the differences between the composition in age and sex regarding the real composition of the Uruguayan population, we performed a statistical procedure to reweigh the sample, which we explain in the statistical analysis. This procedure ensures the external validity of the data by expanding them to the Uruguayan population.
We used direct observation as a fundamental method and we based the instrument for collecting the clinical data on the epidemiological data sheet proposed in the World Health Organization Basic Methods 1997 manual, with some modifications to adjust the diagnosis. We added the crepitus check, palpation of the joint in search of pain and parafunctional wear facets, and we increased the dimension from 30 mm to 40 mm to consider that the mouth opening was limited. The diagnosis criteria were those established in 1983 at the American Dental Association (ADA) Conference on “Examination, diagnosis and management of temporomandibular disorders”, which also adopts the TMD terminology proposed by Bell in 1982 as consensus 12, which were expanded.
We also administered a questionnaire to evaluate symptoms and risk factors. In particular, the variables studied in the questionnaire were: difficulty or pain when opening the mouth wide, blockage of the jaw when opening the mouth, functional difficulties, joint sounds, pain in or around the ears, trauma, headache, sleep bruxism symptoms: feeling of having been clenching your teeth during sleep, headache when getting up, self-assessment of the patient’s degree of stress, need and/or consultation made for joint problems or symptoms related to bruxism, treatments received, consumption of medications in general, medical treatments the patient was undergoing. Regarding habits: consumption of alcohol, cigarettes, mate, tea or coffee in the last hours of the day. Food habits: daily and weekly consumption of dairy products, fruits, fresh vegetables, cereals and meats. Activities in their free time and physical exercise.
We studied the following clinical variables: mouth opening less than 40 mm, pain on palpation of the muscles, pain on TMJ palpation, clicking, crepitus, parafunctional wear facets.
The clinical examination and questionnaire were conducted by a group of specially calibrated researchers, dentists and teachers from the Department of Rehabilitation, Fixed Prosthodontics and TMD. The questions asked were previously discussed among the group of interviewers with the aforementioned department and the clinical examination was also tested with the subsequent calculation of the percentage of coincidence and Kappa test for the six clinical variables. After five calibration sessions, they obtained an absolute level of agreement: Kappa 1.
We conducted the staff training for the survey, clinical examination and calibration at the School of Dentistry in the Department of Montevideo, supervised by a B.S. in Statistics from the Epidemiology Service of the Social Dentistry Department.
Before the clinical examination and administering the survey, the interviewee or a responsible adult in the case of minors, signed an informed consent which was evaluated and supported by the Research Ethics Committee of the School of Dentistry. At the end of the interview, the interviewer provided some feedback to the interviewee, informing them of the findings and guiding them.
Clinical examination
1- The examiner measured the patient’s maximum mouth opening from the upper incisal edge to the lower incisal edge of the central incisors, adding the value of the vertical crosslinking. It was considered limited when the reading was below 40 mm.
2- To assess the presence of muscle pain, palpation was performed by pressing bilaterally with the index and middle fingers in the most voluminous part of the masseter muscle and anterior portion of the temporal muscle, repeating it twice in each place. It was evaluated as positive when there was an avoidance reflex, which indicates displeasure.
3- To assess the presence of joint pain, the external poles of both TMJs were pressed bilaterally with the index fingers. It was evaluated as positive when there was an avoidance reflex, which indicates displeasure.
4- To examine the presence of an alteration of the condyle-disc complex, we analyzed the existence of reciprocal clicking by identifying an audible noise or by placing the index finger on both joints without applying pressure, while the patient opened and closed the mouth. It was considered positive to perceive a sound or protrusion at any time of the opening and at the end of the closure (differential diagnosis with morphological alterations of joint surface and/or subluxation). In case of doubt, the procedure of point 5 was applied seeking to notice the mandibular angle projections.
5- To evaluate the presence of degenerative alterations, operators analyzed the existence of crepitus. They were located behind the patient with their index and middle fingers in the mandibular angles, pressing upwards and loading the joints while the patient opened and closed the mouth. It was considered positive when a vibrational wave was perceived in the mandibular angle.
6- We considered there was a parafunctional wear facet in the adult when the cusp of upper canines was truncated (in correct canine bites), otherwise the wear in non-functional areas of other teeth, incisors or premolars was evaluated. In children, the incisal edges of incisors and first molars was examined.
Both the survey and the data collection of the clinical examination did not require special equipment, so the research team conducted these activities at the interviewee’s work or study place.
Statistical analysis
-Sample design
To make estimates in a population-based health survey and for the epidemiological analysis be valid in the necessary sample design, we had to control some demographic characteristics, such as: age and sex, since we had to ensure that the prevalence of the clinical variables that were in the sample had the same distribution of the sociodemographic characteristics of the population represented.
We found that the sample made up of 2800 respondents was unbalanced, since Montevideo was under-represented and therefore the area outside Montevideo was over-represented, which is why we considered them as two independent samples. In addition, sex and age distribution in the sample was completely different to the distribution of the general population (the 2004 pre-census report of the National Institute for Statistics was used to compare the information), therefore, post-stratification was used to find the correct sampling weights to allow for expansion and calculation of errors. This ensures that the measurements in our sample correspond to those of the reference population in terms of their characteristics.
The post-stratification technique involves reallocating weights to the observations in order to have the same joint distribution according to certain variables, in this case, sex and age of the population. Regarding age, four strata were formed, which made up a contingency table (double entry) from where we took the frequency of each cell and compared the frequency of the same table made on the sample variables. In an iterative way, we tried to change the sample weights so that the cells in the sample table differed minimally from those of the population. At the beginning of the process, since we had no sample weights, we began by considering uniform weights calculated from  , where N is the number of people in the population and n is the number of people in the sample; then the weights are the inverse of i probability of selection, in this case
  i= 2.920 for Montevideo, that is, each person surveyed represented 2920 of their corresponding age range. As for outside Montevideo, the uniform weights at the beginning were that each person represented 406.85.
Since two samples were used, one from Montevideo and the other one from the rest of the country (considered as only one stratum or population), the sample designs were: a design stratified into four socioeconomic levels for Montevideo and a design stratified into departments.
Taking into account the stratification, we managed to reach the appropriate reweighted sample weights and correct variances calculations and not a simple random design. For the reweighing process, we used the statistical package R as a computing tool13-16. It is public domain, open, multiplatform, developed collaboratively by statisticians from the most important universities in the world, with applications in economics, biology, sociology and psychology, based on libraries (subroutines made by the researchers themselves and made available for the academic community and its improvement) and with a very good graphic capacity.
Results
In this first publication we report univariate tables of 4 of the 18 questions of the questionnaire and 4 of the 6 variables of the clinical examination. They are expressed in tables where three columns appear with percentages corresponding to the global values used to measure symptoms of TMD in the Uruguayan population and the 95% confidence intervals that arise from the application of standard deviation (SD) or Standard Error (SE).
Questions included in the questionnaire:
Do you notice any sounds coming from the mandibular joints?
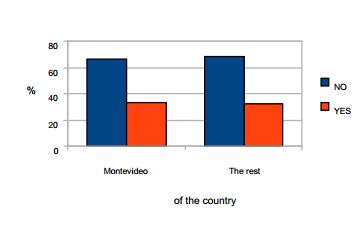
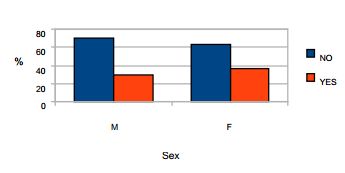
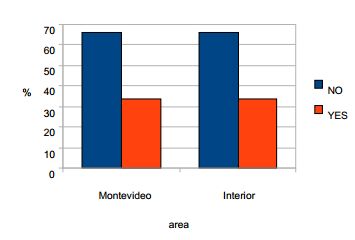
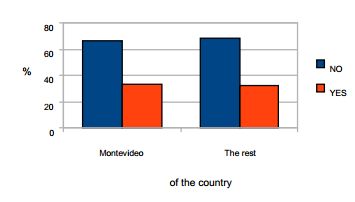
Overall results for Montevideo: 66.44% no and 33.56% yes. By sex: male 70% no and 30% yes, female 63.40% no and 36.60% yes.
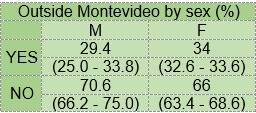
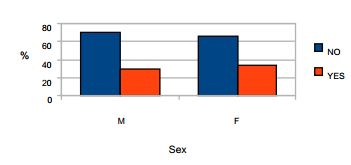
Overall results for outside Montevideo: 68.08% no and 31.72% yes. By sex: male 70.40% no and 29.60% yes, female 65.90% no and 34.10% yes. Tables 4, 5 , 6 and charts 1, 2 and 3
Do you usually have headaches?
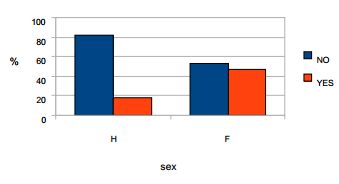
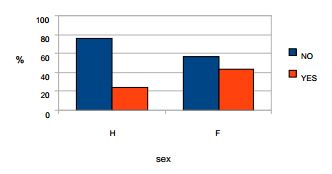
Overall results for Montevideo: 66.10% no and 33.90% yes. By sex: male 81.80% no and 18.20% yes, female 52.90% no and 47.10% yes.
Overall results for outside Montevideo: 65.84% no and 34.16% yes. By sex: male 76.20% no and 23.80% yes, female 56.50% no and 43.50% yes. Tables 7, 8, 9 and charts 4, 5 and 6.
Do you usually get up feeling tired or some pain in the temples or cheeks, or as if you had been clenching your teeth in your sleep?
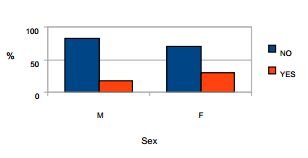
Overall results for Montevideo: 69.28% no and 30.72% yes. By sex: male 76.60% no and 23.40% yes, female 63.10% no and 36.90% yes.
Overall results for outside Montevideo: 76.81% no and 23.19% yes. By sex: male 83.30% no and 16.70% yes, female 70.80% no and 29.20% yes. Tables 10, 11 , 12 and chart 7, 8 and 9.
Table 11: Do you usually get up feeling as if you had been clenching your teeth in your sleep? Montevideo by sex

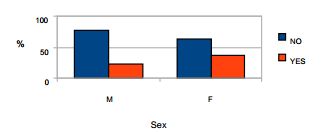
Chart 8: Do you usually get up feeling as if you had been clenching your teeth in your sleep? Montevideo by sex
Table 12: Do you usually get up feeling as if you had been clenching your teeth in your sleep? Outside Montevideo by sex

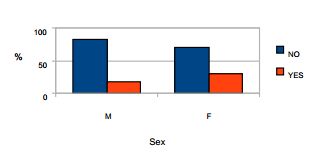
Chart 9: Do you usually get up feeling as if you had been clenching your teeth in your sleep? Outside Montevideo by sex
Do you think that you are usually nervous or under stress?
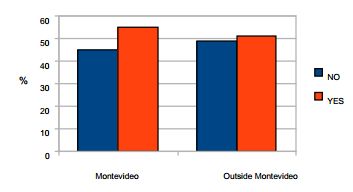
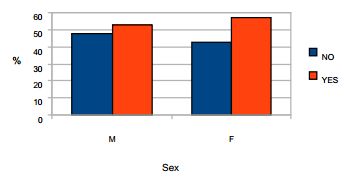
Overall results for Montevideo: 45.04% no and 54.96% yes. By sex: male 47.40% no and 52.60% yes, female 43% no and 57% yes.
Overall results for outside Montevideo: 48.74% no and 51.26% yes. By sex: male 57.50% no and 42.50% yes, female 40.60% no and 59.40% yes. Tables 13, 14 , 15 and chart 10, 11 and 12.
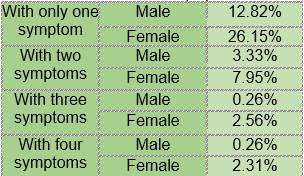
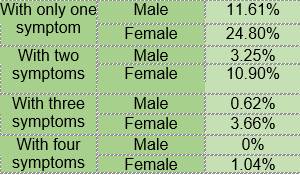
If we analyze the individuals with symptoms (with only one, two, three or four) Table 16 a Montevideo and 16 b Outside Montevideo, when we classify according to sex in both populations, there is a marked difference between sexes, women being the most affected. These are the results:
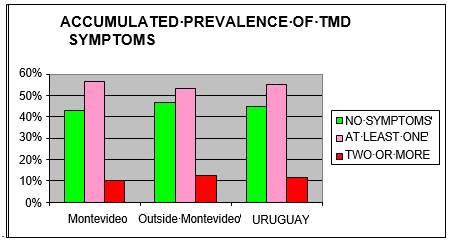
Regarding the percentages of people with no symptoms, with at least one or with two positive responses to the clinical questionnaire applied Table 17, we reached the following results:
The number of individuals with at least one positive symptom indicates a high prevalence of TMD in Uruguay, with a percentage of 55%, being more prevalent in Montevideo (57%) than outside Montevideo (53%) (Chart 13).
CLINICAL EXAMINATION:
Maximum mouth opening less than 40 mm
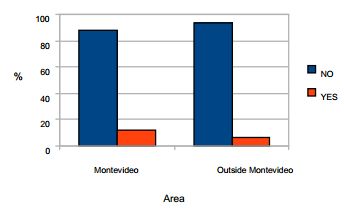
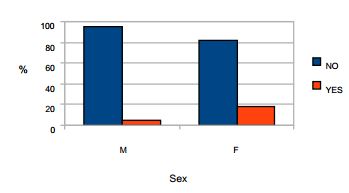
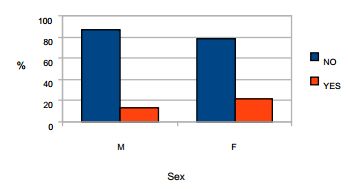
Overall results for Montevideo: 88.31% no and 11.69% yes. By sex: male 95.20% no and 4.80% yes, female 82.40% no and 17.60% yes.
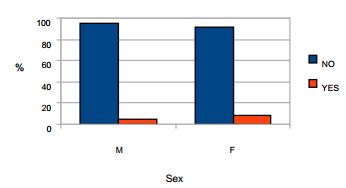
Overall results for outside Montevideo: 93.36% no and 6.64% yes. By sex: male 94.70% no and 5.30% yes, female 92.10% no and 7.90% yes (tables 18, 19 , 20) and charts 14, 15 and 16.
Pain on palpation of the muscles
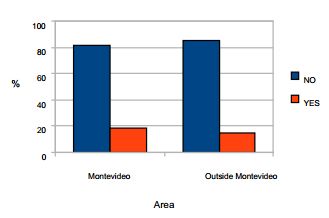
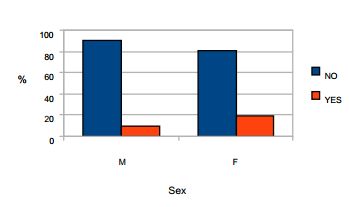
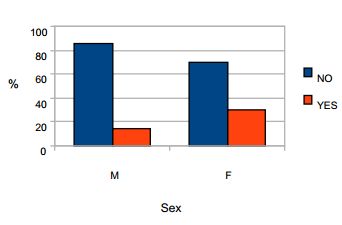
Overall results for Montevideo: 81.87% no and 18.13% yes. By sex: male 86.30% no and 13.70% yes, female 78.10% no and 21.90% yes.
Overall results for outside Montevideo: 85.22% no and 14.78% yes. By sex: male 90.70% no and 9.30% yes, female 80.20% no and 19.80% yes (tables 21, 22 , 23) and chart 17, 18 and 19.
TMJ clicking
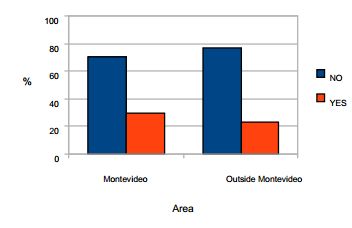
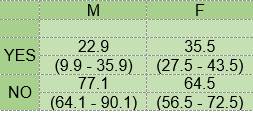
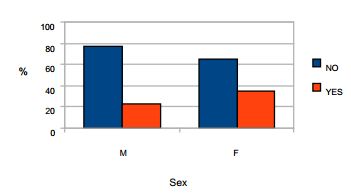
Overall results for Montevideo: 70.23% no and 29.77% yes. By sex: male 77.10% no and 22.90% yes, female 64.50% no and 35.50% yes.
Overall results for outside Montevideo: 76.99% no and 23.01% yes. By sex: male 85% no and 15% yes, female 69.60% no and 30.40% yes (tables 24, 25 , 26),chart 20, 21 and 22.
Parafunctional wear facets
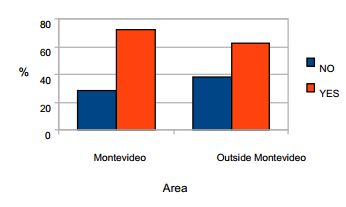
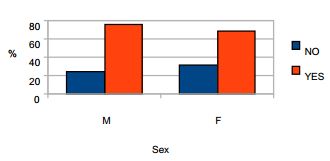
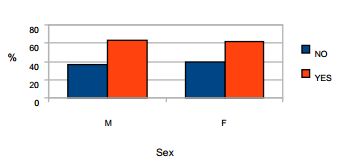
Overall results for Montevideo: 28.05% no and 71.95% yes. By sex: male 24.40% no and 75.60% yes, female 31.10% no and 68.90% yes.
Overall results for outside Montevideo: 37.83% no and 62.17% yes. By sex: male 36.90% no and 63.10% yes, female 38.70% no and 61.30% yes (tables 27, 28 , 29) and charts 23, 24 and 25.
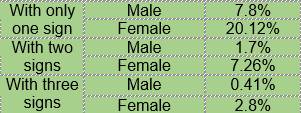
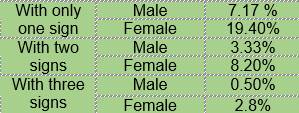
If we now analyze the individuals with signs of TMD (only one, two or three), classifying them according to sex in both populations, we find a marked difference between sexes again, with women being the most affected (tables 30a Montevideo y 30b outside Montevideo). These are the results:
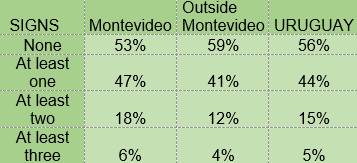
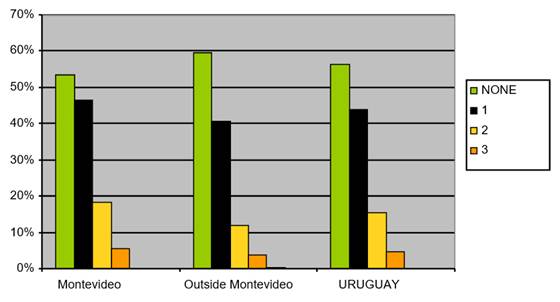
Regarding the percentages of people with no clinical sign of TMD, with at least 1, 2 or the 3 analyzed, Table 31, we found the following results:
The number of individuals with at least one positive clinical sign indicates a high prevalence of TMD in Uruguay, with a percentage of 44%, being more prevalent in Montevideo (47%) than outside Montevideo (41%) (Chart 26).
Discussion
When comparing our results with those published, we find an additional difficulty since there are no studies focusing on populations nationwide in an age range of 6 to 70 years and that classify the information according to sex.
Regarding the question “Do you notice any sounds coming from the mandibular joints?”
Our overall results classified according to population and by sex do not present a statistically significant difference. In agreement with our results, Pow et al. obtained overall results of 29.90%: 30.2% in males and 29.7% in females when classified according to sex. Kamisaka et al.(18 found 45% of TMJ sounds in men and 44% in women. In summary, our results agree with those of the authors mentioned in terms of the non-existence of gender differences in the perception of joint sounds and on the fact that this clinical sign is of high prevalence.
Question: Do you usually have headaches?
We found no statistically significant difference in the overall values between the two populations but a large one between the sexes, both in Montevideo and outside Montevideo, with the female sex being the most affected. Considering the point raised by Diamond in 1987 19 that 80% of the headaches have their origin in the temporomandibular area, we could infer that, according to the statistical results, out of the 34% of headaches in the populations surveyed, 27% could be due to a TMD, and that we should hope that the treatment of muscular hyperactivity leads to a significant decrease in headaches 20-21
Question: Do you usually get up feeling tired or some pain in the temples or cheeks, or as if you had been clenching your teeth in your sleep?
In this variable, high prevalence values were found in both populations, which points to objective data of active bruxism. We found no statistically significant difference in the overall values between Montevideo and outside Montevideo, but a large one between the sexes outside Montevideo, with women being the most affected.
Question: Do you think that you are usually nervous or under stress?
The overall values ranging from 51% to 54%, according to the population surveyed, show a high prevalence of the etiological factor “emotional stress” common to both pathologies 22-26. We found no statistically significant difference between Montevideo and outside Montevideo but a large one between sexes outside Montevideo, women being the most affected.
In the results of the three questions analyzed above, we found a statistically significant difference between genders, women having the highest prevalence of symptoms. In comparison with the published results such as Nilsson’s for a sample of 2255 Swedish adolescents aged between 12 and 19, where a higher prevalence of symptoms was found in females -4.5% in women and 1.3% in men; Johansson, for a sample of 6343 people aged 50, also found a higher prevalence of symptomatology in females: 12.4% in women and 6.7 in men. In the same sense, several authors have shown this higher prevalence in females as in our study.
Regarding the TMD symptoms evaluated and jointly considered, there is an estimated prevalence of between 18% and 47%, which are high or similar percentages compared with results of studies from other countries 26-28.
In the clinical variables:
Maximum mouth opening less than 40 mm
The overall results classified according to population and sex do not show statistically significant differences.
Pain on palpation of the muscles
We found no statistically significant difference in the overall values between Montevideo and outside Montevideo, but a large one between the sexes outside Montevideo, women having the highest prevalence.
TMJ clicking
We found no statistically significant difference in the overall values between Montevideo and outside Montevideo, but a large one between the sexes outside Montevideo, women having the highest prevalence.
Regarding the signs of TMD evaluated and jointly considered, we found an overall prevalence of 44%, with a variation according to the population considered of 41% and 47%, which matched the literature with the percentage of 44% in a meta-analysis of 51 studies that included 15,000 individuals by De Kanter and Kayser 27. In turn, our results are not as high if we compare them with the studies, which show values from 33% to 86% 28.
Parafunctional wear facets
We found a statistically significant difference in the overall values between Montevideo and outside Montevideo, with almost 10% of higher prevalence in Montevideo, but there was no significant difference between sexes in Montevideo and outside Montevideo.
Conclusions
-We found no similar national surveys including a wide range of ages in the literature reviewed.
-This study showed a high prevalence of TMD and Bruxism in Uruguay in the two populations surveyed since the percentages found exceeded 50%. These are pathologies that involve a series of variables that impact the health of the stomatognathic system and the quality of life of the individuals who suffer them.
-The number of individuals with at least one positive TMD symptom indicated a high prevalence in Uruguay, with a percentage of 55%, being more prevalent in Montevideo (57%) than outside Montevideo (53%).
-The number of individuals with at least one positive TMD sign also showed a high prevalence in Uruguay, with a percentage of 44%, it being more prevalent in Montevideo (47%) than outside Montevideo (41%).
-The presence of parafunctional wear facets as an indicator of suffering or having suffered bruxism showed a prevalence in Montevideo of 71.95% and 62.17% outside Montevideo.
-The higher prevalence of signs and symptoms of TMD and parafunctional wear related to bruxism in Montevideo could be related to lifestyles. New studies should review these factors.
-The results obtained before the consultation of feeling of clenching during sleep suggested the prevalence of active bruxism: 30.72% in Montevideo and 23.19% outside Montevideo.
-Considering the prevalence observed and based on our clinical-epidemiological perception of 30 years working on the subject and not having national references, bruxism should be considered a public health problem since it causes severe consequences. While there are interceptive measures, its application is recommended in the case of early detection, thus avoiding the high costs of treatment in advanced stages.
-We confirmed a higher prevalence of both pathologies among women (outside Montevideo in all the variables analyzed and in Montevideo in terms of headaches).
-The lack of statistically significant differences in prevalence by sex in Montevideo could be justified by the sample size. New studies with more representative samples should review these results.


