


 Inglés (pdf)
 Articulo en XML
 Referencias del artículo

 Permalink
Achievement goals are defined as the purpose a person has to participate in an achievement behavior (Elliot et al., 2011). Since its initial conception, different models have been developed on achievement goals: dichotomous, trichotomous, 2 x 2 and, more recently, the 3 × 2 model (Elliot et al., 2011). Based on the 3 × 2 model of achievement goals, Elliot et al. (2011) designed the 3 × 2 Achievement Goal Questionnaire (3 × 2 AGQ) to assess each of the six achievement goals (task-based approach and avoidance, self-based approach and avoidance and other-based approach and avoidance). This instrument was translated and validated into different languages, such as French (Gillet, Lafrenière, Huyghebaert, & Fouquereau, 2015), German (Lüftenegger et al., 2016), Hungarian (Urbán, Orosz, Kerepes, & Jánvári, 2014), Indonesian (Hidayat, Zamri, & Zulnaidi, 2018), Italian (Brondino, Raccanello, & Pasini, 2014), Mandarin (Ning, 2016; Wu, 2012), Norwegian (Diseth, 2015), Philippine (David, 2012), Spanish (Méndez-Giménez, Cecchini-Estrada, Fernández-Río, Mendez-Alonso, & Prieto-Saborit, 2017), and Turkish (Kadıoğlu-Akbulut & Uzuntiryaki-Kondakçı, 2019).
The present work aims to adapt and study the psychometric properties of this instrument for its application among university students in Argentina. Although this would not be the first version of the instrument in Spanish, the versions translated into this language were only adapted either to the context of physical education (Méndez-Giménez, Cecchini-Estrada, & Fernández-Río, 2014) or to the secondary level (Méndez-Giménez et al., 2017) and for use in Spain. Therefore, this adaptation could become a useful tool for motivational research with Argentine university level students.
3 × 2 Model of achievement goals
The goals of the trichotomous models and 2 × 2 of achievement goals overlapped under the mastery label two different standards of evaluation of the development of competence: a goal focused on the task-based and other goal focused on the self-based competence. In this way, these models did not allow to discriminate either theoretically or practically the constitution of these goals, their causes and differential effects. Through the 3 × 2 model of achievement goals, a more complex model was proposed that introduced this distinction and on which Elliot et al. (2011) provided evidence that supported the model.
In the 3 × 2 model of achievement goals, Elliot et al. (2011) propose that there are three basic parameters of evaluation of achievement: those based on the task, those based on the self, and those based on others. First, goals based on the task involve absolute task mastery. Competence refers to performing the task well or poorly. Self-based goals, on the other hand, include the use of the personal trajectory as the reference parameter. The competence is defined in terms of performing the task well or poorly in relation to past and future performances. Finally, the goals based on the others use an interpersonal parameter of evaluation as a reference. The competence is defined in terms of performing the task well or poorly in relation to the others.
To complete the model, Elliot et al. (2011) propose that the three types of goals incorporate the valence of approach and avoidance. Approach goals are described as the search or maintenance of positive results and the adoption of these by the subject evoke and sustain hope, the expectation of positive results (Pekrun, Elliot, & Maier, 2009). Avoidance goals focus on failure and regulate the achievement situation by avoiding negative outcomes. The adoption of these by the subject evokes fear, anxiety, surveillance states and the expectation of poor results.
In summary, the 3 × 2 model is the result of crossing the three parameters used to define the competence with the two types of valence (Elliot et al., 2011). The model would consist of six types of goals: task-approach, task-avoidance, self-approach, self-avoidance, other-approach and other-avoidance. In the basic measurement model, the six achievement goal factors are related to each other, and each item loads in a specific factor.
3 × 2 Achievement Goal Questionnaire
The 3 × 2 Achievement Goal Questionnaire contains three items for each of the six achievement goals (task-based approach and avoidance, self-based approach and avoidance, and other-based approach and avoidance). The questionnaire has an internal consistency ranging from α = .77 to α = .93 for the different scales. Through confirmatory factor analysis, Elliot et al. (2011) provided favorable evidence for a model of six related factors (χ 2 (120, n = 126) = 194.25, p < .01, CFI = .95, TLI = .94, RMSEA = .07) with factor loads between moderate and strong (from .52 to .95). Additionally, the authors provided evidence of test-criterion validity by relating scale scores with temperament, intrinsic motivation, learning effectiveness, concentration in class, energy in class and academic performance.
This questionnaire has been widely used with university students to assess the predictive capacity of achievement goals on achievement emotions and academic performance (Brondino et al., 2014; Lüftenegger et al., 2016), motivation and learning strategies (Diseth, 2015), and online student test-anxiety and help-seeking (Yang, Taylor, & Cao, 2016).
The data from Elliot et al. (2011) and others (Brondino et al., 2014; Diseth, 2015; Lüftenegger et al., 2016; Yang et al., 2016) provide evidence of structural and predictive validity for the 3 × 2 Achievement Goal Questionnaire. Having this adapted instrument would allow to deepen the investigations that, from the 2 × 2 model, analyzed the relationship of achievement goals with self-regulated learning strategies, motivation, achievement emotions and academic performance (Sánchez-Rosas, 2015; Sánchez-Rosas, Aguirre, Bovina-Martijena, & Galarza, 2019; Sánchez-Rosas & Furlan, 2017; Sánchez-Rosas, Lou, Lin, & Larroza, 2017; Sánchez-Rosas & Pérez, 2015), discriminating the differential effects of the task-based and self-based goals.
Three studies presented herein aim to evaluate the equivalence between the original version and the adapted version of the 3 × 2 Achievement Goal Questionnaire (Elliot et al., 2011), analyze the internal consistency of the scales, and provide evidence of the factor structure of the model of six related goals compared with alternative models.
Adaptation of the 3 × 2 AGQ
Method
Participants
Thirty-three bilingual students from the School of Languages of a national university in Argentina (31 women and 2 men) were part of this study (31 women and 2 men).
Instruments
3 × 2 Achievement Goal Questionnaire (Elliot et al., 2011). This instrument has six scales: task-approach (e.g., To get a lot of questions right on the exams in this class), task-avoidance (e.g. To avoid incorrect answers on the exams in this class), self-approach (e.g. To do better on the exams in this class than have done on prior exams of this type), self-avoidance (e.g., To avoid doing worse on the exams in this class than in the case of these types of exams), other-approach ( e.g., To do well compared to others in the class on the exams) and other-avoidance (e.g., To avoid doing worse than other students on the exams in this class). Students respond using a Likert scale ranging from 1 (is not true of me) to 7 (is extremely true of me).
Procedure
A direct translation from English to Spanish was carried out by an official translator, who collaborated with researchers with theoretical knowledge about achievement goals. Special attention was paid to insure each item had a clear, precise and simple formulation, to maintain the original meaning of the construct it intends to measure. Some unusual expressions in Spanish were modified due to the complexity of the items in the original scale (e.g., To perform better on the exams in this class than to have done in the past on these types of exams). Also, it was decided to simplify some items (e.g., perform better in the exams of this subject than I did in the past). Further, the response scale was modified from 7 to 5 points, which is usually easier for Argentine people to interpret when responding. The expression how true is to me was changed by the degree of agreement it has regarding each item since the first expression is uncommon in Argentina. Thus, to answer each item the students used a Likert scale ranging from 1 (not at all agree) to 5 (very strongly agree), expressing the goals pursued when they cope their exams globally, not in a specific subject.
Both the original and the translated versions were administered to the participants. To do this, both questionnaires were sent by email with an interval of two weeks, using the email address to match the responses of both administrations.
Data Analysis
Two complementary procedures were used to analyze the equivalence between the versions of the questionnaire. The total score of the six scales was calculated by adding the individual items of each scale and the correlation between the scores of both versions was analyzed using the Spearman correlation coefficient. Also examined were the differences between the means of both measures by means of the t-test for related samples and Cohen's d effect size (Cohen, 1988).
Results
Table 1 shows the correlations and the differences of means of both versions. The correlation coefficients obtained are moderate and high. When considering the t statistic for related samples, no significant differences were observed between the means of both versions, except for the self-avoidance scale. This scale shows a significant difference but its effect size is weak. In addition, the relationship between both versions of this scale is very high. Taken together, it can be said that the original version and the adapted version were moderately equivalent.
Table 1: Correlations and comparisons between the 3 × 2 AGQ and the 3 × 2 AGQ-AR
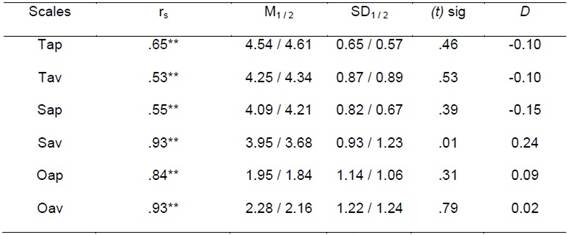
Note: The subscript 1 or 2 indicates original version or adapted version, respectively. ** p < .01. rs = Spearman Coefficient; M = Mean; SD = Standard Deviation; (t) sig = t-test significance; Cohen's d effect size; Tap/Tav = task-approach/task-avoidance, Sap/Sav = self-approach/self-avoidance, Oap/Oav = other-approach/other-avoidance.
Factor Structure and Internal Consistency of the 3 × 2 AGQ-AR
Obtaining evidence on the factor structure and internal consistency of the 3 × 2 AGQ-AR scales was carried out in two successive moments. First, the results showed that it was necessary to improve the writing of the items. Second, and based on this, these modifications were included that allowed us to arrive at the definitive results. The methodological aspects and results are presented integrated below. Finally, in the Discussion section, the changes in the phrasing of the items and the different results obtained are discussed.
Participants
The participants were studying in different academic areas of a national university in Argentina. They were selected by an accidental non-probabilistic sampling. The first sample was composed of 221 students: 46% of the sample was from the school of psychology, 17% from languages and the rest was from the schools of architecture, urbanism and design, arts, agronomy, economics, exact sciences, physical and natural, medical sciences, chemical sciences, law and social sciences, philosophy and humanities, and mathematics, astronomy and physics. The second sample was composed of 195 students who were distributed by academic area in a similar way to the first sample. In both samples, 82% of participants were women, ranging in age from 18 to 55 (M = 25.45 and 25.96; SD = 6.91 and 6.32).
Instruments
The 3 × 2 Achievement Goal Questionnaire (Elliot et al., 2011) previously adapted was used (AGQ-AR). Then, a modified version of the instrument was used, to which some modifications were made in the formulation of the items that are discussed later. The students responded to each item using a Likert-type scale that ranges from 1 (Totally disagree) to 5 (Totally agree).
Procedure
In both studies, the instrument was administered through the online survey system LimeSurvey along with a personal data section related to demographic data including age, sex, and academic area. Students were guaranteed anonymity and confidentiality in the processing of data.
Data Analysis
The data collected were analyzed through the statistical program LISREL 8.8 (Jöreskog & Sörbom, 2007). Before proceeding with the main statistical analyzes, compliance with the statistical assumptions were explored. The percentage of cases with missing values in each item was null. Univariate and multivariate normality was calculated using the asymmetry and kurtosis indices, waiting for values < 1.5 to be considered adequate and using the Mardia multivariate coefficient which showed acceptable values lower than 70. The linearity of the variables was checked visually in the scatter diagrams since for all pairs of items the points of the scatter diagrams were organized along a straight line. The absence of multi-collinearity between the items was verified, since very high correlation values (Pearson r coefficient) were not observed between items > .90. No z scores = ± 3.27 were found that could be considered univariate atypical cases. To identify multivariate atypical cases, the Mahalanobis distance statistic (D²) and the t distribution were used to determine their statistical significance. Less than five cases were found in each sample that exceeded the established threshold of p < .001. These cases were not eliminated since their presence or absence did not produce changes in the results.
To examine the internal consistency, the alpha and the omega coefficients of each scale were calculated, interpreting the results with the following criteria: .70 acceptable, .80 good, and .90 excellent (George & Mallery, 2010; Ventura-León & Caycho-Rodríguez, 2017). In addition, to compare internal consistency between the dimensions obtained in Elliot´s study and in the current research, the AlphaTest software was employed (Merino & Lautenschlager, 2003). The Cohen´s (1988) coefficient (q) was estimated to calculate the effect size between coefficients. Values were interpreted as null effect (< .10), small effect (.10 to .30), moderate (.31 to .50) and high (> .51).
To analyze the factor structure, the polychoric correlation matrices and the robust maximum likelihood method (Cai & Moustaki, 2018) where used, and different fit indexes were obtained. Specifically, we obtained the Satorra-Bentler chi-square statistic (S-B χ 2 ), the Comparative Fit Index (CFI), Standardized Root Mean Square Residual (SRMR) and the Root Mean Square Error of Approximation (RMSEA). The following criteria were used to evaluate the suitability of the model fit: S-B χ 2 /df ≤ 2.0 (Hair, Anderson, Tatham, & Black, 1999), CFI ≥ .90 (Hu & Bentler, 1998), RMSEA ≤ 0.06 (Arias, 2008). Additionally, a 95% confidence interval for RMSEA was used. Besides, the parsimony of the model was interpreted through the CAIC model and CAIC independent indices, where higher differences between them are indicators of best parsimony (Hooper, Coughlan, & Mullen, 2008).
As in the original study from Elliot et al. (2011) and others (David, 2012; Kadıoğlu-Akbulut & Uzuntiryaki-Kondakçı, 2019; Lüftenegger et al., 2016; Méndez-Giménez et al., 2017; Ning, 2016; Wu, 2012), additional analyzes were conducted to compare the fit of the hypothesized model with a series of ten alternative models. Ten alternative models were tested: (a) a 2 × 2 model, in which the other-based goals load on their hypothesized latent factors, but the like-valued task-based and self-based goals load together on joint latent factors; (b) a Trichotomous model, in which the other-based goals load together on their hypothesized latent factors, but the task-based and self-based goals load together on a joint latent factor; (c) a Dichotomous model, in which the other-based goals load together on a joint latent factor and the task-based and self-based goals load together on another joint latent factor; (d) a Tap/Tav (task-approach / task-avoidance) model, in which all items load on their hypothesized latent factors, except the task-approach and task-avoidance items load together on a joint latent factor; (e) a Sap/Sav (self-approach / self-avoidance) model, in which all items load on their hypothesized latent factors, except the self-approach and self-avoidance items load together on a joint latent factor; (f) an Oap/Oav (other-approach / other-avoidance) model, in which all items load on their hypothesized latent factors, except the other-approach and other-avoidance items load together on a joint latent factor; (g) an Approach model, in which all avoidance-based items load on their hypothesized latent factors, but all approach-based items load together on a joint latent factor; (h) an Avoidance model, in which all approach-based items load on their hypothesized latent factors, but all avoidance-based items load together on a joint latent factor; (i) a Definition model, in which all items sharing a competence definition load together on joint latent factors; and (j) a Valence model, in which all items with a shared valence load together on joint latent factors. We used the Satorra-Bentler chi-square difference value (ΔS-Bχ2), the Consistent Akaike Information Criterion (CAIC) to compare the hypothesized model with the alternative models. A chi-square difference value for an alternative model that is significantly larger than zero indicates that the alternative model provides a worse fit to the data than the hypothesized model; lower AIC values indicate better fit.
Results
Descriptive statistics of the items of the 3 × 2 AGQ-AR
Once the adequacy of the data collected was reviewed, the descriptive statistics of mean and standard deviation were calculated (Table 2). Before and after making changes in the phrasing of the items, the asymmetry and kurtosis indices of each items showed adequate values of asymmetry and kurtosis (< 1.5, George & Mallery, 2010). In table 2, in addition to the descriptive statistics, the final version of the items is shown.
Table 2: Descriptive statistics of the 3 × 2 AGQ-AR
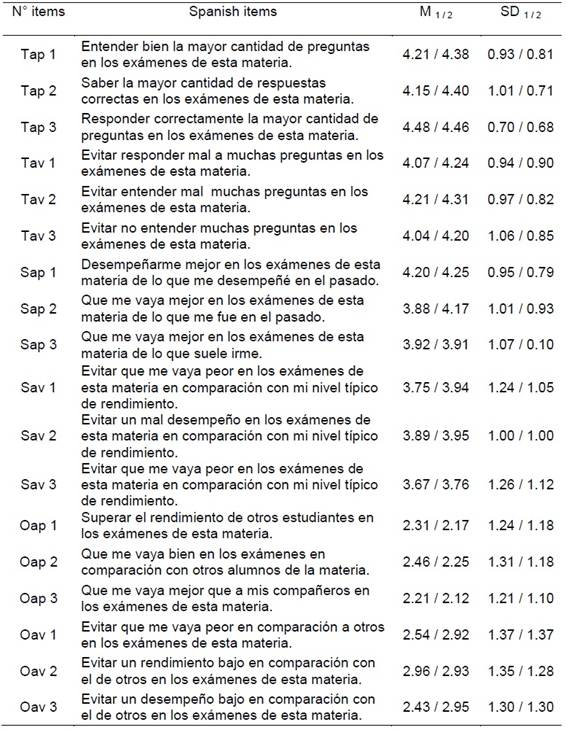
Note: Subscripts 1 or 2 indicate that the results are before or after the changes in the phrasing of the items. M = Mean, SD = Standard Deviation; Tap / Tav = task-approach / task-avoidance, Sap / Sav = self-approach / self-avoidance, Oap / Oav = other-approach / other-avoidance.
Before estimating internal consistency, correlations between items belonging to each scale were inspected. Some correlations were found that affected consistency and internal structure. For this reason, changes were made in the writing of the items and their consequences compared. Before making changes, the task-approach, task-avoidance, self-approach, self-avoidance items showed low, medium and high correlation values, while the other-approach and other-avoidance items showed high correlations. Once changes were made, all the items of each scale showed high correlations with each other and lower with the items of other scales.
Internal consistency of the 3 × 2 AGQ-AR
Table 3 shows the values of the coefficients ω and α for each scale, which were satisfactory for most of the scales before modifying the wording of the items. Nonetheless, task-approach, task-avoidance and self-approach scales did not show acceptable values of internal consistency for the coefficient α. Furthermore, the self-approach scale did not show an acceptable value for the coefficient. Instead, it can be corroborated that the changes made in the formulation of the items produced good and excellent values of internal consistency.
Them, internal consistency of dimensions between the original research by Elliot and the current study were compared. Alpha coefficients and the confidence intervals (IC 95%) were employed, considering, the original research. Results did not register significant differences, except for the other-avoidance scale whose effect size was small.
Table 3: Internal consistency of the scales of the 3 × 2 AGQ-AR
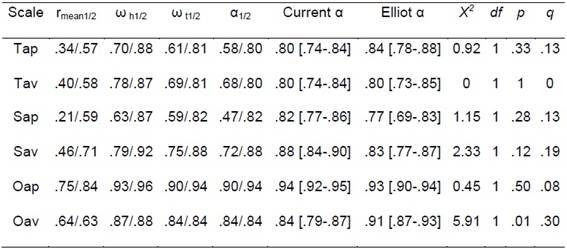
Note: Subscripts 1 or 2 indicate that the results are before or after the changes in the phrasing of the items. rmean = inter-item correlations; α = Cronbach's α, ωh/T = Omega hierarchical /Total coefficients; Tap / Tav = task-approach / task-avoidance, Sap / Sav = self-approach / self-avoidance, Oap / Oav = other-approach / other-avoidance.
Factorial structure of the 3 × 2 AGQ-AR
The results obtained through the confirmatory factor analysis partially support the proposed model: S-B χ 2 (120, n = 221) = 253.99, p < .01, CFI = .97, RMSEA (IC 95%) = 0.07 (0.05-0.08). The standardized regression coefficients (.28 to .97) and the correlations between the factors (.14 to .94) were low to high. The results obtained from a new estimate, after modifying the wording of the items, supported the proposed model with adequate adjustment values (S-B χ 2 /df = 1.39, p < .001, CFI = .99, RMSEA (IC 95) = 0.04 (0.02-0.06)), with standardized factor loads of .70 to .96 and correlations between the factors of .06 to .92.
On the other hand, Table 4 shows the fit of the models estimated here and those of the study by Elliot et al. (2011).
Table 4: Comparison of CFA results of the AGQ-AR
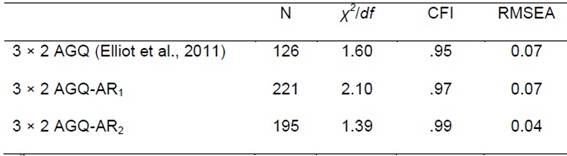
Note: χ 2 /df =chi-square degree of freedom ratio; CFI = Comparative Fit index; RMSEA = root-mean-square error of approximation. Subscripts 1 or 2 indicate that the results are before or after the changes in the phrasing of the items.
Finally, as can be seen in Table 5, the model comparisons indicated that the hypothesized model provided a better fit to the data than any of the alternative models.
Table 5: Comparison of the 3 × 2 model with alternative models
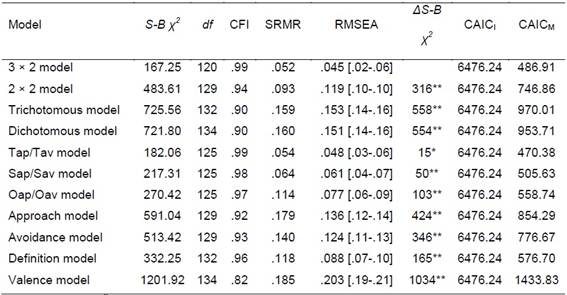
Note: S-B χ 2 = Satorra-Bentler chi-square statistic, df =degree of freedom, CFI = Comparative Fit index; SRMR = standardized root mean square residual, RMSEA = root-mean-square error of approximation; Δ S-B χ 2 = S-B χ 2 difference value; CAICI = Independence CAIC; CAICM = Model CAIC; Tap/Tav = task-approach/task-avoidance, Sap/Sav = self-approach/self-avoidance, Oap/Oav = other-approach/other-avoidance. ** p < .01, * p < .05.
Discussion
In this research we sought to evaluate the equivalence between the original version and the adapted version of the 3 × 2 Achievement Goal Questionnaire (Elliot et al., 2011), analyze the internal consistency of the scales and provide evidence of the factor structure of the model of six related goals compared with other alternative models. The results of the equivalence analysis between the original version and the adapted version affirm that a version equivalent to the original version was obtained. In addition, the internal consistency of the scales is satisfactory and similar to that reported by Elliot et al. (2011). Finally, as evidenced in multiple studies (Diseth, 2015; Gillet et al., 2015; Méndez-Giménez et al., 2017; Urbán et al., 2014; Wu, 2012), the validity of a model of six achievement goals and its superiority when compared with other rival models was ratified.
As mentioned, the correlations and mean differences between the original version and the adapted version allow us to affirm that these are moderately equivalent. Given these results, it was decided to continue with the analysis of the psychometric properties of the instrument. The translation by an official translator was considered to be an additional aspect of reliability. However, we know that some other factors could have diminished our results: the complexity of the instrument, the inability to answer questions during the evaluation due to the type of administration and the simplification of the items to make them more accessible to our sample. The implications that these differences may have on subsequent results were considered by comparing the psychometric properties of the adapted instrument with those of the original.
The results of the first analysis of internal consistency and factor structure of the instrument were partially satisfactory. The model tested in the CFA was partially verified. The RMSEA and the S-B χ 2 /df indices registered values above the recommended 0.06 and 2.0 (Arias, 2008; Hair et al., 1999), respectively. Besides, the internal consistency values of the task-approach, task-avoidance, and self-approach scales did not reach appropriate alphas values (.58, .68, and .47, respectively), while the remaining scales showed satisfactory results. Omega coefficients, on the other hand, only register one low value in the self-approach dimension. Probably, the formulation of the items could have had a negative impact on these results.
When inspecting the correlations between pairs of items, it was possible to find some indications that guided the process of changes in the wording of the items. In the scale of task-based approach goals it could be observed that item 2 had low correlations with items 1 and 3 (r = .23 and .37, respectively). Based on these data, the writing of this item was revised and a difference was found with the other items that make up the scale. Compared with the other items, it could be observed that item 2 was the only one that did not refer to the number of questions or answers that should be known, understood or answered in an exam. Item 1: understand the greatest number of questions in exams of this subject; Item 2: know the correct answers to the questions in the exams of this subject; Item 3: correctly answer the largest number of questions in the exams of this subject. This difference could introduce an inconsistency with the other items, which could justify the low correlation between them.
This same difference in the formulation was detected in the scale of avoidance goals based on the task, where item 1 showed a low correlation with the other items (r = .29 with item 2 and r = .31 with item 3). Then, this difference could be verified in terms of the number of questions or answers on that scale. Item 1: avoid incorrect answers in the exams of this subject; Item 2: avoid misunderstanding many questions in the exams of this subject; Item 3: avoid not understanding many questions in the exams of this subject.
Regarding the scale of self-approach goals, item 2 had a low correlation with the other items (r = .03 with item 1 and r = .16 with item 3). Item 2 was the only one that referred to maintaining a performance in the exams compared to previous exams, unlike items 1 and 3 that referred to overcoming the performance that was obtained in the past. Item 1: perform better in the exams of this subject than I did in the past; Item 2: that I am doing as well in the exams of this subject as I did in the past; Item 3: I will do better in the exams of this subject than I usually do.
On the other hand, as a result of the confirmatory factor analysis, a partially good fit of the proposed model was observed that could be attributed to the correlations among the items. A detailed inspection of the data revealed that some items had a lower correlation with the items of the same factor than with other items belonging to different factors. For example, items 1 and 3 of the self-avoidance scale had a high correlation with items 1 and 3 of the self-approach scale. These correlations were equal to or greater than those maintained with the items on the same scale. Likewise, it was observed that items 1 and 2 of the other-avoidance scale maintained high correlations with items 1, 2 and 3 of the other-approach scale.
Considering the internal consistency values obtained for these scales and the differences identified in the formulation of the items, it was decided to change the wording of the problem items and make a complementary study to improve the internal consistency of the scales. In the same way, to improve the fit of the model, changes were made in the formulation of items 1 and 3, similar to item 2 of the self-avoidance scale. In this way, it was expected to improve the correlation of the items belonging to the self-avoidance scale and decrease its correlation with items of the self-approach scale. Similarly, the formulation of items 1 and 3 of the self-avoidance scale was modified, taking as model item 2 of the same scale.
As reported, the modifications made to items were favorable to increase the internal consistency of the scales (α and ω between .80 and .96). Even the coefficients, measured and compared through alpha, were similar to Elliot et al. (2011). In addition to this, the changes in the writings of the items that presented difficulties were positive and the fit values of the hypothesized model improved. As in many studies (David, 2012; Elliot et al., 2011; Kadıoğlu-Akbulut & Uzuntiryaki-Kondakçı, 2019; Lüftenegger et al., 2016; Méndez-Giménez et al., 2017; Ning, 2016; Wu, 2012), the results show that the 3 x 2 model of achievement goals is more robust than other plausible models.
As limitations of this research, it is worth mentioning the slight difference found in the analysis of equivalence between the original version and the translated version. This latest version could be evaluated in future research through cognitive interviews focused on a more detailed analysis precise of the difficulty of the items and of the proficiency in the English language of the bilingual participants. Additionally, there was no homogeneous sample in terms of gender, which did not allow us to assess whether there is any difference dependent on this variable. A clearly absent aspect is the study of the relationships of each goal with other variables or instruments. Related to this, studies using this instrument and others simultaneously would have a considerable number of items. Therefore, it would be useful to validate a shorter version of the instrument, as has already been done by other researchers (Zhou, Teo, & Hoi, 2020).
This instrument may be incorporated into studies to analyze the relationship of goals with other variables or the effects of interventions aimed at promoting motivation in the educational field (Sánchez-Rosas, Correa, & Díaz, 2019). Thus, for example, with slight adjustments in the instructions, the relationships of goals with the achievement-emotions can be evaluated in other academic situations different from exams, such as the classroom or when studying (Sánchez-Rosas & Furlan, 2017). It could also be analyzed whether certain goals promote or discourage self-regulated learning strategies (Sánchez-Rosas et al., 2019; Sánchez-Rosas & Pérez, 2015).

