


Services on Demand
Journal

Article
 text in
  English (pdf)
 Article in xml format
 Article references
 Curriculum ScienTI
Related links
Share

 Permalink
Ciencias Psicológicas
Print version ISSN 1688-4094On-line version ISSN 1688-4221
Cienc. Psicol. vol.18 no.1 Montevideo 2024 Epub June 01, 2024
https://doi.org/10.22235/cp.v18i1.3109
Original Articles
Sociodemographic variables and prejudices perception from disabled people
1
 http://orcid.org/0000-0002-1240-6740
2
http://orcid.org/0000-0003-2764-4431
1 Centro de Investigación en Alimentación y Desarrollo A.C., México
2 Centro de Investigación en Alimentación y Desarrollo A.C., México, avera@ciad.mx
3 Centro de Investigación en Alimentación y Desarrollo A.C., México
4 Instituto Tecnológico de Sonora, México
People with disabilities face numerous social barriers, including prejudices, defined as hostile and aversive attitudes towards members of a stigmatized group. The prejudice's perception among people with disabilities may be a function of sociodemographic variables, however, only a few studies have deepened such differences in the experience of people with disabilities, especially in the Mexican context. The present study examines the opinions of 5145 people with disabilities through the Encuesta Nacional de Discriminación (ENADIS) 2017 (National Survey about Discrimination) by age, sex, socioeconomic level, location size and the Human Development Index (HDI). The confirmatory factor analysis shows two factors: in-group and out-group prejudices. Results in the comparisons reveal that the elderly, people with low sociodemographic status, and those living in locations with low HDI face higher means of prejudice on the total and in-group scales. The impact of aging and the availability of social services on the perception of prejudice by people with disabilities is discussed.
Keywords: disability; prejudice; discrimination; attitudes; stigma
Entre las barreras sociales que enfrentan las personas con discapacidad se encuentran los prejuicios, definidos como actitudes de aversión y hostilidad por la pertenencia a un grupo al que se le adjudican características indeseables. La percepción de prejuicios puede estar determinada por factores vinculados a variables sociodemográficas; sin embargo, pocos estudios se han enfocado en diferenciar las experiencias de las personas con discapacidad, en especial en el contexto mexicano. Se examinaron las opiniones de 5145 personas con discapacidad, a través de la Encuesta Nacional de Discriminación 2017, comparando la percepción de prejuicios de las personas con discapacidad a través de la edad, el género, el nivel socioeconómico, el tamaño de la localidad y el índice de desarrollo humano (IDH). El análisis factorial confirmatorio arroja una estructura con dos factores: prejuicios endogrupales y exogrupales. Los resultados indican que los adultos mayores, las personas que pertenecen a estratos sociodemográficos bajos y quienes habitan en localidades con un IDH bajo enfrentan mayores prejuicios en la escala total y en prejuicios endogrupales. Se discute el impacto del envejecimiento y la disponibilidad de recursos sociales en la percepción de prejuicios de las personas con discapacidad.
Palabras clave: discapacidad; prejuicios; discriminación; actitudes; estigma
Entre as barreiras sociais enfrentadas pelas pessoas com deficiência estão os preconceitos, definidos como atitudes de aversão e hostilidade por pertencer a um grupo, sob as quais são atribuídas condições indesejáveis. A percepção do preconceito das pessoas com deficiência pode ser determinada por fatores ligados a variáveis sociodemográficas como idade, gênero, nível socioeconômico, tamanho da localidade e Índice de Desenvolvimento Humano (IDH), porém, poucos estudos têm focado em diferenciar as experiências de pessoas com deficiência, especialmente no contexto mexicano. Esta pesquisa analisa as opiniões de 5,145 pessoas com deficiência, por meio da Encuesta Nacional de Discriminación (ENADIS) 2017, usando análise de variância. A análise fatorial confirmatória produz uma estrutura com dois fatores: um endógeno e outro exógeno. Os resultados indicam que idosos, pessoas que vivem em estratos sociodemográficos baixos e que vivem em localidades com baixo IDH enfrentam maior preconceito. Discute-se o impacto do envelhecimento e da disponibilidade de recursos sociais na percepção do preconceito das pessoas com deficiência.
Palavras-chave: deficiência; preconceito; discriminação; atitudes; estigma
Historically, people with disabilities (PD) have been a group excluded from accessing their fundamental rights to actively participate at an economic, social, political and cultural level (Ainscow et al., 2014; Comisión Económica para América Latina y el Caribe, 2021; Instituto Nacional de Estadística y Geografía (INEGI), 2019; Organización Mundial de la Salud (OMS), 2011; Organización de las Naciones Unidas, 2015; Peña & Estay, 2019; Pinilla-Roncancio, 2015). However, in recent years a paradigm shift has taken place, recognizing that disability is not reduced to a condition, illness or personal affectation (physical or psychological), but rather arises in the interaction of the individual with his or her social environment, when there are no sufficient conditions for their full inclusion (García-Vásquez, 2015; Mexico, 2011; Oliver, 1998, 2013; Rembis, 2010; Shakespere, 2006). This paradigm, which is known as the social model of disability, has generated notable progress in terms of civil rights for this group, although physical, social and attitudinal barriers still persist.
In most cases, institutions (e.g. schools, universities, or government buildings) are not prepared to include PD, especially when they come from less economically privileged backgrounds (Cruz & Casillas, 2017; Garín & Suárez, 2016; Pinilla-Roncancio, 2015). The existence of prejudices associated with the abilities of PDs to work, participate in competitive activities and acquire skills, are some of the causes of the invisibility of this group (INEGI, 2016; OMS, 2011; Pinilla-Roncancio, 2015). In this sense, prejudices are defined as attitudes of aversion and hostility towards a person for belonging to a group and/or having a certain characteristic, under which undesirable conditions are assigned to them. Prejudices usually spread in the form of socially accepted and justified opinions about PDs, which ultimately affect their social relationships (INEGI, 2016; Rodríguez, 2006).
The literature on prejudice and group analysis has documented that there is a tendency to favorably rate people who are considered close or familiar compared to those who are perceived as distant or strangers (Allport, 1954; Babik & Gardner, 2021; Harder et al., 2019; Nowicki et al., 2014; Pettigrew, 1979). According to the theory of ultimate attribution error, Pettigrew (1979) points out that the negative attributes of the group of belonging (ingroup) are normally attributed to external, situational and temporary factors, while the negative attributes of external groups (outgroup) are conceived as internal, dispositional and immutable. This implies that the negative evaluations made of PD at a global level tend to be perceived as permanent, immutable and even natural. For their part, according to the stereotype content model, Fiske et al. (2002) postulate that stereotypical beliefs are based on two dimensions: competitiveness (ability to advance in the social hierarchy) and warmth (ability to damage or disturb the status quo). From this theory, the PD group is perceived as warm and uncompetitive, which usually translates into paternalistic and condescending attitudes (Nario-Redmond et al., 2019).
Currently, a distinction is made between classic prejudices, which refer to openly hostile expressions about PD, and modern prejudices, which are manifested in a more subtle way (Akrami et al., 2006; Nario-Redmond et al., 2019). On the other hand, a distinction is also made between explicit prejudices (manifestations over which the person has voluntary control and are those that are typically measured through self-report questionnaires) and implicit prejudices (which are manifested involuntarily or with little control) (Harder et al., 2019; Nario-Redmond et al., 2019). The presuppositions and cognitive biases, as well as the prejudices and discriminatory acts faced by PDs, have been defined as “ableism” (Dunn, 2019; Nario-Redmond, 2020). It is important to note that PDs can also hold prejudices towards their own group, since they tend to internalize discriminatory narratives in their environment (Nario-Redmond et al., 2019).
Although PDs are commonly referred to as a monolithic, homogeneous group, the prejudices they face can vary considerably depending on their individual characteristics, personal history, and social environment (Pinilla-Roncancio, 2015; Rembis, 2010; Rodríguez, 2006). Social and territorial variables directly or indirectly affect the degree of social exclusion of the DPs (Pinilla-Roncancio, 2015). The literature suggests that, among PD, the perception of prejudice is related to contact with others with the same condition, their educational level, gender, ethnic origin, type of disability and age (Alvarez-Galvez & Salvador-Carulla, 2013; Harder et al., 2019).
In relation to gender, the explicit prejudices manifested by PDs vary depending on the measurement method. For example, Harder et al. (2019) concluded that men with disabilities prefer to spend more time with people without disabilities, while other studies suggest that women with disabilities show a greater inclination toward “feeling discriminated against because of their disability” (Branco et al., 2019; Dammeyer & Chapman, 2018). Regarding age, a large percentage of PDs are also older adults (INEGI, 2019; OMS, 2011). However, there is little knowledge about the impact that age has on the perception of prejudice (Ruggieri & Cuesta, 2018). The available evidence seems to indicate that the perception of prejudice among PDs increases significantly as they reach old age (Alvarez-Galvez & Salvador-Carulla, 2013; Branco et al., 2019; Harder et al., 2019).
On the other hand, the prevalence of disability in younger age groups varies internationally from 0.4 % to 12.7 %, depending on the study and the evaluation tool (OMS, 2011). In Mexico, it is estimated that 8.8 % of the population between 5 and 19 years old has some disability (INEGI, 2019). It has been observed that children with disabilities are more likely to present socio-emotional problems, low levels of social integration with their peers and poor attention in schools (Anatolievna, 2020; Rosa & Menezes, 2019; Santa Cruz et al., 2021). When analyzing the situation of the PD according to the size of the locality in which they live, it has been pointed out that in the large cities of Latin America there is no clear strategy regarding the design of public space and accessibility (Linares-García et al., 2018; Rairan et al., 2017), however, the extent to which this may affect PDs’ perception of prejudice remains understudied.
Empirical evidence shows that the most consistent predictions of social achievement are made based on class situation and the residential area where one lives (Rodríguez, 2006). Consequently, the socioeconomic level represents a determining aspect of the self-determination condition of the PD (Álvarez-Aguado et al., 2021; Alvarez-Galvez & Salvador-Carulla, 2013). A considerable percentage of poor people in developing countries are also PD, and households with PD are at higher risk of poverty (Elwan, 1999; Pinilla-Roncancio, 2015). In part, this is explained by the fact that PDs will not achieve the same levels of well-being as a person without disabilities, even if they have comparable economic resources, due to the costs derived from their specific needs, such as therapies or medical treatments, etc. (Pinilla-Roncancio, 2015).
In addition to the above, PDs generally have lower levels of education, lower insertion in the workplace and lower access to health services, factors related to the Human Development Index (HDI). The HDI is an indicator formulated by the United Nations Development Program (UNDP), and represents a synthesis of the status of a given locality based on the analysis of three dimensions: health, education and income (PNUD, 2014). The HDI allows us to appreciate a general overview of the level of inclusion/exclusion in which its inhabitants find themselves in general, and the PD in particular. (Peña & Estay, 2019). The level of human, social and economic development of the place of residence influences the type and quality of opportunities and services available to all members of society, including DPs (Pinilla-Roncancio, 2015). For example, it has been found that PDs with high levels of education (Harder et al., 2019) and who live in countries with more developed health systems (Alvarez-Galvez & Salvador-Carulla, 2013) show a lower perception of prejudice.
According to the social model of disability, the prejudices faced by PDs are related to the barriers found in their social environment. From this perspective, people with similar deficiencies may find themselves in different situations of exclusion, depending on their opportunities to access services such as health, education, employment, etc. On the other hand, the literature indicates that age and gender can also make important differences in the perception of prejudice in PDs. However, there are few studies that examine these differences, especially in the Mexican context. To help fill this gap, the present work answers the following research question: How does the open and hostile expression of internalized prejudices by PDs vary based on personal and social variables? As a hypothesis, the groups that are at greater risk of discrimination and that, therefore, could face greater prejudice are: a) women, b) older adults, c) people of low socio-demographic level and d) people who live in small towns with low rates of human development. To test these hypotheses, the average score of these groups was compared, using variance analysis, based on the responses collected in the National Discrimination Survey 2017 (INEGI, 2018; 2019; 2023) in Mexico.
Method
Sampling
The ENADIS design presented a probabilistic, two-stage, stratified and cluster sampling, taking into account the 32 states of the Mexican Republic, seeking the representativeness of the sample at the national level. In its design, four socio-demographic strata were formed into which all the sampling units of the country were grouped (that is, the homes that were the subject of the study). This stratification considered the socio-demographic characteristics of the inhabitants of the homes, as well as their physical characteristics and equipment, expressed through 34 indicators (INEGI, 2018).
The states were grouped according to their HDI based on data published by the UNDP (2015), which is represented by a score that ranges from 0 to 1, with the world average being 0.700. The calculation of the HDI of a locality was carried out based on the following indicators: life expectancy at birth (health), average years of schooling, expected years of schooling (education) and gross national income (GNI) per capita (income). The classification was done in four levels: eight states were classified as very high HDI, with a score between 0.759 and 0.830 (Baja California Sur, Baja California Norte, Coahuila, Colima, Mexico City, Nuevo León, Querétaro and Sonora), eight were classified as having a high HDI, with a score between 0.743 and 0.758 (Aguascalientes, Campeche, Jalisco, State of Mexico, Morelos, Quintana Roo, Sinaloa and Tamaulipas), eight were classified as medium-low HDI, with a score between 0.721 and 0.742 (Chihuahua, Durango, Hidalgo, Nayarit, San Luis Potosí, Tabasco, Tlaxcala, Yucatán) and finally eight states were located as a low level, with a score between 0.667 and 0.720 (Chiapas, Guanajuato, Guerrero, Michoacán de Ocampo , Oaxaca, Puebla, Veracruz and Zacatecas).
Participants
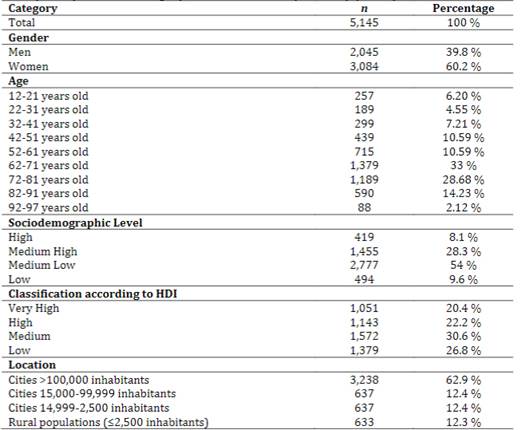
The database with the participants was taken from the official INEGI site (2023), corresponding to the module 2 questionnaire, whose target population is people with disabilities, that is, those who indicated having any of the following characteristics: 1. Difficulties walking, going up or down steps using their legs; 2. Seeing, even when wearing glasses; 3. Moving or using their arms or hands; 4. Learning, remembering or concentrating due to an intellectual condition; 5. Hearing, even when using a hearing aid; 6. Talking or communicating; 7. Bathing, dressing or eating; and 8. Carrying out daily activities due to an emotional or mental condition. The characteristics of the study sample can be seen in Table 1.
Instrument
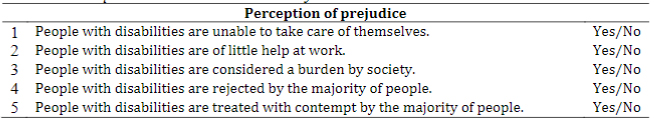
The ENADIS 2017 consists of three instruments (General Questionnaire, Opinions and Experiences Questionnaire, and Module Booklet). Its purpose was to collect basic information about the selected home and the people who make up the household, as well as explore the opinion and experiences of discrimination of the target population (Indigenous people, people with disabilities, religious diversity, older adults, girls and boys, adolescents and young people, women and experiences of discrimination), which is collected from the module booklets. The present work only took up the module 2 booklet, aimed at people with disabilities, recovering the responses of the participants regarding the prejudice section, evaluated through five questions (see Table 2). The selected questions can be characterized as expressions of classic and explicit prejudices towards people with disabilities.
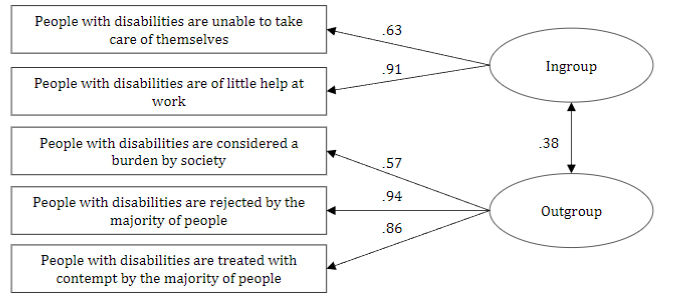
First, the reliability of the scale was evaluated using McDonald’s Omega coefficient, obtaining a reliability index of .75, which is considered acceptable. Next, the construct validity was evaluated through a confirmatory factor analysis (CFA), based on the hypothesis that the five prejudice questions are grouped into a single dimension. The extraction method was diagonal weighted least squares, as it is considered appropriate for dichotomous variables (Cheng-Hsien, 2016). The model was evaluated using the following goodness of fit indices: chi square with associated probability (X², p) greater than .05, general fit index (GFI) greater than .95, root square error of the mean of approximation (RMSEA) with values between .05 and .08, square root mean squared residuals (SRMR) close to 0.05 (Valdés-Cuervo et al., 2019). Given that the goodness-of-fit indices showed unfavorable results, it was decided to test a two-factor solution. The presence of a factor with two items is justified as long as the correlation is high between them and low with the rest, and the interpretability of the factor is maintained (Worthington & Whittaker, 2006). The first factor was named ingroup prejudices, since it represents judgments that the PDs make about their own abilities and was formed by questions 1 and 2. The second factor was named outgroup prejudices, since they represent judgments that the PDs attribute to the society or other people, and was made up of questions 3, 4 and 5. In this case, the correlation between items 1 and 2 (ingroup) was moderate (.57), while with the rest it was low (between .38 to .18). The literature indicates that the X² test can lead to rejecting reasonably appropriate solutions when working with large samples, therefore, upon observing that the rest of the indicators showed a good fit, it was decided to retain the model. The results of both models can be seen in Table 3. The structure of the bifactor model, the standardized covariance between the factors and the explanation coefficients for each of the questions is seen in Figure 1.
Table 3: Goodness-of-fit indices of the unifactor and bifactor models

Note: The extraction method used was diagonal weighted least squares. 1F = unifactor model, 2F = two-factor model.
Procedure
For the present study, the data obtained in the ENADIS 2017, carried out by the INEGI (2016), were used. The interviews were carried out face to face following a protocol, taking place between August 21 and October 13, 2017. The ENADIS 2017 study population was all people in the household with the following characteristics: 12 years or older of age, indigenous speakers or self-identified, 12 years and over with disabilities, 12 years and over belonging to religious diversity, 60 years and over, 9 to 11 years of age, 12 to 29 years of age and women 18 years and older. A total of 39,101 homes participated. The present study returned to the participants who indicated that they belonged to the group of people with disabilities.
To download the database, the authors entered the official site of the INEGI (2023), accessing the Encuestas (Surveys) section, then the Especiales (Specials) section, where finally the Encuesta Nacional de Discriminación (ENADIS), version 2017 (National Discrimination Survey (ENADIS), version 2017) section is located. Once inside this section, the Datos Abiertos (Open Data) section was accessed, where a button to download the database is found. By pressing the download button, a zip file was obtained with the name “conjunto_de_datos_enadis2017_cvs.zip” (enadis2017_dataset_cvs.zip), which in turn contains 14 folders and a CVS file named “0_indice_tablas_enadis2017.cvs” (0_tables_index_enadis2017.cvs). This file indicates the name of the questionnaire that corresponds to each folder. Next, the folder named “tdiscapacidad_enadis2017” (tdisability_enadis2017) was extracted, where there are five more folders: “catalogos” (catalogs), “conjunto_de_datos” (data_set), “diccionario_de_datos” (data_dictionary), “metadatos” (metadata) and “modelo_entidad_relación” (entity_relationship_model).
The database with the responses of the participants in this study was found within the “conjunto_de_datos” (data_set) folder. Once the database was obtained, the modifications that were considered pertinent were made to the names and labels of the variables, resulting in the version that was finally used to perform the statistical analyses. In addition to the above, the participants were grouped by age (in 10-year intervals), and the groups belonging to the different levels of the HDI were created based on the state of the Mexican Republic in which they are located.
Data analysis sequence
First, construct validity was evaluated using the CFA method. Next, the reliability of the scale was evaluated using McDonald’s omega index. Subsequently, the Student’s t test was used to compare the participants by gender and the one-way analysis of variance (One Way ANOVA) was used to compare them by age group, sociodemographic stratum, level of human development and size of the town. It is assumed that the analysis of variance is sufficiently robust when large samples are available (Page et al., 2003). Prior to the analysis, it was verified that the assumption of homogeneity of variance was met, through Levene’s Test. In turn, the effect size and statistical power were calculated (Cárdenas & Arancibia, 2014). On the other hand, Scheffe’s post hoc test was used to visualize the groups between which the difference was established. In the case where the assumption of homogeneity of variance was not met, the ANOVA test with Welch correction and the Games-Howell post hoc test were used. The analyzes were carried out in the Rstudio software version 4.2.0 (R Core Team, 2023), using the packages DescTools (Signorell, 2023), lavaan (Rosseel, 2012), MSchoR (Mair, 2020), psych (Revelle, 2023), RcmdrMisc (Fox & Marquez, 2023) and rsatix (Kassambara, 2023).
Results
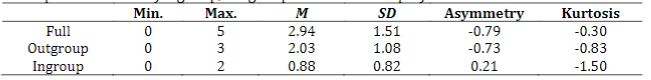
First, descriptive analyzes were carried out with the full prejudice scale, as well as with the outgroup and ingroup prejudice variables. Full scale scores indicate that participants answered “yes” on average to 3 of the 5 statements, suggesting a moderate level of internalized bias about people with disabilities. The outgroup prejudice score is above the theoretical mean, unlike the ingroup prejudice score, which is below. On the other hand, the skewness and kurtosis scores suggest a normal distribution (see Table 4).
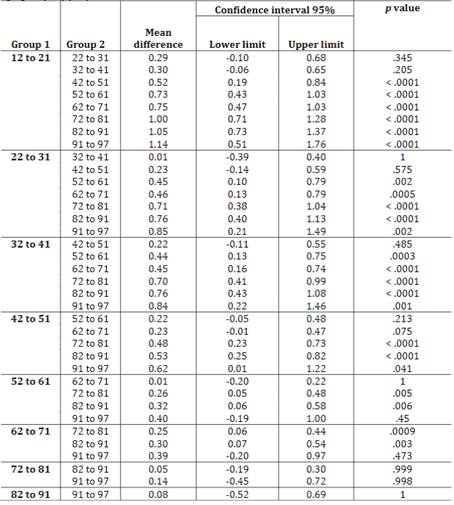
Subsequently, comparisons of means between groups were carried out for the complete scale and outgroup and ingroup prejudices, the results of which are detailed in Table 5. Regarding the results by gender, although significant differences were obtained both in the complete scale, as in outgroup and ingroup prejudice, with a higher score for women (which indicates that in general they perceive more prejudice) the effect size did not reach the minimum acceptable, which means that it has no practical value. Subsequently, the participants were compared by age. Significant differences were obtained for the full scale and ingroup and outgroup prejudices. However, the effect size only reached a practical value for the total scale and for ingroup prejudice. The post hoc analysis showed that there are significant differences between multiple age groups, with the constant that prejudice increases with age. The differences between groups can be seen in Table 6.
In relation to the size of the locality, significant differences were found in the complete scale and in ingroup prejudices; however, only practical value was achieved for ingroup prejudices. The post hoc test reveals that it is in small towns where PDs show greater prejudice. Regarding the sociodemographic stratum, significant differences were found in the total scale, outgroup and ingroup prejudices; however, a practical value was only reached on the total scale and ingroup prejudices. Post hoc tests revealed differences between multiple groups (specifically: very high and low, very high and medium low, and medium low and medium high). The trend was that groups with a lower sociodemographic level showed higher scores on the prejudice scale. Finally, regarding the HDI, significant differences were found for the total scale, outgroup and ingroup prejudices, but no practical value was found for any of the variables. Due to the above, Student t tests were carried out, comparing only the scores of the groups with the largest difference.
The following results were obtained: Total scale t = -6.20; p < .001; d = -0.25, outgroup prejudice t = -4.12; p < .001; d = -0.16, and ingroup prejudice t = -5.98; p < .001; d = 0.24. Practical value is observed for the total scale and ingroup prejudice, with higher prejudice scores for participants who are in locations with a low HDI level.
Table 5: Descriptive statistics and variance analysis for the prejudice score and socio-demographic variables of people with disabilities
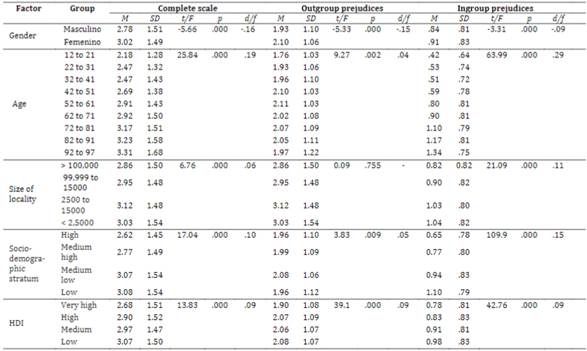
Note: Statistical power was > 0.80 in all cases.
Discussion and conclusions
According to the social model, disability is not limited to an individual deficiency, but arises in the interaction of the person with their environment, when spaces (material or symbolic) are constructed from a normalizing perspective, which imagines and idealizes an average person (Cruz & Casillas, 2017; Oliver, 2013; Shakespere, 2006). From this perspective, prejudices become obstacles that naturalize the situation of exclusion of PDs. However, although it is common to refer to PDs as if they were a univocal group, there are personal and social conditions that impact their experiences of discrimination (Pinilla-Roncancio, 2015; Rembis, 2010; Rodríguez, 2006). This research shows significant differences according to age, social stratum and characteristics of the locality (size and HDI). On the other hand, the CFA of the prejudice questionnaire, proposed by ENADIS 2017, shows the existence of two underlying factors: outgroup prejudices, which represent the perception that PDs have about how they are seen by society, and ingroup prejudices, which represent judgments about their own capabilities. From the theory of the ultimate attribution error (Pettigrew, 1979), this differentiation is explained by the existence of intergroup biases, that is, a tendency to judge differently what we consider close or distant from ourselves. Ultimately, the present study shows that the differences found seem to refer to the judgments that PDs make about their own capabilities (ingroup prejudices). These differences are discussed in detail below.
In relation to differences in perceived prejudice by gender, the results support what was described by Branco et al. (2019) and Dammeyer and Chapman (2018), noting that it is women with disabilities who report greater discrimination compared to men. Added to the problems associated with gender roles (gender violence, wage gap, allocation of care for others, etc.) are attitudes of paternalism, infantilism and ableism regarding disability (Cobeñas, 2018; Cruz, 2004; Morris, 1993; Pinilla-Roncancio, 2015; Rodríguez, 2011). However, it is necessary to point out that the statistical power turned out to be very low, which calls into question the validity of these results. Various authors (Cobeñas, 2018; Rodríguez, 2011) affirm that the differences between men and women tend to become invisible if a gender perspective is not adequately introduced in the methodological design, so it is possible that the questions used in the present study fail in pointing out relevant situations to understand the prejudices that women with disabilities face, for example, when recognizing their right to exercise their sexuality, study or carry out independent activities outside the home, etc.
On the other hand, differences were found between age groups. In general, the older you are, the greater the prejudices. This contradicts what was found by Harder et al. (2019), who point out a non-linear relationship between age and the perception of explicit prejudices about disability. The results of this study show a trend that is increasing, and at no time decreasing. Possible explanations for these differences could be attributed to the measurement instruments used, cultural differences, or the fact of studying only people with disabilities. With all this, the hypothesis is reinforced that older adults with disabilities face a greater risk of exclusion. According to the stereotype content model, both PDs and older adults are usually perceived as uncompetitive and dependent, which leads to them being treated in a condescending and over-protective manner (Fiske et al., 2002; Nario-Redmond et al., 2019). In this regard, Branco et al. (2019) add that, like PD, older adults are more vulnerable to social isolation and face prejudices related to the perception of the body, autonomy, and the justification of their disability with biological explanations. Various studies indicate that both groups are at greater risk of functional dependence (Escobar et al., 2012; Stuck et al., 1999; Vargas-Acevedo et al., 2017) which could be reflected in their tendency to respond more in agreement with in-group prejudices, related to their capabilities and potentials. Therefore, to promote the autonomy of PDs in adulthood, it is necessary to have an accepting environment that allows them to continue acquiring new skills (Ruggieri & Cuesta, 2018).
In the present study, significant differences were also found in the prejudices of PDs, depending on their sociodemographic level. These differences are observed both on the general scale and in in-group prejudices, being more pronounced among those belonging to low sociodemographic strata. This supports what was stated by authors such as Álvarez-Aguado et al. (2021) and Rodríguez (2006), who consider that socioeconomic status plays a crucial role in the self-determination of PDs. From the perspective of the social model of disability, the relationship between disability and factors such as poverty, low educational levels, difficulties in finding a job and limited access to health services, seems to influence the perception of prejudice of PD (Pinilla -Roncancio, 2015), especially in the assessment of their capabilities (ingroup prejudices). In close relation to the above, the influence of the locality’s HDI was explored. In this context, significant differences were observed only between the groups with very high and low HDI, indicating that those residing in areas with a low HDI exhibit higher levels of prejudice. This pattern, similar to that found in low socioeconomic strata, highlights the relationship between the socioeconomic environment and the perception of prejudice.
Pinilla-Roncancio (2015) explains these differences by arguing that, to cover the needs of a PD, a greater investment of economic resources is necessary. However, when considering the degree of marginalization of the community in which they live, it is possible to deduce that the ease of access to education, health and employment opportunities also translates into greater opportunities for social inclusion for the DP, which would explain why PDs who live in localities with a high HDI show less prejudice. The above supports the hypothesis that the perception of prejudice is lower among PDs with higher levels of education and who live in sectors with more developed health systems (Alvarez-Galvez & Salvador-Carulla, 2013; Harder et al., 2019). Finally, the results indicate that PDs who live in small towns show greater ingroup prejudices. The above may be related to the absence of education and employment opportunities for people with disabilities in small towns (for example in a rural context), which does not allow them to develop their capabilities, skills and abilities that ultimately translate into a more autonomous life.
Limitations and future lines of research
It is considered a limitation of this study that it was not possible to differentiate the responses of the participants based on the type of disability they present, which is a variable of great interest. In addition to the above, the ENADIS 2017 proposal is based on classic and explicit prejudices, so future lines of research could include the measurement of implicit and modern prejudices about disability, associated with paternalism, pity or envy towards the PDs. Likewise, it is essential to differentiate the experience of PD based on gender, and how gender roles influence the prejudices faced by women with disabilities. Future research should focus on shedding light on what factors determine the perception of PD prejudice in adulthood. Finally, it is of great interest to study why the prejudices expressed by PD decrease as their level of education and the quality of available health services increase.
REFERENCES
Ainscow, M., Dyson, A., & Weiner, S. (2014). From exclusion to inclusion: A review of international literature on ways of responding to students with special education needs in schools. En-clave Pedagógica, 13, 13-30. [ Links ]
Akrami, N., Ekehammar, B., Claesson, M., & Sonnander, K. (2006). Classical and modern prejudice: Attitudes toward people with intellectual disabilities. Research in Developmental Disabilities, 27(6), 605-617. https://doi.org/10.1016/j.ridd.2005.07.003 [ Links ]
Allport, G. W. (1954). The Nature of Prejudice. Addison Wesley. [ Links ]
Álvarez-Aguado, I., Vega, C. V., Spencer, G. H., González-Carrasco, F., Jarpa, A. M., & Campaña, V. K. (2021). Autodeterminación en personas con discapacidad intelectual que envejecen y algunas variables que inciden en su desarrollo. Interdisciplinaria, 38(3), 139-154. https://doi.org/10.16888/interd.2021.38.3.8 [ Links ]
Alvarez-Galvez, J., & Salvador-Carulla, L. (2013). Perceived discrimination and self-rated health in Europe: Evidence from the European Social Survey (2010). PLOS ONE, 8(9), 1-10. https://doi.org/10.1371/journal.pone.0074252 [ Links ]
Anatolievna, E. Z. (2020). Inclusión de los niños con capacidades diferentes en escuelas regulares en México: propósitos y realidad. Andamios, 17(43), 249-270. https://doi.org/10.29092/uacm.v17i43.774 [ Links ]
Babik, I., & Gardner, E. S. (2021). Factors affecting the perception of disability: A developmental perspective. Frontiers in Psychology, 12, 1-26. https://doi.org/10.3389/fpsyg.2021.702166 [ Links ]
Branco, C., Ramos, M. R., & Hewstone, M. (2019). The association of group-based discrimination with health and well-being: A comparison of ableism with other “Isms.” Journal of Social Issues, 75(3), 814-846. https://doi.org/10.1111/josi.12340 [ Links ]
Cárdenas, M., & Arancibia, H. (2014). Potencia estadística y cálculo del tamaño del efecto en G * Power: Complementos a las pruebas de significación estadística y su aplicación en psicología. Salud y Sociedad, 5(2), 210-224. https://doi.org/10.22199/S07187475.2014.0002.00006 [ Links ]
Cheng-Hsien, L. (2016). Confirmatory factor analysis with ordinal data: Comparing robust maximum likelihood and diagonally weighted least squares. Behavior Research Methods, 48(3), 936-949. https://doi.org/10.3758/s13428-015-0619-7 [ Links ]
Cobeñas, P. (2018). Investigar con mujeres con discapacidad: reflexiones epistemológicas y metodológicas desde el enfoque feminista-emancipador. Revista Brasileña de Estudios Pedagógicos, 99(251), 132-147. https://doi.org/10.24109/2176-6681.rbep.99i251.3473 [ Links ]
Comisión Económica para América Latina y el Caribe. (2021). Personas con discapacidad y sus derechos frente a la pandemia de COVID-19: que nadie se quede atrás. Informes Covid-19. https://www.cepal.org/es/publicaciones/46600-personas-discapacidad-sus-derechos-frente-la-pandemia-covid-19-que-nadie-se [ Links ]
Cruz, M. P. (2004). Mujeres con discapacidad y su derecho a la sexualidad. Política y Cultura, (22), 147-160. [ Links ]
Cruz, R. V., & Casillas, M. Á. A. (2017). Las instituciones de educación superior y los estudiantes con discapacidad en México. Revista de la Educación Superior, 46(181), 37-53. https://doi.org/10.1016/j.resu.2016.11.002 [ Links ]
Dammeyer, J., & Chapman, M. (2018). A national survey on violence and discrimination among people with disabilities. BMC Public Health, 18, 355. https://doi.org/10.1186/s12889-018-5277-0 [ Links ]
Dunn, D. S. (2019). Outsider privileges can lead to insider disadvantages: some psychosocial aspects of ableism. Journal of Social Issues, 75(3), 665-682. https://doi.org/10.1111/josi.12331 [ Links ]
Elwan, A. (1999). Poverty and Disability: A Survey of the Literature. https://documents1.worldbank.org/curated/en/488521468764667300/pdf/multi-page.pdf [ Links ]
Escobar, B. M. Á., Puga, G. M. a. D., & Martín, B. M. (2012). Análisis de la esperanza de vida libre de discapacidad a lo largo de la biografía: De la madurez a la vejez. Gaceta Sanitaria, 26(4), 330-335. https://doi.org/10.1016/j.gaceta.2011.12.016 [ Links ]
Fiske, S. T., Cuddy, A. J. C., Glick, P., & Xu, J. (2002). A model of (often mixed) stereotype content: Competence and warmth respectively follow from perceived status and competition. Journal of Personality and Social Psychology, 82(6), 878-902. https://doi.org/10.1037/0022-3514.82.6.878 [ Links ]
Fox, J., & Marquez, M. (2023). RcmdrMisc: R Commander Miscellaneous Functions. R package version 2.9-1. https://CRAN.R-project.org/package=RcmdrMisc [ Links ]
García-Vásquez, E. (2015). La discriminación por discapacidad como tema emergente en el contexto de los movimientos sociales contemporáneos. Revista de La Facultad de Medicina, 63(3). https://doi.org/10.15446/revfacmed.v63n3sup.50571 [ Links ]
Garín, J., & Suárez, C. (2016). Inclusión y grupos en situación de vulnerabilidad: orientaciones para repensar el rol de las universidades. Sinéctica. Revista Electrónica de Educación, 46, 1-15. [ Links ]
Harder, J. A., Keller, V. N., & Chopik, W. J. (2019). Demographic, experiential, and temporal variation in ableism. Journal of Social Issues, 75(3), 1-24. https://doi.org/10.1111/josi.12341 [ Links ]
Instituto Nacional de Estadística y Geografía. (2016). Diseño conceptual de la Encuesta Nacional sobre Discriminación (ENADIS) 2017. https://acortar.link/dXQ35Z [ Links ]
Instituto Nacional de Estadística y Geografía. (2018). Encuesta Nacional sobre Discriminación. Diseño muestral. https://www.inegi.org.mx/app/biblioteca/ficha.html?upc=702825100797 [ Links ]
Instituto Nacional de Estadística y Geografía. (2019). Estadística a propósito del día internacional de las personas con discapacidad. Comunicado 638/19. https://acortar.link/sCTMf8 [ Links ]
Instituto Nacional de Estadística y Geografía. (2023, 20 de noviembre). Encuesta Nacional sobre Discriminación (ENADIS) 2017. https://acortar.link/3UblcO [ Links ]
Kassambara, A. (2023). rstatix: Pipe-Friendly Framework for Basic Statistical Tests. R package version 0.7.2. https://CRAN.R-project.org/package=rstatix [ Links ]
Linares-García, J., Hernández-Quirama, A., & Rojas-Betancur, H. M. (2018). Accesibilidad espacial e inclusión social: experiencias de ciudades incluyentes en Europa y Latinoamérica. Civilizar: Ciencias Sociales y Humanas, 18(35), 115-128. https://doi.org/10.22518/usergioa/jour/ccsh/2018.2/a09 [ Links ]
Mair, P. (2020). MPsychoR: Modern Psychometrics with R. R package version 0.10-8. https://CRAN.R-project.org/package=MPsychoR [ Links ]
México. (2011, 30 de mayo). Ley General para la Inclusión de las Personas con Discapacidad. https://www.diputados.gob.mx/LeyesBiblio/pdf/LGIPD.pdf [ Links ]
Morris, J. (1993). Feminism and disability. Feminist Review, 43(1), 57-70. https://doi.org/10.1057/fr.1993.4 [ Links ]
Nario-Redmond, M. R. (2020). ABLEISM. The Causes and Consequences of Disability Prejudice. John Wiley y Sons. https://doi.org/10.1002/9781119142140 [ Links ]
Nario-Redmond, M. R., Kemerling, A. A., & Silverman, A. (2019). Hostile, benevolent, and ambivalent ableism: Contemporary manifestations. Journal of Social Issues, 75(3), 726-756. https://doi.org/10.1111/josi.12337 [ Links ]
Nowicki, E. A., Brown, J., & Stepien, M. (2014). Children’s thoughts on the social exclusion of peers with intellectual or learning disabilities. Journal of Intellectual Disability Research, 58(4), 346-357. https://doi.org/10.1111/jir.12019 [ Links ]
Oliver, M. (1998). ¿Una sociología de la discapacidad o una sociología discapacitada? En L. Barton (Ed.), Discapacidad y Sociedad (pp. 34-58). Morata. [ Links ]
Oliver, M. (2013). The social model of disability: Thirty years on. Disability and Society, 28(7), 1024-1026. https://doi.org/10.1080/09687599.2013.818773 [ Links ]
Organización de las Naciones Unidas. (2015). Transformar nuestro mundo: la Agenda 2030 para el Desarrollo Sostenible. https://unctad.org/system/files/official-document/ares70d1_es.pdf [ Links ]
Organización Mundial de la Salud. (2011). Informe mundial sobre la discapacidad. https://apps.who.int/iris/handle/10665/75356 [ Links ]
Page, M. C., Braver, S. L., & MacKinnon, D. P. (2003). Levine´s guide to SPSS for analysis of variance. Routledge. [ Links ]
Peña, T. C. L., & Estay, S. J. G. (2019). La inclusión social de personas con discapacidad: un tema de agenda política-institucional. Acta Sociológica, (80), 101-120. https://doi.org/10.22201/fcpys.24484938e.2019.80.76293 [ Links ]
Pettigrew, T. F. (1979). The ultimate attribution error: Extending Allport’s cognitive analysis of prejudice. Personality and Social Psychology Bulletin, 5(4), 461-476. https://doi.org/10.1177/014616727900500407 [ Links ]
Pinilla-Roncancio, M. (2015). Disability and poverty: Two related conditions. A review of the literature. Revista Facultad de Medicina, 63(3), 113-123. https://doi.org/10.15446/revfacmed.v63n3sup.50132 [ Links ]
Programa de las Naciones Unidas para el Desarrollo. (2014). Índice de Desarrollo Humano Municipal en México. https://acortar.link/dIG4HF [ Links ]
Programa de las Naciones Unidas para el Desarrollo. (2015). Índice de Desarrollo Humano para las entidades federativas, México 2015. https://acortar.link/2o45Uc [ Links ]
R Core Team. (2023). A Language and Environment for Statistical Computing. R Foundation for Statistical Computing, Austria. https://www.R-project.org/. [ Links ]
Rairan, F. S. G., López, J. R. C., Castro, L. A. G., Garzón, D. A. S., & Mosquera, N. R. (2017). Orientación de pasajeros con discapacidad visual dentro del Sistema de Transporte Masivo Transmilenio, mediante geolocalización satelital. Ingeniería, 22(2), 283-297. https://doi.org/10.14483/udistrital.jour.reving.2017.2.a08 [ Links ]
Rembis, M. (2010). Yes, we can change: disability studies - enabling equality. Journal of Postsecondary Education and Disability, 23(1), 19-28. [ Links ]
Revelle, W. (2023). psych: Procedures for Psychological, Psychometric, and Personality Research. R package version 2.3.9. https://CRAN.R-project.org/package=psych. [ Links ]
Rodríguez, J. Z. (2006). Un marco teórico para la discriminación. https://www.conapred.org.mx/documentos_cedoc/marco teorico para la discriminacion-Ax.pdf [ Links ]
Rodríguez, P. (2011). Feminismos periféricos. Revista Sociedad y Equidad, 2, 23-45. https://doi.org/10.5354/rse.v0i2.14426 [ Links ]
Rosa, L. R., & Menezes, A. B. (2019). Educational inclusion and social interaction: A literature review. Trends in Psychology, (2), 385-400. https://doi.org/10.9788/TP2019.2-07 [ Links ]
Rosseel, Y. (2012). lavaan: An R Package for Structural Equation Modeling. Journal of Statistical Software, 48(2), 1-36. https://doi.org/10.18637/jss.v048.i02 [ Links ]
Ruggieri, V., & Cuesta, J. L. G. (2018). Envejecimiento y trastorno del espectro autista. Medicina, 78, 69-74. [ Links ]
Santa Cruz, C., Espinoza, V., & Hohlberg, E. (2021). Problemas socioemocionales en niños con discapacidad auditiva, discapacidad visual y desarrollo típico. Revista Latinoamericana de Educación Inclusiva, 15(1), 95-116. https://doi.org/10.4067/s0718-73782021000100095 [ Links ]
Shakespere, T. (2006). The Social Model of Disability. En L. J. Davis (Ed.), The Disability Studies Reader (pp. 195-203). Taylor y Francis Group. [ Links ]
Signorell, A., (2023). DescTools: Tools for Descriptive Statistics. https://andrisignorell.github.io/DescTools/ [ Links ]
Stuck, A. E., Walthert, J. M., Nikolaus, T., Büla, C. J., Hohmann, C., & Beck, J. C. (1999). Risk factors for functional status decline in community-living elderly people: A systematic literature review. Social Science and Medicine, 48(4), 445-469. https://doi.org/10.1016/S0277-9536(98)00370-0 [ Links ]
Valdés-Cuervo, A. A., García-Vázquez, F. I., Torres-Acuña, G. M., Urías-Murrieta, M., & Grijalva-Quiñonez, C. S. (2019). Medición en investigación educativa con apoyo del SPSS y el AMOS. Clave editorial. [ Links ]
Vargas-Acevedo, C. A., Alzate-Posada, M. L., López-Díaz, L., & Velásquez, V. F. (2017). Dolor en personas ancianas con dependencia: programa de visita domiciliaria adaptado culturalmente a población rural. Revista de Salud Pública, 19(4), 519-526. https://doi.org/10.15446/rsap.v19n4.43527 [ Links ]
Worthington, R. L., & Whittaker, T. A. (2006). Scale development research: A content analysis and recommendations for best practices. The Counseling Psychologist, 34(6), 806-838. https://doi.org/10.1177/0011000006288127 [ Links ]
Data availability: The dataset supporting the results of this study are available at the Instituto Nacional de Estadística y Geografía (INEGI) website: https://www.inegi.org.mx/programas/enadis/2017/#Datos_abiertos
How to cite: Sainz Palafox, M., Vera Noriega, J. A., Peña Ramos, M. O., & Tánori Quintana, J. (2024). Sociodemographic variables and prejudices perception from disabled people. Ciencias Psicológicas, 18(1), e-3109. https://doi.org/10.22235/cp.v18i1.3109
Authors’ contribution (CRediT Taxonomy): 1. Conceptualization; 2. Data curation; 3. Formal Analysis; 4. Funding acquisition; 5. Investigation; 6. Methodology; 7. Project administration; 8. Resources; 9. Software; 10. Supervision; 11. Validation; 12. Visualization; 13. Writing: original draft; 14. Writing: review & editing. M. A. S. P. has contributed in 1, 2, 3, 6, 9, 13, 14; J. A. V. N. in 1, 2, 3, 4, 5, 6, 7, 8, 12, 13, 14; M. O. P. R. in 2, 3, 6, 14; J. T. Q. in 1, 2, 3, 5, 6, 14.
Received: October 27, 2022; Accepted: November 27, 2023
 Este es un artículo publicado en acceso abierto bajo una licencia Creative Commons
