


 Inglés (pdf)
 Articulo en XML
 Referencias del artículo

 Permalink
Before the term “attention deficit hyperactivity disorder” (ADHD), its precursors were called “Minimal Brain Injury” and “Hyperkinetic Reaction” (Frick & Nigg, 2012). These definitions included various learning disabilities, sleep, motor, and coordination problems, which gave too much amplitude to the pictures so named, making it almost impossible to treat, approach or diagnose effectively (Clements & Peters, 1962). Only in the Diagnostic and Statistical Manual of Mental Disorders III (American Psychiatric Association (APA), 1980) there was exclusive elements of the disorder identified, and the term attention deficit disorder (ADD) was adopted. This conceptualization implied the recognition of attention, particularly, problems with vigilance and sustained attention as central dysfunctions of the disorder (Frick & Nigg, 2012). In this manual was proposed three dimensions (inattention, hyperactivity, and impulsivity) and diagnosis in two types, ADD with and without hyperactivity, however, the diagnosis for impulsivity was not present (APA, 1980). Later the distinction was removed, and a single dimension was adopted and renamed attention deficit hyperactivity disorder (ADHD; APA, 1987).
Still on the conceptualization of the disorder, it is worth mentioning that the DSM-IV kept the name ADHD, but the list of items of diagnostic criteria was modified, which resulted in the adoption of two dimensions, namely Inattention/Disorganization and Hyperactivity/Impulsivity (APA, 1994). Such division reignited the discussion about the subtyping of the disorder into predominantly inattentive type, predominantly hyperactive-impulsive type, or combined type (Frick & Nigg, 2012).
With the publication of the DSM-5 (APA, 2013) and the studies reviewed by Willcutt (2012), two-dimensional models were accepted: inattention included features such as disorganization and dysexecutive syndrome, which can have repercussions in learning problems and hyperactivity/impulsivity, social disinhibition, intrusiveness, and emotional dysregulation, which can cause conduct and emotional regulation problems (Frick & Nigg, 2012). Finally, ADHD is defined by the presence of extreme problems in the behavioral domains of inattention and/or hyperactivity/impulsivity (APA, 2013).
From the 1990s, studies have attempted to seek an empirical structure of ADHD, based on theoretical observations and externalized problems (Achenbach et al., 1989; Achenbach et al., 1991). A factor analytic literature is recognized, two latent variables make up ADHD, inattention, and hyperactivity (Achenbach, 2020; Achenbach & Edelbrock, 1978; Mattos et al., 2006; Willcutt et al., 2012). Therefore, ADHD is analogous to hypertension or obesity: it is defined by measuring a latent trait through its symptoms and is assigned a clinical cut-off point with dimensional but not categorical significance (Nigg, Sibley, et al., 2020). Thus, ADHD symptoms make up a dimensional trait in the population (Willcutt et al., 2012).
Once ADHD is understood in a dimensional manner, its manifestation becomes heterogeneous throughout the life cycle (Luo et al., 2019; Nigg, Karalunas et al., 2020; Swanson et al., 2007). Regarding subtypes, listed in DSM IV and 5, certain individuals upon aging ceased to be of the combined type to predominantly inattentive (Willcutt, 2012). In children, the manifestation in boys tends to be more easily observed, while in adulthood, women show more relevant symptoms than men and tend to present the inattentive form (Hinshaw, 2018).
The dimensional approach to the disorder brings a discussion about its classification, in categorical or continuous variables. This is the main difference between the use of DSM in clinical practice and in research. In research, the disorder is considered as a spectrum, a continuous variable, so that the presence of the symptom and its frequency score for the ADHD level. In clinical practice, the categorical use predominates, under the logic of present or absent (Frick & Nigg, 2012).
In general, the use of categorical diagnosis ignores important findings about individuals' symptoms (Marcus & Barry, 2011). Therefore, people who differ in symptomatology numbers also differ in intensity and subtypes (Barry et al., 2002). Also, the understanding of ADHD as a continuum shows that individuals classified with the disorder can vary in intensity which makes people who are just below the threshold to be classified with the disorder may also suffer consequences of it (Lewinsohn et al., 2004). As for ADHD, and robust evidence that its expression occurs across a spectrum, makes the dimensional perspective superior to the categorical one (Hinshaw, 2018).
To obtain an accurate measure to assess adult patients with ADHD, the Adult Self-Report Scale (ASRS-18) was created (Rosler et al., 2010). Initially, one item was generated for each symptom listed in DSM-IV criteria A1 and A2 and 11 unlisted symptoms important for ADHD in adults were added (Ustun et al., 2017). Criteria diagnosis in adults is made in the presence of at least five symptoms that must be associated with some Impairment for at least six months (Mattos et al., 2006; Ustun et al., 2017). Definitive diagnosis of the disorder depends on other associated criteria: symptoms present before the age of 7 years (B), symptoms occurring in different environments (school and work, for example, C), functional impairment (D) and clinically confirming that symptoms are dissociated from other disorders (E) (Leahy, 2018; Mattos et al., 2006).
In Brazil, two studies have translated and adapted the Adult Self-report Scale (ASRS-18) cross-culturally. The International Test Commission (ITC, 2017) suggests that the adaptation should be carried out in seven phases (Borsa et al., 2012): (1) translation of the instrument from the source language into the target language, (2) synthesis of the translated versions, (3) assessment of the synthesis by expert judges, (4) assessment of the instrument by the target audience, (5) reverse translation, (6) pilot study and (7) structural analysis of the instrument.
In the first study, the first six phases listed were performed (Mattos et al., 2006). In the second one (Leite, 2011), the first structural study of the scale was performed through a Principal Component Analysis (PCA). However, PCA differs from the Exploratory Factor Analysis (EFA) (Damásio, 2012). Both techniques reduce/group several items into dimensions, based on item variances, but while PCA generates components, EFA produces factors. EFA is more suitable for psychological variables since factors are composed only of the common variance (the portion of variance that items share with each other). As the purpose of the EFA is to reveal latent constructs, it is necessary to consider only the common variance of the items and ignore specific variance (individual variance of the items). Therefore, when evaluating the ADHD constructs, only the variance of the items related to ADHD is of interest (common variance). The portion of the item that is not influenced by the construct (either specific variance or error variance) should not be considered. Above all, the EFA generates more accurate factor loadings than the PCA, less inflated since the item-specific variance is disregarded (Damásio, 2012).
Other studies from different countries evaluated the internal validity of the ASRS-18. A Korean study (Kim et al., 2013), a Spanish study (Pérez & García, 2007) and an Argentine (Scandar, 2021) confirmed a two-factor model (Inattention and hyperactivity) using an EFA. A French study (Morin et al., 2016) and an Italian study (Somma et al., 2019), based on structural equation modeling, proposed a bifactor model, which allowed both interpretation of the ASRS, as two factors, such as a one-factor model with just one global score.
The search for evidence of validity following rigorous steps and appropriate statistical procedures (ITC, 2017) makes the psychometric study of the ASRS-18 important. Appropriate analyzes evaluate the performance of the instrument and guarantee reliable measurements, as well as detecting measurement errors, for example: instrument wear, lack of adequate maintenance and interference in the response pattern (Brown, 2006).
As the ASRS-18 can be used to support the diagnosis and assess the effectiveness of pharmacological and/or psychotherapeutic interventions (Rosler et al., 2010; Ustun et al., 2017), more robust psychotherapeutic analyzes are required. Due to the superiority of EFA, in relation to ACP, for measuring latent constructs, combined with the absence of exploratory factor analysis applied to this scale in the literature, new studies on its internal validity are relevant, in addition to being the seventh phase of validation of psychometric instruments, which was previously carried out by an PCA (Damásio, 2012; ITC, 2017). Furthermore, it is also the role of the EFA to confirm or refute the structure of an instrument (Brown, 2006; Damásio, 2012), which coincides with the study since throughout the history of the DSM ADHD has had the presence or absence of subtypes.
ADHD according to gender (male and female) can present themselves in different ways, both in terms of manifestations, inattentive and/or hyperactive, and the intensity of their symptoms (Slobodin & Davidovitch, 2019; Vogel et al., 2018). Boys tend to show more externalized symptoms, such as hyperactivity and impulsivity, and are more likely to have the combined subtype. For girls, the symptoms are more internalized and subtle, such as inattention and low self-esteem, and they tend to have the predominantly inattentive subtype. Also, in relation to girls, they are more underdiagnosed or misdiagnosed, since their symptoms may be less noticeable or confused with other conditions (such as depression, anxiety or personality disorders (Slobodin & Davidovitch, 2019; Vogel et al., 2018).
Even when trying to adapt to social expectations, compensate for their differences or hide their difficulties, girls with ADHD can learn to camouflage their symptoms (Slobodin & Davidovitch, 2019; Vogel et al., 2018). So, in addition to the EFA, a confirmatory factor analysis (CFA) is also useful to choose the most appropriate structure for the measurement. To ensure that the measurement structure is the same in different groups, a multigroup confirmatory factor analysis (MGCFA) is used. The aim is to assess whether the number of factors, the factor loadings, the covariance of the latent variables, and the measurement error remain the same across different genders. That is, if the instrument is the same, if the items/symptoms have the same importance for the factor and if the items are biased by different groups (Borsa et al., 2012; Rios & Wells, 2014). This analysis seeks to understand the response bias regarding the gender variable, which is a lacunn in the literature (Slobodin & Davidovitch, 2019). Since the criteria A for the diagnosis of ADHD is made by counting the symptoms, MGCFA is suitable for studying the response pattern of the ASRS-18 by gender (Borsa et al., 2012; Rios & Wells, 2014).
It should be noted that inadequate or invalid instruments lead to unreliable results, bringing losses to society and professional practice, Federal Council of Psychology (Conselho Federal de Psicologia, 2022). Based on the above, the objectives of this study were: to present updates to the validity evidence based on the internal structure of the ASRS-18, to discuss the number dimensions of ASRS-18 and to present the importance of symptoms for the latent construct, as well as the response bias according to gender.
Method
Participants
The inclusion criteria to participate in the study were: be Brazilian and were between 18 and 30 years old. Two independent collections were carried out. In the first collection (Study I), 1096 people participated (70.3 % women, n = 770), mean age of 24 years (SD = 6.15), most attended college (89.6 %, n = 1006), the majority were single (91.2 %, n = 1000), the rest were married (8.7 %, n = 96) and only 3.8% (n = 42) had children. For Study II, 752 participants (71.9 % women, n = 540) a mean age of 23 years (SD = 3.46) most attended college (95.1 %, n = 715), the majority were single (93.2 %, n= 701), the rest were married (6.8 %, n = 48) and only 4.9 % (n = 37) had children.
Instruments
Adult Self-Report Scale (ASRS-18, adapted by Mattos et al., 2006). The scale is composed of 18 items and assesses the presence of symptoms listed in DSM-IV, it is answered on a 5-level Likert-type scale (0, Never to 4, Always), Higher scores indicate more intense symptoms (minimum score: 0; highest score: 72). Individuals can be diagnosed only for DSM-IV criteria A1 and A2 (Rosler et al., 2010; Ustun et al., 2017).
Procedures
The research was authorized by the Research Ethics Committee of the Universidade do Oeste Paulista (UNOESTE) (CAAE: 46378021.6.0000.5515). Two independent collections were carried out in an online format, using the snowball strategy, a non-probability sampling. The instruments were allocated in the Google Forms platform and the link disseminated in several online social networks. Two independent samples are carried out, the first collection took place between September and October and the second in November and December, both in the year 2021.
Carrying out a CFA on the same sample as the EFA, even if divided into two parts randomly, tends to corroborate the findings of the exploratory factor analysis, that is, when carried out on two truly independent samples, it reduces the probability of capturing random characteristics of the sample, which could lead to a final model that will not necessarily generalize to other samples (Kline, 2023; Olorunniwo et al., 2006). The order of application was as follows: Informed Consent Form (ICF), demographic questionnaire and ASRS-18. Participants should agree with the ICF to have access to the instruments.
Data analysis
The EFA was performed on the first sample in the FACTOR software (version 11.05.01) to evaluate the factor structure of the ASRS-18. Bartlett's sphericity and Kaiser-Meyer-Olkin (KMO) tests were performed to seek factorability of the matrix. The EFA was performed with polycorrelation and Robust Diagonally Weighted Least Squares (RDWLS) extraction method, appropriate for categorical data (DiStefano & Morgan, 2014; Li, 2016). As there were more than 400 participants, the software, using Solomon's method, automatically divides the sample into two and ran the EFA for the total sample. The aim of this method is to ensure representativeness of the subsamples As, in this study, data were collected by different social networks, for each social network there is a more prevalent user profile, so each social network is more likely to represent a different population. This method makes EFA more versatile. The Ratio Communality Index was used to check the equivalence of the subsamples (Lorenzo-Seva, 2021).
The decision regarding the number of factors was aided by parallel analysis with random permutation of the data with Bootstrap (Bias-corrected and accelerated, 500 resamples, 95 % confidence interval) (Lambert et al., 1991; Timmerman & Lorenzo-Seva, 2011) and the Closeness to Unidimensionality Assessments: Unidimensional Congruence (UniCo), Explained Common Variance (ECV) and Mean of Item Residual Absolute Loadings (MIREAL) (Ferrando & Lorenzo-Seva, 2018). The rotation used was Robust Promin (Lorenzo-Seva & Ferrando, 2019).
The model adjustment was verified as from three adjustment indexes, Chi-Square, Root Mean Square Error of Approximation (RMSEA), Comparative Fit Index (CFI) and Tucker-Lewis Index (TLI). Their appropriate values are, RMSEA less than .08 with upper bound of confidence interval less than .10, CFI and TLI greater than .90, preferably .95 (Brown, 2006). The H-index was used to assess factor stability, it measures how well a set of items represents the same factor (Ferrando & Lorenzo-Seva, 2018; Hancock & Mueller, 2001). The composite reliability was used to assess the quality of the measurement, they are considered acceptable above .70 (Valentini & Damásio, 2016). The quality and effectiveness of the estimates of the estimated factorial scores were assessed by four indices, Factor Determinacy Index (FDI), EAP marginal reliability, Sensitivity ratio (SR) and Expected percentage of true differences (EPTD) (Ferrando & Lorenzo-Seva, 2018). Two parameters of the Item Response Theory (TRI) were used, discrimination and threshold parameters, which add evidence in favour of the use of the instrument (Reckase, 1985).
In the second collection, a CFA was performed, in R software, implemented from the Lavaan package with the purpose of understanding the plausibility of the ASRS-18 model, the estimation method was RDWLS (DiStefano & Morgan, 2014; Li, 2016). The same indices as for the EFA, Chi-Square, RMSEA, CFI and TLI were used, with the same cut-off points suggested previously (Brown, 2006, 2015). Based on the fit indices and the modification indices generated in the CFA, the scale reduction was performed, respecting its properties (Goetz et al., 2013). There were no missing data in both analyzes.
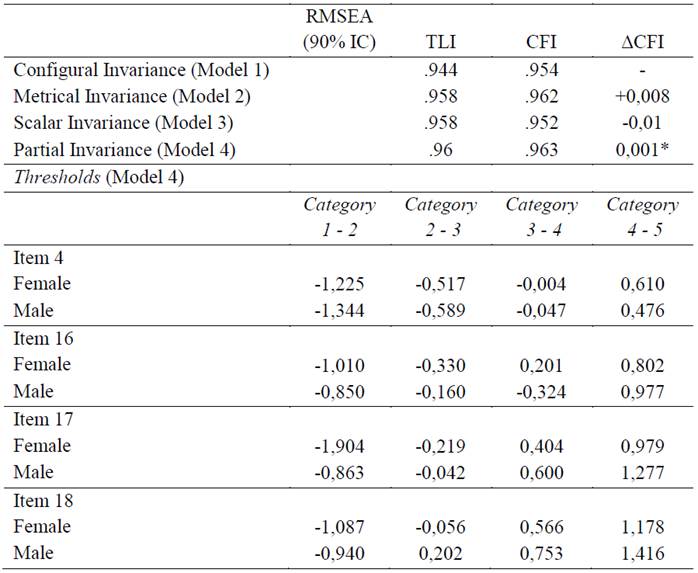
Finally, a MGCFA was performed on the total sample to assess the invariance of the ASRS-18 for the sex variable. Also implemented from the RDWLS (DiStefano & Morgan, 2014; Li, 2016). This analysis aims to assess the scale invariance in three models, configural, metric and scalar, respectively, if the number of factors, factor loadings and thresholds are equivalent between groups (Cheung & Rensvold, 2002). The same adjustment indices cited previously were used (Brown, 2015). Invariance was assessed by the difference of the CFI (ΔCFI), when the invariance between models has a drop greater than 0.01, the invariance of the measure is not met (Cheung & Rensvold, 2002).
Results
Study I. Exploratory Factor Analysis (EFA)
Bartlett's test of sphericity (9278.4, gl = 154, p < .001) and KMO (0.941, 95 % CI (0.92 - 0.94)) showed results in favor of the factorability of the matrix.
Initially, an EFA was performed in search of a two-factor structure, but the Parallel Analysis pointed to a single-factor structure. Since the percentage of variance explained from the actual data was higher than from the permuted data for the one-factor structure, which was not found in the two-factor model (Table 1; Timmerman & Lorenzo-Seva, 2011). Closeness to Unidimensionality Assessments corroborated in favor of this, two of them exceed the cut-off points in favor of unidimensionality (Ferrando & Lorenzo-Seva, 2018): UniCo (> 0.95) and MIREAL (< 0.30), already the ECV presents upper limit of its confidence interval (95 %) greater than its cut-off point (0.85). Table 1 presents the results of the parallel analysis, Closeness to Unidimensionality Assessments and the factor structure with the factor loadings of each item. No item showed a low factor loading, so there was no need to remove items.
Table 1: Parallel analysis, unidimensionality indices and Factorial Structure of the ASRS-18
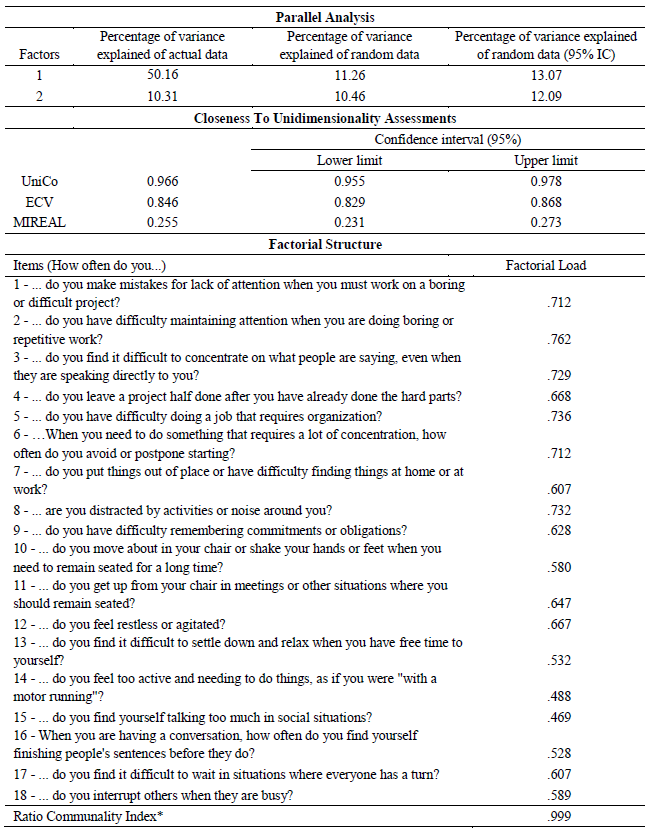
Notes: *The closer to 1, the greater the equivalence of the subgroups (Lorenzo-Seva, 2021). Items 1 to 9 originally belonged to the inattention dimension and items 10 to 18 to Hyperactive/Impulsive. UniCo: Unidimensional Congruence; ECV: Explained Common Variance; MIREAL: Mean of Item Residual Absolute Loadings.
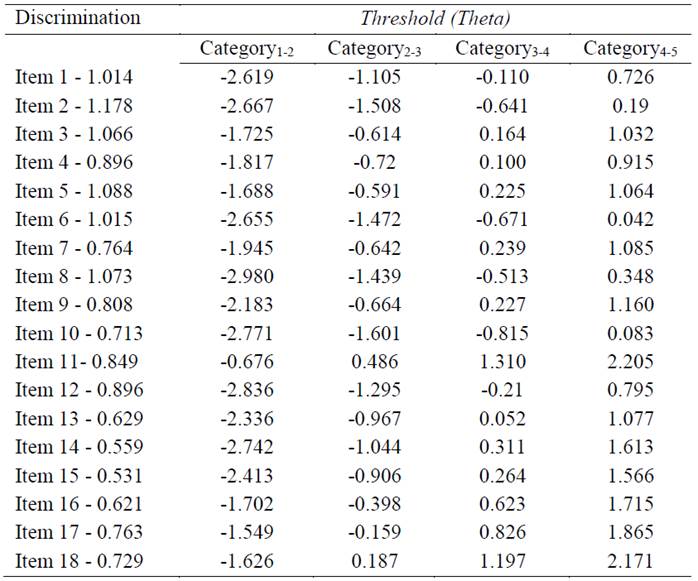
The indices of instrument adjustment, in the EFA, were adequate, demonstrating model plausibility, except for the Chi-square (Brown, 2006): X 2 = 1304.833, gl = 135; p< .001; RMSEA = .089, 95 % CI (.078 - .094); CFI = .962 and TLI = .957. The H-index (H-Latent = 0.931, 95 % CI (0.924 - 0.936); H-Observed = 0.920, 95 % CI (0.913-0.926)) demonstrated that the items represent a single factor well (Hancock & Mueller, 2001). The composite reliability of the instrument showed a value of 0.924 (Valentini & Damásio, 2016). The indices of quality and effectiveness of the factorial scores: FDI (0.965), EAP marginal reliability (0.931), SR (3.671) and EPTD (94.1 %). Table 2 presents two IRT parameters, discrimination and Threshold (Reckase, 1985).
The response patterns were satisfactory, indicating that the gradation of the scale points demands an increase in the level of Theta. Considering that two factors were expected, as predicted in previous studies (Achenbach, 2020; Achenbach & Edelbrock, 1978; Mattos et al., 2006; Willcutt et al., 2012), we chose to test a Bifactor model, through CFA, to better verify the latent structure of the instrument. This type of model can be used to make decisions regarding the structural plausibility of a latent variable, in this study a one- or two-factor model (Giordano et al., 2020; Giordano & Waller, 2020).
Study II. Confirmatory Factorial Analysis
The data from the CFA is presented graphically in Figure 1.
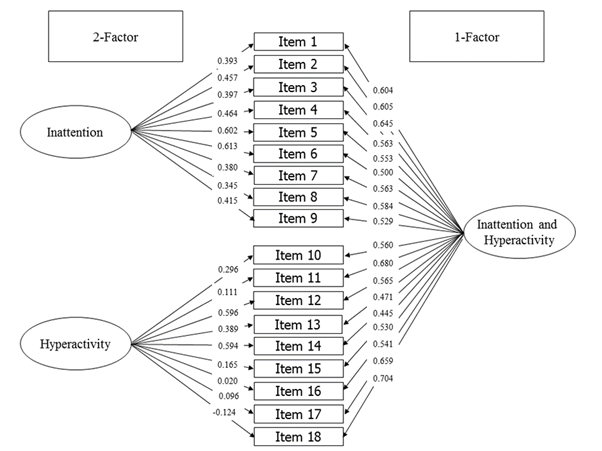
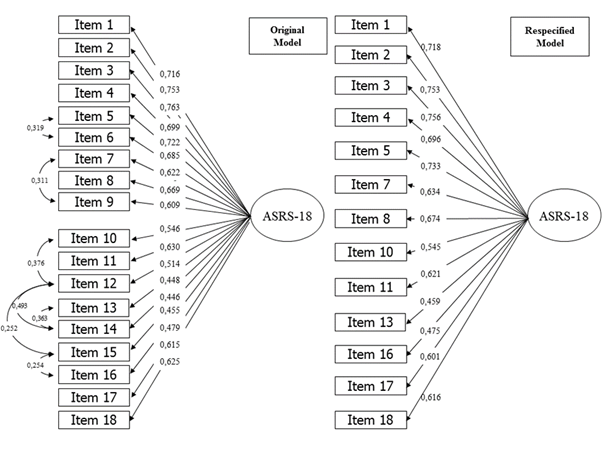
The fit indices of this model are plausible: X 2 = 437.270, df = 117; p < .001; RMSEA = .060, 95 % CI (.054 - .067); CFI = .967 and TLI = .958. Thus, based on the results found, the most parsimonious decision is to opt for the unifactorial model given that it presents higher factorial loadings and corroboration by the hierarchical McDonald's omega in favor of the unidimensionality of the measure (ωGeneral = .77; ωInattention = .129; ωHyperactivity = .040) (Bornovalova et al., 2020; Brown, 2006; DeMars, 2013; Rios & Wells, 2014). Once the single-factor model was chosen, the CFA was performed, which did not show satisfactory fit rates: X 2 = 1351,084, df = 135; p < .001; RMSEA = .110, 95 % CI (.104 - .115); CFI = .877 and TLI = .860. Thus, from the analysis of the modification indices some observations can be made about the ASRS-18. The most evident are the residual correlations between the items- 12 e 14 (Modify index = 164,473 e Expects parameter change = 0,338); 13 e 14 (Modify index = 91,821 e Expects parameter change = 0,289); 10 e 12 (Modify index = 61,652 e Expects parameter change = 0,262); 12 e 13 (Modify index = 65,374 e Expects parameter change = 0,249); 7 e 9 (Modify index = 46,043 e Expects parameter change = 0,197); 5 e 6 (Modify index = 32,979 e Expects parameter change = 0,163); 12 e 15 (Modify index = 31,805 e Expects parameter change = 0,194) e 15 e 16 (Modify index = 31.315 e Expects parameter change = 0,191).
If the residual correlation of these items is added, an improvement in the adjustment indexes is observed, X 2 = 729.040, df = 127; p < .001; RMSEA = .080, 95 % CI (.074 - .085); CFI = .939 and TLI = .927 (Figure 2 - Model A). Thus, it was decided to remove items 6, 9, 12, 14 and 15 and, from this, optimal adjustment indexes were obtained: X 2 = 6754.623, df = 78; p < .001; RMSEA = .075, 95% CI (.068 - .083); CFI = .959 and TLI = .950 (Figure 2 - Model B).
In conclusion, a multi-group confirmatory factor analysis (MGCFA) was performed on the total sample. For each model created a parameter is fixed (factor, factor load and thresholds) to evaluate its equivalence within the sex variable. Configural and metric invariance was obtained since the CFI increased from model 1 to model 2. The scalar invariance was borderline, once from model 2 to model 3 there was a 0.01 increase in CFI value. To investigate which items did not obtain equivalent thresholds between groups, a partial invariance model was created. Items 4, 16, 17 and 18 when free to vary within the sex category improved the model fit (ΔCFI = +0.001). The results are presented in Table 3.
Discussion
The aim of the present study was to analyze the psychometric properties of the ASRS-18, with emphasis on validity evidence based on the internal structure of the test, which supports a trend adopted by the DSM, a more dimensional view of disorders. (Narrow & Kuhl, 2011; Regier et al., 2013; Ruscio et al., 2011).
It was expected to find a two-factor structure in both the EFA and CFA, since it is the most recognized in the literature (Achenbach, 2020; Achenbach & Edelbrock, 1978). However, the results of the present study indicated that the best factorial solution would be that of a single factor. It is believed that, although divergent from the results of previous studies, the solution found can be accepted due to the adequacy of the statistical procedures used and the possibility of interpretation of the phenomenon that is maintained.
In relation to other studies which aimed at validating and/or studying the psychometric parameters of the ASRS-18 in other countries, the present study presented more robust analyses based on more recent statistical criteria in the field of factor analysis. For example, the Korean study (Kim et al., 2013) and the Spanish study (Pérez & García, 2007) found, through the EFA, a classic two-factor structure; however, the factor retention method used was the Kaiser-Guttman criterion (Eigenvalue > 1), which tends to overestimate the factors to be retained (Damásio, 2012; Laher, 2010; Dharmaratne & Attygalle, 2018). Similarly, the Argentine study (Scandar, 2021) did not specify the retention method used, due to the software used, probably Eigenvalues, in addition, it was used the Varimax rotation, which is orthogonal rotation, which does not allow a correlation between factors, which is not appropriate for latent variables such as ADHD (Costello & Osborne, 2005; Damásio, 2012).
In contrast, studies such as the French (Morin et al., 2016) and the Italian (Somma et al., 2019) use bifactor models with the aim of proposing the idea that both the model with only one general factor and the two-factor model hold up, although when analyzing the factor loadings of the models the same thing occurs as in this study. Instead of being similar in each model, one-factor versus multi-factor, they increase towards the general factor model. Importantly, bifactor models tend to have an overfit with optimal fit rates (Bornovalova et al., 2020; DeMars, 2013). There is also a study that is limited only to the analysis of reliability measures, for example Cronbach's alpha, without concern for checking the internal structure of the instrument (Zohar & Konfortes, 2010).
Although ADHD is classically subdivided into inattention, hyperactivity or combined, the best perspective is the one proposed by Frick & Nigg (2012), in which there is the idea of removing the importance of the designation of subtypes, since they reflect only a momentary clinical profile and not a true permanent subtype. In addition to the fact that a possible two-factor model is more plausible in children, as they tend to drop hyperactive features as they age, this may be a configural variance of the model, i.e., indicating dimensional instability over people's lifetimes (Frick & Nigg, 2012; Frick & Nigg, Sibley, et al., 2020). Thus, an MGCFA in a longitudinal study is important to empirically understand the developmental course of ADHD.
Still on the stability of the model found, one notices that there is evidence that the factorial solution is stable. From the H index it was possible to verify a well-defined latent variable and that may present itself in a stable manner in future studies (Hancock & Mueller, 2001). The composite reliability showed high accuracy of the scores (Valentini & Damásio, 2016). In addition, the quality and effectiveness indices of the factorial scores indicated an excellent quality. This indicates that the instrument can be used both in research and individually for symptomatology assessment in clinical settings.
Among the IRT parameters analyzed, considering the discrimination parameter, it was observed that items 1, 2, 3, 5 and 8 stood out for the best ability to differentiate individuals with higher or lower latent trait. In IRT the level of latent trait is presented in the Theta measure (θ), higher levels of θ indicate higher latent trait, lower ones indicate lower trait and can range between - ∞ and + ∞. Thus, thresholds indicate the amount of latent trait, in θ, required for there to be a change in the pattern of responses on a Likert-type scale. For example, in Item 1 it is necessary for an individual to have his latent trait (θ) equal to 0.726 for him to stop answering frequently and start answering very often. Observing Table 2, all items present increasing thresholds.
Therefore, individuals with higher latent trait have a higher probability of having a higher response pattern within the Likert-type scale. All items present increasing thresholds and in no item is a problem found (Reckase, 1985). The use of IRT provides important information that can be used in clinical practice. Items with greater discrimination capacity provide information on how better this item can classify the individual in terms of the amount of latent variable (high or low), analogous to specificity. Thresholds determine how much latent variable is needed to respond higher on the items, analogous to sensitivity. The higher the Theta value of an item, the greater the severity of a symptom required to encompass a higher response. Items like 2, 3 and 5 are more discriminating, while items like 11 and 17 require greater symptom severity to have a greater response pattern and items, such as 8 and 12, have little latent trait and allow for a higher response pattern.
Based on the CFA, it is possible to highlight some observations about the instrument. The high residual correlation between items 10, 12, 14, 15 and 16 may have occurred due to redundancy of content/semantics. Although written in different ways, items 12 and 14 refer to “restlessness” (How often do you feel restless or agitated? and how often do you feel too active and needing to do things, as if you were “running a motor”? Items 7 and 9 are related to memory/forgetfulness (How often do you put things out of place or have difficulty finding things at home or at work?). Adding residual correlations may improve the fit indices, however, they do not improve the instrument since redundant items create a less parsimonious model, so we opted for the exclusion of items and reduction of the instrument.
As the use of the full scale or the DSM criteria are more common in clinical practice, knowledge about the factorial structure offered by the CFA can impact symptom counts. The high residual correlation, in addition to demonstrating that different items evaluate the same symptom, also showed that the pattern of responses in these items is very similar, tending to have the same response on the Likert scale, potentially overestimating the symptom count for criteria A.
The multi-group confirmatory factor analysis (MGCFA) demonstrated that its structure is equivalent for sex, the number of factors and factor loadings are invariant and the invariance of the thresholds, is borderline. Some degree of scalar invariance was expected for the ASRS-18, as ADHD symptoms vary for sex (Hinshaw, 2018). Women tended to have greater difficulty endorsing for the inattention-related item (item 4). In turn, the higher thresholds for men in hyperactivity symptoms reinforce with the idea that these symptoms are more severe in them, since they start to express their symptoms when they have a higher latent trait than women (Arnett et al., 2015). Other studies, however, do not find a statistically significant difference (Corbisiero et al., 2017), which is worth reinforcing that in this study the scalar invariance is borderline and the hypothesis of invariance of the thresholds is met for the sex variable (Brown, 2015; Cheung & Rensvold, 2002).
According to MGCFA, the item 4 there was a greater difficulty of response endorsement for females, i.e., women need to have a greater latent trait than men for them to respond higher on such an item. The opposite occurs in items 16, 17 and 18, in which women more easily endorse higher answers, thus needing less latent trait to answer higher, which can also impact the symptom count for the criteria. When gender is taken into consideration, women tend to respond lower on item 4, but higher on items 16, 17 and 18. Therefore, when gender is considered, it must be considered when counting symptoms, for women considering a higher response pattern for item 4 and lower for items 16, 17 and 18.
Conclusions
The ASRS-18 is a scale that proposes to measure ADHD on a single general factor. Its model was found to be plausible, accurate, and stable. Another tool that can contribute to understanding the dimensions of ADHD is exploratory graph analysis. Some considerations can be made about the response pattern when the variable sex is considered. The items that can best differentiate individuals with high and low degrees of latent variable are items 1, 2, 3, 5, and 8. Therefore, it would be appropriate both for symptomatology survey in the clinical setting as a complementary source of information and in research on the subject.
The limitations of the study are the use of a convenience sample and the number of female respondents being much higher than men, as well as the age being limited to 18 to 30 years old. The existence of a version of the same instrument, in English, based on the DSM-V criteria that was published during this research. In this most recent version, six new items were added, four of which are listed in the current version of the manual and two are not listed. Therefore, a cultural adaptation is necessary, as mentioned in the introduction, to allow studies with a more up-to-date instrument and to understand the disorder or the new instrument. Even so, this study is not much affected since the information on the internal structure demonstrated is also expected in the new instrument, as only items were added. Another limitation is the fact that there is no collection relating to the diagnosis of ADHD.
It is noteworthy that the present study proposed a reduction of the scale (without items 6, 9, 12, 14, and 15), making it important to use a new sample to test the refined scale. A smaller version of the instrument allows the assessment of a greater number of constructs in a test session, as it reduces application time and respondent’s fatigue. Although the reduction of instruments may reduce the reliability and precision of the measurement these characteristics were not lost in the study. As a response bias was detected for the gender variable (male or female), it is proposed to search for which response on the Likert scale should be used to count symptoms according to gender for criteria A of the DSM.
Another important aspect would be to perform a taxometric analysis to evaluate if the ASRS-18 can classify individuals in categories and in how many categories, accompanied by a ROC Curve (Receiver Operating Characteristic) and AUC (area under the ROC curve) to evaluate the model and symptom count for criteria A. The ASRS-18 is a proxy of the latent variable to be measured (ADHD). The study of internal validity is a tool to show or offer solutions in clinical practice and research, whether to measure the severity of the event, outcomes, or diagnosis.

