


Serviços Personalizados
Journal

Artigo
 texto em
  Inglês (pdf)
 Artigo em XML
 Referências do artigo
Links relacionados
Compartilhar

 Permalink
Ciencias Psicológicas
versão impressa ISSN 1688-4094versão On-line ISSN 1688-4221
Cienc. Psicol. vol.15 no.2 Montevideo dez. 2021 Epub 01-Dez-2021
https://doi.org/10.22235/cp.v15i2.2318
Original Articles
Intraclass Correlation Coefficient: Applications to estimate the temporal stability of a measuring instrument

1 Universidad Peruana de Ciencias Aplicadas, Perú, jossue.correa@upc.pe
This article presents theoretical and practical aspects about the use of the Intraclass Correlation Coefficient (ICC); it describes its advantages with respect to the Pearson’s product-moment coefficient to determine the temporal stability of the scores of a measurement instrument. This research work corresponds to a methodological article. For the application of the method, 42 university students were intentionally selected, mostly women (53.4 %), aged between 17 and 26 years. The Interpersonal Reactivity Index (IRI) was administered; after three weeks the retest was performed. The results show the versatility of the ICC to provide information regarding Pearson's r. Likewise, it was found that in all cases the Pearson r coefficient slightly overestimates the stability of the IRI scores. It is concluded that the ICC reports stable and less-biased values to determine the evidence of temporal stability of a measurement instrument.
Keywords: reliability; temporal stability; correlation; repeated measurements; ANOVA
El presente artículo expone aspectos teóricos y prácticos acerca del uso del Coeficiente de Correlación Intraclase (CCI), se describen sus ventajas respecto al coeficiente producto momento de Pearson para determinar la estabilidad temporal de las puntuaciones de un instrumento de medida. Este trabajo de investigación corresponde a un artículo metodológico. Para la aplicación del método se seleccionaron intencionalmente 42 estudiantes universitarios, en su mayoría mujeres (53.4 %), con edades entre los 17 y 26 años. Se les administró el Índice de Reactividad Interpersonal (IRI), luego de tres semanas se realizó el retest. Los resultados muestran la versatilidad del CCI para proporcionar información respecto al r de Pearson. Asimismo, se encontró que en todos los casos el coeficiente r Pearson sobreestima ligeramente la estabilidad de las puntuaciones del IRI. Se concluye que el CCI reporta valores estables y menos sesgados para determinar las evidencias de estabilidad temporal de un instrumento de medida.
Palabras clave: fiabilidad; estabilidad temporal; correlación; medidas repetidas; ANOVA
Este artigo apresenta aspectos teóricos e práticos sobre o uso do Coeficiente de Correlação Intraclasse (CCI), são descritas suas vantagens em relação ao coeficiente produto momento de Pearson para determinar a estabilidade temporal das pontuações de um instrumento de medição. Este trabalho de pesquisa corresponde a um artigo metodológico. Para a aplicação do método, foram selecionados intencionalmente 42 estudantes universitários, em sua maioria mulheres (53,4 %), com idades entre 17 e 26 anos. Foi administrado o Índice de Reatividade Interpessoal (IRI), após três semanas foi realizado o reteste. Os resultados demostram a versatilidade do CCI para proporcionar informações a respeito do r de Pearson. Da mesma forma, verificou-se que em todos os casos o coeficiente r de Pearson superestima ligeiramente a estabilidade das pontuações do IRI. Conclui-se que o CCI relata valores estáveis e menos enviesados para determinar as evidências de estabilidade temporal de um instrumento de medição.
Palavras-chave: confiabilidade; estabilidade temporária; correlação; medidas repetidas; ANOVA
In recent years, the measures of agreement have gained popularity in psychology research, specifically in the field of psychometrics; they are mainly used to estimate evidence of validity and reliability (Muñiz, 2018). Thus, among the most commonly used coefficients we can find Guilford's index of agreement (1954), the Kappa coefficient (Cohen, 1960), Lawshe's coefficient (1975), the congruence index (Rovinelli & Hambleton, 1977), the binomial test (Siegel, 1980), the validity coefficient (Aiken, 1980; 1985), the congruence index (Hambleton, 1984), the multidimensional scaling index (Sireci & Geisinger, 1992), and the content validity coefficient (Hernández-Nieto, 2011).
These coefficients are effective to analyze interobserver agreement when the level of measurement is categorical, a situation that is quite common when using the expert judgment procedure (Martínez, 2005; Muñiz, 2018). In other words, these coefficients allow us to quantify a qualitative assessment of n assessors who express their point of view regarding the quality of the items that make up a test. Such assessments are quantified in a response format which addresses aspects such as the domain, relevance, and representativeness of these reagents with respect to an underlying construct (American Educational Research Association (AERA), American Psychological Association (APA) & National Council on Measurement In Education (NCME), 2018).
It is worth mentioning that the main reason why these coefficients have become popular is the simplicity of their calculation and the easy interpretation of their values (Bartko, 1994; Benavente, 2009). However, despite the number of coefficients available, there is a certain preference among researchers to use Aiken’s V coefficient (Aiken, 1980; 1985; Merino & Livia, 2009; Pedrosa, Suárez-Álvarez & García-Cueto, 2014), even if, often, its use does not include the quality aspects mentioned and only includes superficial assessments such as Agree or Disagree.
Unlike these coefficients, there is another set that allows the analysis of quantitative variables (interval scale); that is, with direct scores (Livia & Ortiz, 2014). With these scores, it is also possible to analyze the evidence of validity and reliability by means of different procedures. Thus, for example, when reporting the evidence of validity in relation to other variables, it is usually reported through the application of different correlation coefficients (Martínez, 2005; Muñiz, 2018). Among the best known, the use of Pearson's product-moment correlation coefficient and the multitrait-multimethod matrix (Rodríguez-Miñón, Moreno & Sanjuán, 2000) stand out.
On the same vein, different methods can be used to estimate the evidence of reliability of a measure, including internal consistency, parallel forms, and temporal stability-also called test-retest, the method with which the agreement of scores of a measure is obtained. For these cases, we usually resort to the use of Pearson's product-moment correlation coefficient (Martínez, 2005) despite the drawbacks that its use may bring (Shrout & Fleiss, 1979).
Intraclass Correlation Coefficient (ICC)
With regard to evidence of reliability, one of the most widely used methods is internal consistency (Cascaes Da Silva et al., 2015; Ledesma, Molina, & Valero Mora, 2002). Among the coefficients with which this method works, the use of the Alpha coefficient stands out (Livia & Ortiz, 2014; Muñiz, 2010). This has received criticism due to non-compliance with the assumptions required for its application (Domínguez & Merino, 2015; Ventura-León, 2018), such as the tau-equivalent assumption which is required to estimate alpha coefficients by dimensions (Raykov, 1997). Therefore, specialized bibliography suggests the use of other coefficients such as the Omega (Ventura-León, 2017; Viladrich, Angulo-Brunet & Doval, 2017) or the composite reliability coefficient (Hair, Anderson, Tatham & Black, 2010) which yield less biased estimates.
However, there are other procedures for demonstrating the reliability of an instrument. For example, temporal stability-less popular than internal consistency, but no less important. This method refers to the agreement of the score at two different points in time (Muñiz, 2010; 2018). This procedure is also known as test-retest. Applications of the procedure usually resort to the calculation of Pearson's product-moment correlation coefficient (r), with which it is possible to verify the relation between the two measurements; however, this value is generally overestimated (Spence-Laschinger, 1992) due to the linear nature of the coefficient (Shrout & Fleiss, 1979).
The use of this coefficient implies an important limitation because, if an instrument systematically measures moments that are different from one another, the correlation may be perfect even though the agreement is null (Pita & Pértegas, 2004). For this reason, the use of Pearson's coefficient can constitute a source of error in measurement, since it omits the intra and intersubject variability in the calculation (Shrout & Fleiss, 1979), therefore, exposing researchers to systematic errors in their interpretations (Bartko, 1994; Ledesma et al., 2002).
To resolve this, the generalizability theory (GT) offers a profound theoretical development about reliability, defining it as the proportion of the variance of an observed score that is not attributable to errors in measurement (Spence-Laschinger, 1992). This encourages the specification and estimation of the true score variance, error score variance and observed score variance components, and the calculation of coefficients based on these estimates (Mandeville, 2005; Pita & Pértegas, 2004). From this approach, it is suggested to consider the use of the ICC to determine the agreement between two measurements taken in a time interval (Esquivel et al., 2006; Koo & Li, 2016; Mandeville, 2005; Shrout & Fleiss, 1979; Weir, 2005). Unlike other coefficients, the ICC allows for the detection of systematic measurement bias (Esquivel et al., 2006), in addition to verifying the temporal stability of the scores (Martínez, 2005; Muñiz, 2018).
At this point, it is necessary to review the complexity of the definition of reliability, since it contemplates the variance ratio between the true score with respect to the total score variance (AERA, APA, NCME, 2018). This definition is important when the objective of the study has to do with determining internal consistency (Vargha, 1997). However, when the aim is to measure the agreement of the scores of a measurement instrument at two moments in time on an unaltered sample, scientific literature does not suggest a specific procedure (Muñiz, 2018), and the main reason involves the measurement scale, with regard to the temporal stability of continuous measures (Benavente, 2009; Mandeville, 2005).
In this framework, the calculation of reliability through temporal stability (test-retest) is not a commonly used procedure (Camacho-Sandoval, 2008; Pita & Pértegas, 2004; Prieto, Lamarca & Casado, 1998), but this does not mean that its estimation is irrelevant. It responds rather to aspects of convenience, given that the test-retest method aims at verifying that the variability of the scores does not differ significantly from one another (Weir, 2005). However, when the assigned scores differ consistently between each observation, it is necessary to resort to more sophisticated calculation methods that allow reducing the measurement error. One of the suggested procedures is the calculation of correlation coefficients resulting from the residuals of a repeated measures ANOVA (Cerda & Villarroel, 2008; Koo & Li, 2016; Shieh, 2016).
The ICC was originally developed by Fisher (1954) as a modification of Pearson's correlation coefficient. Thus, the ICC applies now is calculated from the mean squares, resulting from a repeated measures analysis of variance, and is widely used in other disciplines (Cortés, Rubio & Gaitán, 2010; Koo & Li, 2016) to assess the validity and reliability of measurement instruments. f4
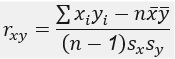
Where:
σ 𝑋𝑌 is the covariance of (X, Y)
σ 𝑋 is the standard deviation of the variable
σ 𝑌 is the standard deviation of the variable Y
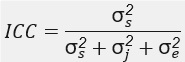
The most important aspects to recommend the use of the ICC in psychology research involves the fact that it takes into account the measurement error, which is necessary to be able to control bias (Camacho-Sandoval, 2008), and intra and intersubject variability (Hazra & Gogtay, 2016). This shows its benefits compared to coefficients such as Pearson’s or Spearman’s (Esquivel et al., 2006). To this end, Abad Olea, Ponsoda and García (2011) point out that by breaking down the variability of the data, according to the sources of error, the corresponding variance components are estimated. These elements refer to an estimate of the variability attributed to the subjects, items and the residual. Therefore, the calculation of the ICC constitutes a more accurate and less biased estimate. Likewise, in terms of variance components, the ICC is obtained as follows: f5
σs2: Intersubject variability (attributable to differences between subjects, s).
σj2: Intrasubject variability (refers to the differences in the measurements of the same subject, j).
σe2: Residual variability (random variability associated with measurement errors, e).
According to Shrout and Fleiss (1979), the ICC expresses single quantities of the relative magnitude of the two variance components of a score. As the proportion of error variance of total variance in a set of scores decreases, the possible values of the ICC range from 0 to 1 (Manterola et al., 2018; Müller & Büttner, 1994), wherein a large proportion of error variance in a set of scores produces a low ICC coefficient and indicates low reliability (Turner & Carlson, 2003). They also point out that the minimum acceptable value for the ICC is 0.75 (Haggard, 1958; Shrout & Fleiss, 1979). In this regard, Prieto et al. (1998) modified the calculation of the ICC based on the variability of the observed scores: The more homogeneous the study sample, the lower the ICC tends to be.
According to the GT, an approximation to the measurement of the error variance can be obtained by breaking down the variability of the data from each source of variation. This way, the elements of the variance (variability attributed to the subject, to the items and to the measurement error) are estimated. The application of ANOVA allows to make these estimates. To do so, it is necessary to define the number of levels of the intrasubject variable (number of measurements carried out in a period of time). Among the results, we select the sums of squares (SS), degrees of freedom (df) and quadratic means (QM), with which it is possible to calculate the ICC. f6
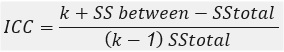
Where:
k: Number of measures
SS between: Root mean square of the scores
Total SS: Sum of mean squared error of one-way ANOVA
Accordingly, the convenience and advantages of the ICC in relation to other correlation coefficients (concordance) has been shown. Next, an application of the ICC shall be presented with the objective of determining the temporal stability of the scores of the Interpersonal Reactivity Index (IRI) in a sample of university students from Lima. The traditional procedure that measures the concordance of the measures, using Pearson’s correlation coefficient is compared with the procedure suggested through the ICC that comes from a repeated measures ANOVA.
Method
Participants
To demonstrate the applicability of the ICC, 41 students were purposively selected from public (67.6 %) and private (32.4 %) universities -mostly women (53.4 %), with ages ranging from 17 to 26 years old. The selection criteria of the students were based on their accessibility, regular attendance to classes, and approval of the informed consent. All students had a middle cultural and socioeconomic status.
Instrument
The Davis’ Interpersonal Reactivity Index (1983) was used. This self-application, paper-and-pencil, instrument assesses cognitive and affective empathy (Esteban-Guitart, Rivas & Pérez, 2012), using a Likert-type response format with five options: It does not describe me well (1), It describes me a little (2), It describes me well (3), It describes me quite well (4), It describes me very well (5). It consists of 28 items that allow measuring individual differences in the empathy construct through the following four subscales (7 items each): Perspective Taking and Fantasy (cognitive component) and Empathic Concern and Personal Discomfort (emotional component). The Spanish adaptation of Mestre, Frías, and Samper (2004) was used for this research, which maintains the structure of the items in each of the categories of the original version.
Procedure
The administration of the instruments was carried out between April and May 2020, and the measurements were taken individually. As it is a longitudinal measurement (two measurements), the measurements were intended to be made under similar conditions (day and time) and leaving a period of three weeks. The recommendations and regulations for the application of tests proposed by the International Test Commission (2000) were considered with the objective of minimizing the variance irrelevant to the construct that is prone to occur during the administration of psychological tests. Prior to the administration of the tests, the participants signed the informed consent form in which they were informed of the voluntary nature of the study, the freedom of their participation, the absence of physical and psychological harm, anonymity and the confidentiality of the information collected. In this way, the ethical guidelines according to the Helsinki rights were respected, in addition to the Código de Ética del Perú (Peruvian Code of Ethics) (Colegio del Psicólogo del Perú (Peruvian Association of Psychologists), 2017).
Data analysis
The statistical analysis was performed using a syntax developed for the IBM SPSS v. 25 software. The data analysis was carried out in stages, initially exploring the descriptive and distributional statistics of the items. Thus, the assumption of univariate normality was assessed by means of the skewness and kurtosis coefficients, considering the values within the range of ± 1.5 as a criterion (Pérez & Medrano, 2010). Subsequently, the test-retest procedure was applied, and the concordance of the scores was analyzed through Pearson's product-moment correlation coefficient (r). The criteria for its interpretation were based on Cohen's suggestions, who points out that this is in itself an effect size (Cohen, 1992). The second test-retest estimation was carried out through a repeated measures ANOVA, where two levels were defined. This procedure also allowed to verify the intra and intersubject variations where statistically significant differences of α ≤ .05 were assumed. The results refer to the variability of the measurement in the same subject and, in the second case, to the variability between the response of one participant in relation to others. A syntax by which it can be reproduced has been included because, in this occasion, the aim is to identify the absolute agreement. The variations from subject to subject are assessed through an F statistic with its respective statistical significance and also the effect size (partial eta squared (ηp2)), assuming Cohen's criteria for its interpretation (Cohen, 1992). In addition, intersubject variability (the variations of the subject with another subject) is added with an F statistic with its respective statistical significance and also the effect size (partial eta squared (ηp2)), assuming Cohen's criteria for its interpretation (Cohen, 1992).
Results
Table 1 shows the descriptive measures for PT, FS, EC, and PD for two measurements reported with a three-week margin. The results show that the PT averages show little variation (M1 = 20.710 and M2 = 20.120), the FS averages show a similar behavior (M1 = 18.900 and M2 = 17.760); as for EC the measures are quite similar (M1 = 25.370 and M2 = 23.220). Likewise, the PD averages show the same state (M1 = 15.020 and M2 = 16.170). Finally, the skewness and kurtosis coefficients are below 1.5 which suggests that the variables present univariate normality.
Table 1: Descriptive statistics
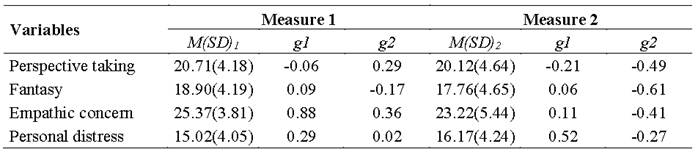
Notes: M: Mean; SD: Standard deviation; g1: Skewness coefficient; g2: Kurtosis coefficient.
Analysis of variances
Table 2 shows the results of the repeated measures ANOVA for two factors. The results of the FS dimension show that, at the intrasubject level, no statistically significant differences were found and that the effect size is non-existent (F = 0.531; p > .05; ηp 2 =0.013). However, in the intersubject effect test, the variations are statistically significant and the magnitude of the differences is large (F = 1327.275; p < .001; ηp 2 = 0.971). Regarding the FS dimension, the intrasubject effect test shows that there are no statistically significant differences and the effect size is not significant (F = 2.832; p > .05; ηp 2 = 0.066). Whereas the intersubject effect test indicates that the individual-group variations are statistically significant and the magnitude of these is large (F = 928.659; p < .001; ηp 2 = 0.959). The results in EC indicate that there are no statistically significant intrasubject differences, reaching a very small effect size (F = 9.156; p > .05; ηp 2 = 0.186). Meanwhile, statistically significant differences were found at the intersubject level, being the magnitude of these differences large (F = 1327.275; p < .001; ηp 2 = 0.973). Finally, in the PD dimension, the results at the intrasubject level reflect that there are no statistically significant differences and that the effect size is not significant (F = 3.800; p > .05; ηp 2 = 0.087). Whereas the intersubject effect test indicates that the variations are statistically significant and that the magnitude of these is large (F = 729.928; p < .001; ηp 2 = 0.948).
Table 2: Intra and intersubject effect test
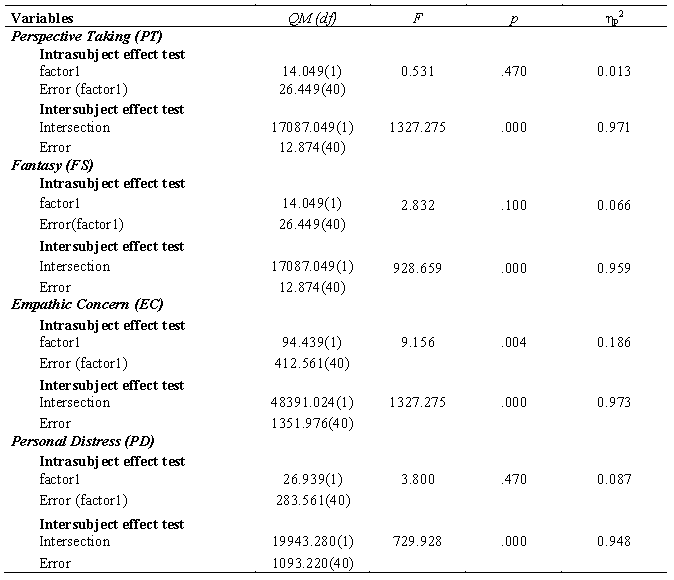
Notes: QM: Quadratic Mean; F: Repeated Measures ANOVA Test Statistic; p: Statistical Significance; ηp2: Partial Eta Squared. Intrasubject Effect Test: It assesses the variability of the same measures among people. Intersubject Effect Test: It assesses the variability between the same measures among people.
Temporal Stability of the Measure
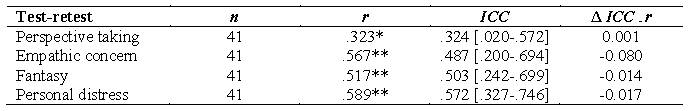
From the repeated measures ANOVA procedure, the QM: Quadratic mean of the scores and the MSE: Sum of one-way mean squared errors, which are necessary elements for the calculation of the ICC, with their respective confidence intervals at 95 %, were obtained . Likewise, the Pearson's product-moment correlation coefficients (r) are presented with the respective statistical significance (Table 3). The ICC - r coefficients are compared. From them, the delta between these coefficients was calculated, obtaining changes above 0.001.
Discussion
The ICC is an agreement index for continuous data; it assesses the size of the variance components between and within groups (Davis & Joseph, 2016; Shoukri, 2004). It also describes the proportion of the total variance which is explained by differences between scores and instruments (Mandeville, 2005). According to Hazra & Gogtay (2016), the ICC is developed within the analysis of variance and its calculation is based on the true (between subjects) variance and the measurement error variance, produced during the repeated measurement (Hazra & Gogtay, 2016; Manterola et al., 2018).
In this sense, the purpose of this research was to carry out a theoretical review of the applicability of the ICC to estimate the temporal stability of the scores of the measurement instruments. For this purpose, a longitudinal study of two measurements of IRI scores was conducted. These were then analyzed from a traditional perspective by means of a bivariate analysis with Pearson's correlation coefficient. Meanwhile, in the second approach, the analysis comprises a repeated measures analysis of variance (ANOVA).
It is worth mentioning that the evidence of reliability by the temporal stability method (test-retest) has already been used in the psychometric analysis of the IRI. For example, it has been used in studies in Spanish (Carrasco, Delgado, Barbero, Holgado & Del Barrio, 2011), Belgian (De Corte et al., 2007) and Chilean (Fernández, Dufey & Kramp, 2011) populations in which cases a test-retest correlation between moderate and high was found.
On the other hand, the Pearson product-moment correlation coefficients indicate that there is a relationship between these scores. However, this does not indicate that there is concordance between the measures, which has already been quite discussed in the bibliography (Davis & Joseph, 2016; Koo & Li, 2016; Shoukri, 2004). Moreover, as it is a linear calculation procedure, the interpretations are biased and there is a risk of overestimation (Hazra & Gogtay, 2016; Manterola et al., 2018). In turn, the repeated measures ANOVA provides the inputs for the calculation of the ICC which, due to its non-linear nature, constitutes an adjusted measure of concordance between measurements. As a result, it was identified that the four dimensions of the IRI (PT, EC, FS and PD) do not present a major difference in the scores within the group (intrasubject), showing non-significant differences with non-existent effect magnitudes. However, when analyzing the variations between groups, it could be seen that there were statistically significant differences, with large effect sizes.
Thus, it was possible to corroborate the practical usefulness of the calculation of the ICC because it not only provides information about the relationship between the two measures, but also provides information about the fulfillment of the assumptions of no intra and intergroup variations. These allow the estimation of the measurement error (Pita & Pértegas, 2004).
Likewise, when comparing the Pearson and ICC coefficients, it could be seen that the former are slightly higher. Furthermore, they are interpreted as significant and very significant correlations, but this does not imply that the variances have been analyzed, and, therefore, the concordance itself is not being assessed. What this coefficient expresses is the product-moment relationship between two measurements, disregarding the inter and intrasubject variation (Shoukri, 2004; Shrout & Fleiss, 1979).
Additionally, to evaluate whether the changes between the correlation coefficients were significant, the differentials (Δ) were calculated and Byrne’s criterion (2008) was considered to determine the measurement invariance. It can be seen that, with the exception of the PT dimension, these differences are significant in the remaining dimensions, which is evidence of the overestimation that usually occurs when using Pearson's correlation coefficient as a concordance statistic.
Regarding the estimation method used, it is important to emphasize that the test-retest procedure has been previously used in other studies. Such is the case of the research by Carrasco et al. (2011) where the temporal stability of the IRI was analyzed in a sample of Spanish adolescents in which Pearson’s product-moment correlations, which range from 0.44 to 0.65, after a one-year interval, were reported. Similarly, Fernández et al. (2011) reported that Pearson’s product-moment correlations higher than 0.70 were found after a 60-day interval in Chilean university students. These studies indicate that the examined construct is not subject to random fluctuations (Reidl-Martinez, 2013); on the contrary, it seems to be quite stable over time. Nevertheless, despite the fact that the time intervals used in these precedents are different from those of this research, it is necessary to emphasize that these have been established, in accordance with the criteria suggested by the bibliography (Martínez, 2005). The foregoing is indicated as a reference to highlight that the findings of the research do not respond to an anomalous behavior of the construct, nor to some other resulting aspect, typical of the task performed (Medrano & Pérez, 2019).
An important aspect is related to the applicability of the procedure for calculating the ICC since this is not only limited to the estimation of the temporal stability of the scores of an instrument, therefore, being possible to use it in quasi-experimental studies (more than one measurement). In these designs, the related t or the Wilcoxon rank-sum are commonly used. These are estimates that only express the specific difference between before-after and not the intra and intersubject variation as a product of the effect of a factor (intervention program) (Abad et al., 2011).
An important limitation has to do with the sample size and the type of sampling which restricts the generalizability of the results. However, given that in this case the aim is to expose the analysis technique, the sample size does not affect this. It is also necessary to demonstrate the applicability of the ICC in other procedures such as validation by expert judgement in which case the demonstration to yield more precise estimates than other coefficients would be expected, such as Aiken’s V.
Finally, it is important to emphasize that recent psychometric studies include within their reliability measures the test-retest procedure or the temporal stability of the measure (Correa-Rojas, Grimaldo & Del Rosario-Gontaruk, 2020; Lascurain, Lavandera & Manzanares, 2017). This as a complement to internal consistency which is necessary, especially, if it is intended to use these measures in longitudinal studies (Abad et al., 2011; Muñiz, 2018) to ensure that they do not constitute a source of systematic error.
REFERENCES
Abad, F., Olea, J., Ponsoda, V. & García, C. (2011). Medición en ciencias sociales y de la salud. Editorial Sintesis. [ Links ]
Aiken, L. (1980). Content validity and reliability of single items or questionnaries. Educational and Psychological Measurement, 40(1), 955-959. [ Links ]
Aiken, L. (1985). Three coefficients for analyzing the reliability and validity or ratings. Educational and Psychological Measurement, 45(1), 131-142. [ Links ]
American Educational Research Association (AERA), American Psychological Association (APA) & National Council on Measurement In Education (NCME). (2018). Estandares para pruebas educativas y psicologicas. Washington: American Educational Research Association. [ Links ]
Bartko, J. J. (1994). Measures of agreement: A single procedure. Statistics in Medicine, 13(5-7), 737-745. doi: https://doi.org/10.1002/sim.4780130534 [ Links ]
Benavente, A. P. (2009). Medidas de acuerdo y desacuerdo entre jueces. Universidad de Murcia. [ Links ]
Byrne, B. M. (2008). Testing for multigroup equivalence of a measuring instrument: A walk through the process. Psicothema, 20(4), 872-882. [ Links ]
Camacho-Sandoval, J. (2008). Coeficiente de concordancia para variables continuas. Acta Médica Costarricense, 50(4), 211-212. [ Links ]
Cascaes da Silva, F., Gonçalves, E., Valdivia Arancibia, B. A., Graziele Bento, S., Da Silva Castro, T. L., Soleman Hernandez, S. S. & Da Silva, R. (2015). Estimadores de consistencia interna en las investigaciones en salud: el uso del coeficiente alfa. Revista Peruana de Medicina Experimental y Salud Pública, 32(1), 129. doi: https://doi.org/10.17843/rpmesp.2015.321.1585 [ Links ]
Carrasco, M. A., Delgado, B., Barbero, M., Holgado, F. & Del Barrio, M. (2011). Propiedades psicométricas del Interpersonal Reactivity Index (IRI) en población infantil y adolecente española. Psicothema, 23(4), 824-831. [ Links ]
Cerda, J. & Villarroel, L. (2008). Evaluación de la concordancia inter-observador en investigación pediátrica: Coeficiente de Kappa. Revista Chilena de Pediatria, 79(1), 54-58. [ Links ]
Cohen, J. (1960). A Coefficient of Agreement for Nominal Scales. Educational and Psychological Measurement, 20(1), 37-46. doi: https://doi.org/10.1177/001316446002000104 [ Links ]
Cohen, J. (1992). Statistical Power Analysis. Current Directions in Psychological Science, 1(3), 98-101. doi: https://10.1111/1467-8721.ep10768783 [ Links ]
Cortés, É., Rubio, J. & Gaitán, H. (2010). Métodos estadísticos de evaluación de la concordancia y la reproducibilidad de pruebas diagnósticas. Revista Colombiana de Obstetricia y Ginecología, 61, 247-255. [ Links ]
Correa-Rojas, J., Grimaldo, M. & Del Rosario-Gontaruk, S. (2020). Propiedades psicometricas d de la Fear of Missing Out Scale en universitarios peruanos. Revista Aloma, 28(2), 113-120. doi: https://doi.org/10.51698/aloma.2020.38.2.113-120 [ Links ]
Colegio del Psicólogo del Perú. (2017). Código de Ética y Deontología. Lima: Autor. [ Links ]
Davis, M. H. (1983). Measuring individual differences in empathy: Evidence for a multidimensional approach. Journal of Personality and Social Psychology, 44(1), 113-126. doi: https://doi.org/10.1037/0022-3514.44.1.113 [ Links ]
Davis, M. D. & Joseph, J. (2016). Determining agreement using rater characteristics. Journal of Biopharmaceutical Statistics, 26(4), 619-630. doi: https://doi.org/10.1080/10543406.2015.1052490 [ Links ]
De Corte, K., Buysse, A., Verhofstadt, L. L., Roeyers, H., Ponnet, K. & Davis, M. H. (2007). Measuring Empathic Tendencies: Reliability And Validity of the Dutch Version of the Interpersonal Reactivity Index. Psychologica Belgica, 47(4), 235-260. doi: http://doi.org/10.5334/pb-47-4-235 [ Links ]
Domínguez, S. & Merino, C. (2015). Sobre el reporte de confiabilidad del CLARP-TDAH, de Salamanca (2010). Revista Latinoamericana de Ciencias Sociales, Niñez y Juventud, 13(2). [ Links ]
Esquivel, C. G., Velasco, V. M., Martinez, E., Barbachano, E., González, G. & Castillo, C. E. (2006). Coeficiente de correlación intraclase vs correlación de Pearson de la glucemia capilar por reflectometría y glucemia plasmática. Medicina Interna de Mexico, 22(3), 165-171. [ Links ]
Esteban-Guitart, M., Rivas, M. J. & Pérez, M. (2012). Empatía y tolerancia a la diversidad en un contexto educativo intercultural. Universitas Psychologica, 11(2), 415-426. [ Links ]
Fernández, A. M., Dufey, M. & Kramp, U. (2011). Testing the psychometric properties of the Interpersonal Reactivity Index (IRI) in Chile: Empathy in a different cultural context. European Journal of Psychological Assessment, 27(3), 179-185. doi: https://doi.org/10.1027/1015-5759/a000065 [ Links ]
Fisher, R. A. (1954). Statistical Methods for Research Workers. Oliver and Boyd. [ Links ]
Guilford, J. P. (1954). Psychometric methods (2ª ed). Bombay -New Deli: Tata McGraw-Hill [ Links ]
Hambleton, R. K. (1984). Validating the test scores. En R. A. Berk (Ed.), A guide to critterion referenced test construction (pp. 199-230). Baltimore: Johns Hopkins University Press. [ Links ]
Hair, J., Anderson, R., Tatham, R. & Black, W. (2010). Analisis multivariante (2ª ed.). Madrid: Pearson Prentice Hall. [ Links ]
Haggard, E. A. (1958). Intraclass correlation and the analysis of variance. Holt. [ Links ]
Hazra, A. & Gogtay, N. (2016). Biostatistics series module 6: Correlation and linear regression. Indian Journal of Dermatology, 66(1). 593-601. doi: https://doi.org/10.4103/0019-5154.193662 [ Links ]
Hernández-Nieto, R. (2011). Instrumentos de recolección de datos en ciencias sociales y ciencias biomédicas. Venezuela: Universidad de Los Andes. [ Links ]
International Test Commission. (2000). Guidelines on Test Use: Spanish Version. Recuperado de https://www.intestcom.org/files/guideline_test_use.pdf [ Links ]
Koo, T. K. & Li, M. Y. (2016). A Guideline of Selecting and Reporting Intraclass Correlation Coefficients for Reliability Research. Journal of Chiropractic Medicine, 15(2), 155-163. doi: https://doi.org/10.1016/j.jcm.2016.02.012 [ Links ]
Lascurain, P. C., Lavandera, M. C. & Manzanares, E. L. (2017). Propiedades psicométricas de la escala de actitudes sobre el amor (LAS) en universitarios peruanos. Acta Colombiana de Psicología, 20(2), 270-281. doi: https://doi.org/10.14718/ACP.2017.20.2.13 [ Links ]
Lawshe, C. H. (1975). A Quantitative Approach To Content Validity. Personnel Psychology, 28(4), 563-575. doi: https://doi.org/10.1111/j.1744-6570.1975.tb01393.x [ Links ]
Ledesma, R., Molina Ibañez, G. & Valero Mora, P. (2002). Análisis de consistencia interna mediante Alfa de Cronbach: un programa basado en gráficos dinámicos. Psico-USF, 3(7600), 143-152. doi: https://doi.org/10.1590/S1413-82712002000200003 [ Links ]
Livia, J. & Ortiz, M. (2014). Construcción de pruebas. Aplicaciones en ciencias sociales y de la salud. Lima: UNFV. [ Links ]
Martínez, R. (2005). Psicometría: Teoria de los test psicologicos y educativos. Editorial Sintesis Psicología. [ Links ]
Mandeville, P. (2005). El Coeficiente de Correlación Intraclase. Ciencia UANL, 8(3), 414-416. [ Links ]
Manterola, C., Grande, L., Otzen, T., García, N., Salazar, P. & Quiroz, G. (2018). Confiabilidad, precisión o reproducibilidad de las mediciones. Métodos de valoración, utilidad y aplicaciones en la práctica clínica. Revista Chilena de Infectología, 35(6), 680-688. doi: https://doi.org/10.4067/s0716-10182018000600680 [ Links ]
Medrano, L. & Pérez, E. (2019). Manual de psicometría y evaluación psicológica. Editorial Brujas. [ Links ]
Merino, C. & Livia, J. (2009). Intervalos de confianza asimétricos para el índice la validez de contenido: Un programa Visual Basic para la V de Aiken. Anales de Psicología, 25(1), 169-171. doi: http://revistas.um.es/analesps [ Links ]
Mestre, V., Frías, M. D. & Samper, P. (2004). La medida de la empatía: análisis del Interpersonal Reactivity Index. Psicothema, 16(2), 255-260. [ Links ]
Muñiz, J. (2010). Teoria Clasica de los Test. Madrid: Piramide. [ Links ]
Muñiz, J. (2018). Introducción a la psicometria. Madrid: Piramide . [ Links ]
Müller, R. & Büttner, P. (1994). A critical discussion of intraclass correlation coefficients. Statistics in Medicine, 13(23-24), 2465-2476. doi: https://doi.org/10.1002/sim.4780132310 [ Links ]
Pedrosa, I., Suárez-Álvarez, J. & García-Cueto, E. (2014). Content validity evidences: Theoretical advances and estimation methods. Acción Psicológica, 10(2), 3-18. doi: https://doi.org/10.5944/ap.10.2.11820 [ Links ]
Pérez, E. R. & Medrano, L. A. (2010). Análisis factorial exploratorio: bases conceptuales y metodológicas. Revista Argentina de Ciencias del Comportamiento (RACC), 2(1), 58-66. [ Links ]
Pita, S., & Pértegas, S. (2004). La fiabilidad de las mediciones clínicas: el análsiis de concordancia para variables numéricas. Atencion Primaria En La Red, (1995), 1-11. [ Links ]
Prieto, L., Lamarca, R. & Casado, A. (1998). El coeficiente de Correlación Intraclase. Medicina Clínica, (October), 142-145. [ Links ]
Raykov, T. (1997). Scale Reliability, Cronbach’s Coefficient Alpha, and Violations of Essential Tau-Equivalence with Fixed Congeneric Components. Multivariate Behavioral Research, 32(4), 329-353. doi: https://doi.org/10.1207/s15327906mbr3204_2 [ Links ]
Rodríguez-Miñón, P., Moreno, E. & Sanjuán, P. (2000). La matriz multimétodo-multirrasgo aplicada al estudio de la sensibilidad. Psicothema, 12(2), 492-495. [ Links ]
Rovinelli, R. J. & Hambleton, R. K. (1977). On the Use of Content Specialists in the Assessment of Criterion-Referenced Test Item Validity. Dutch Journal of Educational Research, 2, 49-60. [ Links ]
Reidl-Martínez, L. (2013). Confiabilidad en la medición. Investigación en Educación Médica, 2(6), 107-111. [ Links ]
Siegel, S. (1980). Estadísticas no Paramétricas Aplicadas a las Ciencias de la Conducta. México: Trillas. [ Links ]
Sireci, S. G. & Geisinger, K. F. (1992). Analyzing test content using cluster analysis and multidimen-siamal scaling. Applied Psychological Measurement, 16, 17-31. [ Links ]
Shieh, G. (2016). Choosing the best index for the average score intraclass correlation coefficient. Behavior Research Methods, 48(3), 994-1003. doi: https://doi.org/10.3758/s13428-015-0623-y [ Links ]
Shoukri, M. (2004). Measures of interobserver agreement. Estados Unidos: Chapman & Hall. [ Links ]
Shrout, P. E. & Fleiss, J. L. (1979). Intraclass correlations: uses in assessing rater reliability. Psychological Bulletin, 86(2), 420-428. doi: https://doi.org/10.1037/0033-2909.86.2.420 [ Links ]
Spence-Laschinger, H. (1992). Intraclass Correlations as Estimates of Interrater Reliability in Nursing Research. Western Journal of Nursing Research, 14(2), 246-251. [ Links ]
Turner, R. & Carlson, L. (2003). Indexes of Item-Objective Congruence for Multidimensional Items. International Journal of Testing, 3(2), 163-171. doi: https://doi.org/10.1207/s15327574ijt0302_5 [ Links ]
Vargha, P. (1997). Letter to the editor a critical discussion of intraclass correlation coefficients by R. Müller and P. Büttner. Statistics in Medicine, 16(7), 821-822. doi: https://doi.org/10.1002/(sici)1097-0258(19970415)16:7<821::aid-sim558>3.0.co;2-b [ Links ]
Ventura-León, L. (2017). El coeficiente Omega: un método alternativo para la estimación de la confiabilidad. Revista Latinoamericana En Ciencias Sociales, Niñez y Juventud, 15(1), 625-627. [ Links ]
Ventura-León, J. L. (2018). ¿Es el final del alfa de Cronbach? Adicciones, 31(1), 2016-2017. doi: https://doi.org/10.20882/adicciones.1037 [ Links ]
Viladrich, C., Angulo-Brunet, A. & Doval, E. (2017). A journey around alpha and omega to estimate internal consistency reliability. Anales de Psicologia, 33(3), 755-782. doi: https://doi.org/10.6018/analesps.33.3.268401 [ Links ]
Weir, J. (2005). Quantifying test-retest reliability using the intraclass correlation coefficient and the SEM. Journal of Strength and Conditioning Research, 19(1), 231-240. doi: https://doi.org/10.1007/978-3-642-27872-3_5 [ Links ]
Correspondence: Jossué Correa-Rojas, Universidad Peruana de Ciencias Aplicadas, Perú. E-mail: jossue.correa@upc.pe
How to cite: Correa-Rojas, J. (2021). Intraclass Correlation Coefficient: Applications to estimate the temporal stability of a measuring instrument. Ciencias Psicológicas, 15(2), e-2318. doi: https://doi.org/10.22235/cp.v15i2.2318
Authors' participation: a) Conception and design of the work; b) Data acquisition; c) Analysis and interpretation of data; d) Writing of the manuscript; e) Critical review of the manuscript. J. C-R. has contributed in a, b, c, d, e.
Received: October 10, 2020; Accepted: October 19, 2021
 Este es un artículo publicado en acceso abierto bajo una licencia Creative Commons
