


Serviços Personalizados
Journal

Artigo
 texto em
  Inglês (pdf)
 Artigo em XML
 Referências do artigo
Links relacionados
Compartilhar

 Permalink
Ciencias Psicológicas
versão impressa ISSN 1688-4094versão On-line ISSN 1688-4221
Cienc. Psicol. vol.14 no.1 Montevideo 2020 Epub 27-Abr-2020
https://doi.org/10.22235/cp.v14i1.2179
Original Articles
A psychometric analysis from the Item Response Theory: step-by-step modelling of a Loneliness Scale

1Instituto de Investigaciones, Facultad de Psicología, Universidad de Buenos Aires. Argentina
2 Consejo Nacional de Investigaciones Científicas y Técnicas (CONICET). Argentina sofiaaune177@hotmail.com
Keywords: item response theory; pedagogical; loneliness; graduated response model; advanced psychometrics
Palabras Clave: teoría de la respuesta al ítem; pedagógico; soledad; modelo de respuesta graduada; psicometría avanzada
Palavras-chave: teoria da resposta ao item; pedagógico; solidão; modelo de resposta graduada; psicometria avançada
Item Response Theory
It is currently agreed among psychometricians that the Classical Test Theory (CTT) has certain limitations (Attorresi, Lozzia, Abal, Galibert, & Aguerri, 2009). These include (a) the fact that all measures obtained (e.g., Cronbach alpha) depend on the particular samples of individuals who responded to the instrument, (b) the fact that instruments with different difficulty and discrimination indices yield different results for the same individuals, and (c) the fact that, if the same construct is measured by two or more different tests, the results are not measured on the same scale. Furthermore, the linear item-construct relationship that the CTT entails may not be very realistic in many cases.
It has often been claimed (e.g., Paek & Cole, 2019) that the Item Response Theory (IRT) solves many of the CTT limitations, although at the cost of greater mathematical and computational demands, the requirement for a large sample, and more demanding assumptions. However, with advances in computer and programming capacity, experts in many fields have gained access to the benefits of IRT.
The IRT is a set of models aimed at explaining the relationship between observed responses to an item, which is part of a scale, and to an underlying construct (Cappelleri, Lundy, & Hays, 2014). To this end, IRT models use non-linear mathematical functions, often the logistic function, that describe the association between the participant's level for a latent θ trait and the probability of selecting a certain response -or response category- to an item. In the example provided in this study, the latent θ trait is the level of loneliness.
The first matter to consider in the selection of an IRT model is the categorisation of the item response options. If this categorisation results in a dichotomy, the most commonly used models are One-Parameter (1PLM), Two-Parameter (2PLM), or Three-Parameter (3PLM) Logistic Models. If three or more response categories are involved, IRT models for polytomous response items will be appropriate. If the polytomous response is not ordered, the Nominal Response Model is used (Bock, 1997). At present, the most commonly used models for ordered polytomous response are the Graded Response Model (GRM; Samejima, 1969; 2016) and its restricted version (Reduced GR Model, RMRG;Toland, 2013), the Generalized Partial Credit Model (GPCM; Muraki, 1992), and the Partial Credit Model (PCM; Masters, 1982, 2016). Even though the choice among IRT polytomous models has been considered a matter of researcher preference (e.g., Edelen & Reeve, 2007), there are currently objective methods to compare the relative fit between models in relation to a certain dataset (e.g., DeAyala, 2009; Toland, 2013) in order to determine which one is the most appropriate in each case.
In addition, a very important aspect of providing assurance about the validity of the scale is the analysis of the differential item functioning (DIF). The existence of DIF items undermines unidimensionality when a single trait is to be measured, which jeopardises validity. DIF studies usually compare between two groups called Reference and Focal groups. If an item has DIF, in this case, it implies that equal scorings for the item represent different levels of loneliness between the two groups, which is definitely not a desirable feature in a psychometric technique.
The Buenos Aires Loneliness Scale
The fundamental purpose of this article is to present, in an accessible format, the steps that need to be followed in order to conduct, as well as interpret and present the results from, the application of IRT modelling. The general steps to carry out an IRT analysis include (a) explaining the subject of study, (b) considering the relevant models, (c) testing model assumptions and comparing their relative fit, and (d) applying the selected model and interpreting the results. In order to exemplify this IRT analysis in a didactic way, the Buenos Aires Loneliness Scale ((BALS); Auné, Abal & Attorresi, 2019) has been chosen as a psychometric technique to be modelled.
It is a new instrument for evaluating the self-perception of loneliness. It is a short, unidimensional test consisting of seven polytomous response items that were formulated based on group interviews with general adult and old-age residents of the Buenos Aires Metropolitan Area (BAMA). Although a national scale to measure loneliness already existed, a study was conducted and showed that item responses to such scale were influenced by response direction (Auné, Abal & Attorresi, 2020).
Initially, evidence of content validity was obtained through the inter-rater agreement technique using the Aiken's Validity index (Aiken, 1980, 1985), and a pilot study was conducted. An Exploratory Factor Analysis was carried out excluding the items that met one or more of the following criteria: a) significant skewness and kurtosis, b) high standardised residuals (> 2.58, Hair, Anderson, Tatham, & Black, 1999), and c) factor loadings of .40 and below. Once the scale was depurated, evidence was obtained of its convergent validity with the Argentine version of the UCLA (Sacchi & Richaud de Minzi, 1997) and with the self-perception of loneliness levels, as well as evidence of discriminant validity in relation to social desirability. The data set internal consistency showed high suitability (Cronbach alpha = .80, ordinal alpha = .87). Furthermore, gender-based Differential Item Functioning studies were carried out and showed that the items were DIF-free in this respect.
Objectives
The general objective of this study is using IRT to exemplify the modelling of a polytomous response psychometric scale by analysing the items that form the BALS.
The specific objectives are:
a- Verifying the assumptions of unidimensionality and local independence for IRT models.
b.- Comparing between GRM, RGRM, GPCM, and PCM models and determining which one is the most appropriate to calibrate the responses to the items that form the BALS.
c.- Exploring the existence of Differential Item Functioning according to the participants' marital status using the selected IRT model.
d.- Calibrating BALS items with the parameters of the selected model.
e.- Analysing for which levels of loneliness the BALS proves more accurate.
Method
Participants
The data was collected from a non-probabilistic and incidental sample of 509 participants. 53 % of the participants were women residing in the Buenos Aires Metropolitan Area. Their average age was 44.3 (SD = 13); 47.2 % stated they were married or in a lawful union, 25 % were single, 15.3 % were divorced, 4.7 % were widowed, while 7.9 % chose the "Other" option.
Procedure
The data was gathered using a non-probabilistic sample design defined by accessibility. The protocol was administered in an online interview format, which included anonymous informed consent. In addition, it was clarified that data use was exclusively for research purposes and that participation was completely voluntary, with the possibility of interrupting it at any point.
Instruments
Sociodemographic Questionnaire. It consists of a series of ad hoc questions for the present research that inquired about gender, age, marital status, nationality and place of residence.
Buenos Aires Loneliness Scale ((BALS); Auné, et al., 2019). It is a seven-item instrument, where the response modality is specified using a Likert scale with four options (1 = Completely disagree, 2 = Slightly Agree, 3 = Fairly Agree, 4 = Completely Agree).
Satisfaction of IRT Model Assumptions
The verification of the unidimensionality assumption required by the GRM, GRMR, GPCM, and PCM models that were to be compared was carried out through the optimal implementation of parallel analysis (Timmerman, & Lorenzo-Seva, 2011) and the variance percentage explained by the first factor. Both indices are obtained by Exploratory Factor Analysis (Ferrando & Lorenzo-Seva, 2017a).
In addition to the unidimensionality assumption, the GRM, GRMR, GPCM, and PCM models also assume that, given a fixed θ trait level, item responses are independent of one another. The X2 LD index (Chen & Thissen, 1997) is calculated for each item pair, and a score over 10 indicates a failure to satisfy the assumption.
Comparison of IRT Models
Multiple methods were used to compare the relative fit of the GRM, RGRM, GPCM, and PCM models as described by De Ayala (2009) and Toland (2013). On the one hand, the Likelihood Ratio Test (LRT) was implemented, which compares two nested models and which was used in conjunction with the statical test R 𝛥 2 (Haberman, 1978). In this case, the RGRM model is a restriction of the GRM, PCM, and GPCM models. The LRT examines whether the complexity of the complete model with unrestricted values for the a parameter is necessary to improve the model's fit. It adopts a χ2 distribution, where a non-significant χ 𝛥 2 statistic implies that the additional complexity of the unrestricted model is unnecessary to improve goodness of fit to the observed data. The statistic R 𝛥 2 measures by what percentage the complete model increases the explanation of item responses compared to the restricted model. The R 𝛥 2 is calculated as follows: (log likelihood of the restricted model - log likelihood of the complete model) / log likelihood of the restricted model (Toland, 2013).
On the other hand, the Akaike Information Criterion (AIC) and the Bayesian Information Criterion (BIC) were calculated for each model, where smaller values of AIC and BIC indicate a better relative fit. Finally, the global fit and the existence of item misfit in each model were analysed. Global fit was calculated with the M2 statistic (Maydeu Olivares & Joe, 2005, 2006) and the associated RMSEA index, considering RMSEA ≤ .05 as a good fit. The lower the values of the M2statistic, the better the fit. The S-χ2 index was calculated to determine whether each item is explained by a model (Orlando & Thissen, 2000, 2003). If the p-value associated with the S-χ2 index is higher than .01, it indicates a good fit (Toland, 2013).
Analysis of Differential Item Functioning
The existence of DIF by marital status was explored dividing the sample between those who were married or in a lawful union, on the one hand, and participants who selected other marital statuses, on the other. This analysis was carried out following the series of steps explained by Woods (2009). As a first step, each of the BALS items was verified using the modified Wald test (Cai, 2012; Cai, Thissen, & du Toit, 2011; Langer, 2008) considering the rest as anchors. Subsequently, a second step was carried out where an item with potential DIF was tested with anchoring in the responses to the most certainly DIF-free item, thus avoiding contamination.
Evidence within the IRT Framework
Evidence of reliability was obtained within the IRT framework through the Item Information Function (IIF) and the Test Information Function (TIF). The IIF indicates the accuracy of a certain item in measuring each θ trait level. The sum of all IIFs makes up the TIF, which provides information about the scale's reliability according to the θ trait level.
Software Used
The unidimensionality indices were obtained using the FACTOR 10.5 software (Ferrando & Lorenzo-Seva, 2017b). Local independence, DIF, and IRT modelling analyses were conducted using the IRTPRO 4.2 software (Cai et. al, 2011).
Results
Satisfaction of IRT Model Assumptions
The optimal implementation of parallel analysis indicated that the suggested number of factors is one, while the variance percentage explained by the first factor was 57.48 %. Therefore, the data can be considered essentially unidimensional. In the outputs of each of the GRM, RGRM, GPCM, and PCM models, the X2 LD index was less than 10 for each item pair. Therefore, for the four models, both unidimensionality and local independence assumptions can be considered satisfied.
Comparison of IRT Models
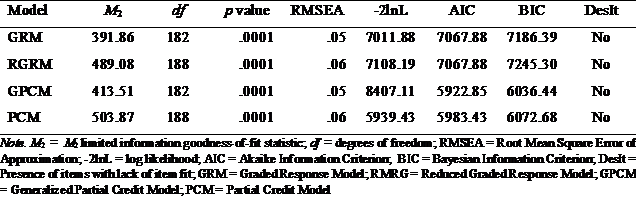
The fit indices for GRM, RGRM, GPCM, and PCM can be seen in Table 1. Although every model fitted at a global level, the GRM obtained lower values for the M2 statistic, log likelihood, AIC, and BIC. The LRT comparing the GRM and the RGRM indicated that the additional complexity of the complete model is necessary to improve fit to the data considering χ 𝛥 2 (6) = 7108.19 - 7011.88 = 96.31, p = 7.07x10⁻¹⁹. The relative change between these models was R 𝛥 2 = .0135, that is, the MRG provides a better explanation of the data than the MRGR by 1.35 %. Highly similar results are obtained when comparing GPCM and PCM. The LRT between the GPCM and the PCM resulted in χ 𝛥 2 (6) = 5939.43-5866.85 = 72.58, p = 1.21x10⁻¹³. In this case, R 𝛥 2 = .0122, indicating a 1.22 % better fit of the complete model. For every model, none of the items showed misfit, as the p-value associated with the S-χ2 index was higher than .01 for all the items.
Because a model with a free a parameter is necessary to improve both the fit and the explanation of the observed data, and because the GRM is the model showing the best relative fit, GRM is selected for the TRI modelling of the BALS item responses.
BALS Modelling with GRM
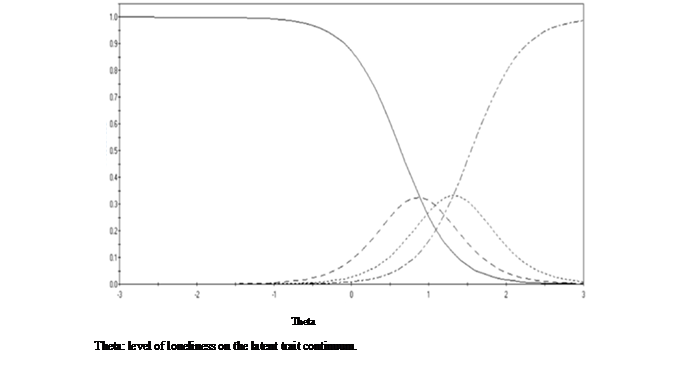
Of the four models, the GRM proved the most appropriate one. It assumes that a single θ -in this case, the loneliness level- non-linearly explains the item responses. Because the response options are four, an a slope parameter and three b m threshold parameters were calculated for each reagent. The a parameter provides information about the degree to which response categories distinguish between θ levels. Moreover, it has been compared against factorial loads, as it reflects the magnitude of the relationship between each scale item and the latent θ trait. Each b m parameter provides information about the loneliness level -θ- necessary for the probability of selecting the m response category or a higher one to be equal (.50) to the probability of selecting the lower categories. Thus, the item response options are separated into a series of dichotomies, in each of which the ML2P is applied. The IRCCCs represent the probability of selecting each response category according to the θ trait level.
Analysis of Differential Item Functioning
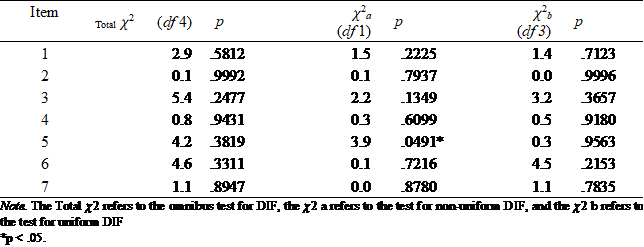
The results obtained after exploring the presence of DIF for each item using the rest of the items as anchors are shown in Table 2. The analyses suggested that item 5, I am completely out of any social group, was likely to present non-uniform gender-based DIF, even though the p-value was very close to the 0.5 limit. The second step of the Woods method (2009) was then implemented, taking item 2 as an anchor between the two groups. This item has the lowest Totalχ2 value, so it is assumed that it is the most DIF-free item. The statistically insignificant result from this second step indicated that item 5 does not exhibit DIF (𝜒2 a = 2.6, gl = 1, p =.1048). Therefore, all the items on the scale can be considered DIF-free regarding marital status.
Item calibration with the GRM
The results obtained after applying the GRM to the scale indicated that the model fitted both globally (M2 = 391.86; gl = 182; p = 0.0001; RMSEA = 0.05) and at item level (p associated to S-x2> .01). 28 parameters were estimated, the values of which are shown in Table 3.
Item threshold parameters are distributed across a relatively broad range for the latent trait, from -1.43 (b1 item 3) to 3.15 (b3 item 7). A relative heterogeneity of b1, can be observed, while b2 parameters are found at medium or high levels of the trait and b3 at even higher levels.
As for the a discrimination parameters, they presented values of 1.11 to 3.01. This indicates that the response categories are powerful in distinguishing between participants with different levels of loneliness, with a moderate discrimination capacity for items 3 and 7, high for item 6, and very high for items 1, 2, 4, and 5 (Baker & Kim, 2017).
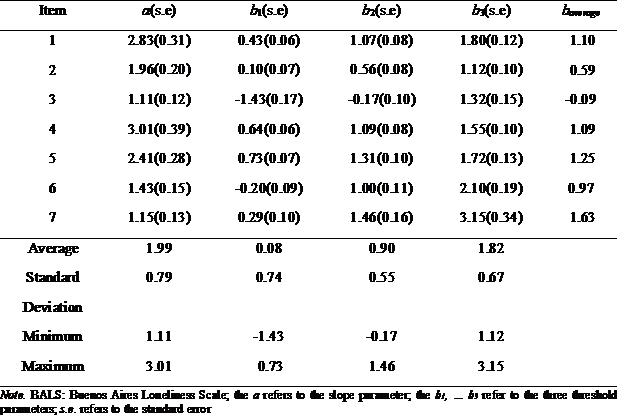
Figure 1 shows the IRCCCs of item 3, the one with the lowest a parameter. As it can be observed, the IRCCCs corresponding to the central response categories show a flattened form. For this item, even though all response options are most probable at some level of the trait, the Slightly Agree category is probable only within a narrow range. Given that the average b parameter is -0.09, this item can be considered medium-difficulty. A very low level for the trait is enough to select the Slightly Agree category or a higher one; a medium level is enough to select the Fairly Agree or Completely Agree categories over the previous two, and a very high level of the trait is necessary to select the top Completely Agree category. Therefore, it is feasible to say that the response categories behave in an expected manner.
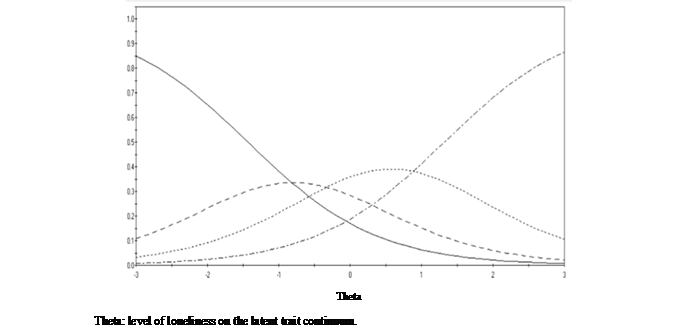
Figure 2 shows the IRCCCs of item 4, the one with the largest a parameter. In this case, the IRCCCs corresponding to the extreme response categories show a high form. Even though all response options are most probable at some level of the trait, the intermediate options are most probable only within a very short interval. Given that the average b parameter is 1.09, this item can be considered high-difficulty. Even though the response categories behave in an expected manner, this item would be suitable as part of a dichotomous test.
Evidence of Reliability
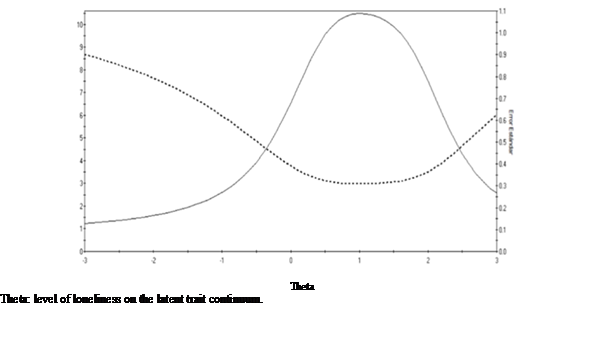
Table 4 shows specific values of the IIFs and TIF for certain levels of loneliness distributed along the continuum of the trait. For most of the items, as well as the complete test, there is evidence that they provide a higher level of information for medium and high levels of loneliness, while, in turn, the standard error decreases (standard error, s.e.). The items show certain parity at the maximum level of information they provide.
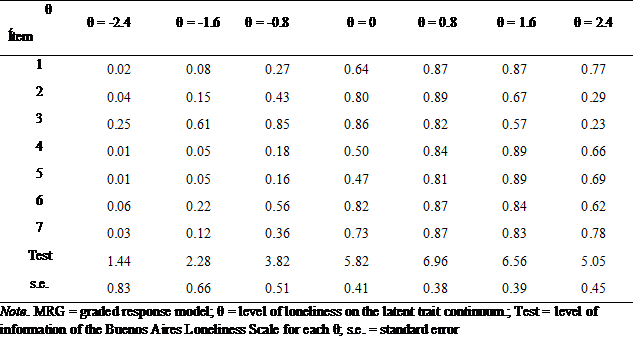
Figure 3 shows the TIF. According to the GRM, the TIF reached its maximum value of 6.9983 at θ = 1.00 with a minimum s.e. value at that 0.378 point. The level of information was higher in the medium and high levels of the trait, decreasing considerably in the low levels of the trait, as well as in the extremely high ones.
Discussion
This paper has shown how to carry out an IRT analysis in its different aspects, providing details that allow its replicability through a detailed description of the steps necessary to carry out this type of modelling. It is necessary to mention, for those researchers who want to pursue IRT analysis, that the IRTPRO software has a version for students that is free to download and which can be used for an initial approach to IRT analysis.
With respect to the obtained results, the GRM analysis of the BALS showed that the scale provides a higher degree of accuracy at medium and high levels of the trait. The measurement error increases substantially towards lower levels of loneliness. The discriminatory capacity, as well as the level of information reached, showed appropriate values for all the items that make up the BALS. New items incorporated into the BALS should require a low level of loneliness for the scale to provide similar accuracy when measuring different levels of the trait.
As for the analysis of the adequacy of the number of response options, the relatively distant values of the b m parameters indicate their adequacy. Furthermore, empirical and simulation-based results indicate that a four-option response design favours the balance between measurement accuracy and the goodness of fit of the IRT model (e.g. Abal, Auné, Lozzia & Attorresi, 2017; Lozano, García-Cueto & Muñiz, 2008).
In relation to a detailed analysis of the items, items 1, 4, and 5 provided the highest levels of information. Furthermore, the a slope parameter of these items is very high and the distances between the b m parameters are wide, indicating that the response categories are effective in discriminating between participants with different levels of loneliness. Even though the remaining items display acceptable psychometric quality, they are less informative than the previous ones.
The DIF analysis concluded that the Buenos Aires Loneliness Scale is DIF-free by marital status as well as by gender, as it had already been proven during its design (Auné et al., 2019). This shows the importance of DIF studies, which are not frequent, especially in the Latin American environment. The existence of items with DIF detracts from the validity of the interpretation of the scale scores; so it is necessary to test all the items that are incorporated into the scale in this way. In addition to marital status and gender, DIF can be analysed with respect to sociodemographic and even psychological variables, thus obtaining highly interesting results. In future studies, DIF will be analysed according to the participants' age and their level in the Empathic Behavior Scale (Auné et al., 2017a) and in the Argentine adaptation of the Lima Happiness Scale (Auné, Abal, & Aberresi, 2017b).
Another issue to be highlighted is the importance of comparing IRT models. It was observed that not all IRT models fitted equally to the empirically-obtained data, i.e., the responses to the Buenos Aires Loneliness Scale in this particular sample. The models apply different forms of segmentation of the polytomous item and use different procedures to calculate the response probabilities of the categories. For typical behaviour tests, the results of this study are in line with others where the GRM fitted better than the other compared models (e.g. Abal, 2013; Asún & Zuñiga, 2008).
REFERENCES
Abal, F. (2013). Comparación de modelos politómicos y dicotómicos de la Teoría de la Respuesta al Ítem aplicados a un test de Comportamiento Típico. Tesis de Doctorado, Facultad de Psicología de la Universidad de Buenos Aires. [ Links ]
Abal, F. J. P., Auné, S. E., Lozzia, G. S., & Attorresi, H. F. (2017). Funcionamiento de la categoría central en ítems de Confianza para la Matemática. Evaluar, 17(2), 18-31. [ Links ]
Aiken, L. R. (1980). Content validity and reliability of single items or questionnaires. Educational and Psychological Measurement, 40, 955-959. https://doi.org/10.1177/001316448004000419 [ Links ]
Aiken, L. R. (1985). Three coefficients for analyzing the reliability and validity of ratings. Educational and Psychological Measurement , 45, 131-142. https://doi.org/10.1177/0013164485451012 [ Links ]
Asún, R. & Zuñiga, C. (2008). Ventaja de los modelos politómicos de teoría de respuesta al ítem en la medición de actitudes sociales. El análisis de un caso. Psykhe, 17(2), 103-115. [ Links ]
Attorresi, H. F., Lozzia, G. S., Abal, F. J. P., Galibert, M. S., & Aguerri, M. E. (2009). Teoría de Respuesta al Ítem. Conceptos básicos y aplicaciones para la medición de constructos psicológicos. Revista Argentina de Clínica Psicológica, 18(2), 179-188. [ Links ]
Auné, S., Abal, F., & Attorresi, H. (2017a). Propiedades psicométricas de una prueba de conducta empática. Revista Iberoamericana de Diagnóstico y Evaluación Psicológica, 3(45), 47-56. https://doi.org/10.21865/RIDEP45.3.04 [ Links ]
Auné, S., Abal, F., & Attorresi, H. (2017b). Versión argentina de la Escala de Felicidad de Lima. Diversitas, 13(2), 201-214. [ Links ]
Auné, S., Abal, F., & Attorresi, H. (2019). Construction and psychometric properties of the Loneliness Scale in adults. International Journal of Psychological Research, 12(2), 82-90. http://dx.doi.org/10.21500/20112084.425782 [ Links ]
Auné, S., Abal, F., & Attorresi, H. (2020). Modeling of the UCLA Loneliness Scale According to the Multidimensional Item Response Theory. Current Psychology, 1-8. https://doi.org/10.1007/s12144-020-00646-y [ Links ]
Baker, F. B., & Kim, S. H. (2017). The Basics of Item Response Theory Using R. New York, NY: Springer. [ Links ]
Bock, R. D. (1997). The nominal categories model. In W. van der Linden & R.K. Hambleton (Eds.), Handbook of Modern Item response Theory (pp. 33-50). N.Y.: Springer. [ Links ]
Cai, L. (2012). flexMIRT: Flexible multilevel item factor analysis and test scoring (Computer software). Seattle, WA: Vector Psychometric Group, LLC. [ Links ]
Cai, L., Thissen, D., & du Toit, S. (2011). IRTPRO user's guide. Lincolnwood, IL: Scientific Software International. [ Links ]
Cappelleri, J. C., Lundy, J. J., & Hays, R. D. (2014). Overview of classical test theory and item response theory for the quantitative assessment of items in developing patient-reported outcomes measures. Clinical Therapeutics, 36(5), 648-662. https://doi.org/10.1016/j.clinthera.2014.04.006 [ Links ]
Chen, W., & Thissen, D. (1997). Local dependence indices for item pairs using item response theory. Journal of Educational and Behavioral Statistics, 22, 265-289. [ Links ]
De Ayala, R. J. (2009). The theory and practice of item response theory. New York, NY: Guilford. [ Links ]
Edelen, M. O., & Reeve, B. B. (2007). Applying item response theory (IRT) modeling to questionnaire development, evaluation, and refinement. Qual Life Res., 16(1), 5-18. http://dx.doi.org/10.1007/s11136-007-9198-0 [ Links ]
Ferrando, P. J., & Loranzo-Seva, U. (2017a). Assessing the quality and appropriateness of factor solutions and factor score estimates in exploratory item factor analysis. Educ. Psychol. Measur., 1-19. https://doi.org/10.1177/0013164417719308 [ Links ]
Ferrando, P. J., & Lorenzo-Seva, U. (2017b). Program FACTOR at 10: Origins, development and future directions. Psicothema, 29, 236-240. [ Links ]
Haberman, S. J. (1978). Analysis of qualitative data: Vol. 1: Introductory topics. New York, NY: Academic Press. [ Links ]
Hair, J. F., Anderson, R.E., Tatham, R. L. & Black, W. C. (1999). Análisis Multivariante. Madrid, España: Prentice Hall Iberia. [ Links ]
Langer, M. (2008). A reexamination of Lord’s Wald test for differential item functioning using item response theory and modern error estimation (Unpublished doctoral dissertation). University of North Carolina, Chapel Hill. [ Links ]
Lozano, L. M., García-Cueto, E. & Muñiz, J. (2008). Effect of the Number of Response Categories on the Reliability and Validity of Rating Scales. Methodology, 4(2), 73-79. https://doi.org/10.1027/1614-2241.4.2.73 [ Links ]
Masters, G. N. (1982). A Rasch model for partial credit scoring. Psychometrika, 47(2), 149-174. [ Links ]
Masters, G. N. (2016). Partial Credit Model. En W. J. van der Linden (Ed.). Handbook of Item Response Theory, Volume 1: Models (pp. 109-126). Boca Raton: Chapman & Hall/CRC. [ Links ]
Maydeu Olivares, A., & Joe, H. (2005). Limited and full information estimation and testing in 2n contingency tables: A unified framework. Journal of the American Statistical Association, 100, 1009-1020. http://dx.doi.org/10.1198/016214504000002069 [ Links ]
Maydeu Olivares, A., & Joe, H. (2006). Limited information goodness-of-fit testing in multidimensional contingency tables. Psychometrika , 71, 713-732. http://dx.doi.org/ 10.1007/s11336-005-1295-9 [ Links ]
Muraki, E. (1992). A generalized partial credit model: Application of an EM algorithm, Applied Psychological Measurement, 16, 159-176. https://doi.org/10.1002/j.2333-8504.1992.tb01436.x [ Links ]
Orlando, M., & Thissen, D. (2000). Likelihood-based item fit indices for dichotomous item response theory models. Applied Psychological Measurement , 24, 50-64. https://doi.org/10.1177/01466216000241003 [ Links ]
Orlando, M., & Thissen, D. (2003). Further investigation of the performance of S-χ2: An item fit index for use with dichotomous item response theory models. Applied Psychological Measurement , 27, 289-298. https://doi.org/10.1177/0146621603027004004 [ Links ]
Paek, I., & Cole, K. (2019). Using R for Item Response Theory Model Applications. New York, NY: Routledge. [ Links ]
Sacchi, C. & Richaud de Minzi, M. C. (1997). La Escala Revisada de Soledad de UCLA: Una adaptación argentina. Rev. Argent. Clín. Psicol, 6(1), 43-53. [ Links ]
Samejima, F. (1969). Estimation of latent ability using a response pattern of graded scores. Psychometrika monograph supplement, 17(4), 2. http://dx.doi.org/10.1002/j.2333-8504.1968.tb00153.x [ Links ]
Samejima, F. (2016). Graded response models. In Wim J. van der Linden (Ed.), Handbook of Item Response Theory , Volume One (pp. 123-136). Chapman and Hall/CRC. [ Links ]
Timmerman, M. E., & Lorenzo-Seva, U. (2011). Dimensionality assessment of ordered polytomous items with parallel analysis. Psychological Methods, 16, 209-220. http://dx.doi.org/10.1037/a0023353 [ Links ]
Toland, M. (2013). Practical guide to conducting an item response theory analysis. The Journal of Early Adolescence, 34(1), 120-151. https://doi.org/10.1177/0272431613511332 [ Links ]
Woods, C. (2009). Empirical selection of anchors for tests of differential item functioning. Applied Psychological Measurement , 33(1), 42-57. https://doi.org/10.1177/0146621607314044 [ Links ]
Funding: The research was supported by UBACyT 2018 code 20020170100200BA and 20020170200001BA research grants from Faculty of Psychology, University of Buenos Aires and also National Agency for Scientific and Technological Promotion (ANPCyT) PICT-2017-3226
Authors' participation: a) Conception and design of the work; b) Data acquisition; c) Analysis and interpretation of data; d) Writing of the manuscript; e) Critical review of the manuscript. S.E.A. has contributed in a,b,c,d,e; F.J.P.A. in a,b,c,d,e; H.F.A. in a,b,c,d,e.
How to cite this article: Auné, S. E., Abal, F.J.P., & Attorresi, H.F. (2020). A psychometric analysis from the Item Response Theory: step-by-step modelling of a Loneliness Scale. Ciencias Psicológicas, 14(1), e-2179. doi: https://doi.org/10.22235/cp.v14i1.2179
Received: November 06, 2018; Accepted: April 27, 2020
 Este es un artículo publicado en acceso abierto bajo una licencia Creative Commons
