


Servicios Personalizados
Revista

Articulo
 Inglés (pdf)
 Articulo en XML
 Referencias del artículo
Links relacionados
Compartir

 Permalink
CLEI Electronic Journal
versión On-line ISSN 0717-5000
CLEIej vol.18 no.3 Montevideo dic. 2015
Digi-Clima Grid: image processing and distributed computing for recovering historical climate data
Sergio Nesmachnow, Gabriel Usera
Universidad de la República
Montevideo, Uruguay, 11300
and
Francisco Brasileiro
Universidade Federal de Campina Grande
Campina Grande, Brasil, 58400-000
This article describes the Digi-Clima Grid project, whose main goals are to design and implement semi-automatic techniques for digitalizing and recovering historical climate records applying parallel computing techniques over distributed computing infrastructures. The specific tool developed for image processing is described, and the implementation over grid and cloud infrastructures is reported. An experimental analysis over institutional and volunteer-based grid/cloud distributed systems demonstrate that the proposed approach is an efficient tool for recovering historical climate data. The parallel implementations allow to distribute the processing load, achieving accurate speedup values.
Abstract in Spanish
Este artículo describe el proyecto Digi-Clima Grid, cuyos principales objetivos son diseñar e implementar técnicas semiautomáticas para para digitalizar y recuperar datos históricos del clima aplicando computación paralela sobre infraestrcuturas de memoria distribuida. Se describe la herramienta específica desarrollada para el procesamiento de imágenes, y su implementación sobre infraestrcuturas grid y cloud. El análisis experimental realizado sobre plataformas grid/cloud institucionales y de computación voluntaria demostró que el enfoque propuesto consiste en un método eficiente para recuperar datos histórico climáticos. Las implementaciones paralelas permitieron distribuir la carga de trabajo, obteniendo eficientes valores de speedup..
Keywords: Distributed computing, image processing, recovering climate data.
Keywords in Spanish: recuperación de datos climáticos; computación distribuida; procesamiento de imágenes
Received: 2015-08-24 Revised: 2015-11-10 Accepted: 2015-11-20
1. Introduction
Studying the behavior of climate variables through time is crucial for many different fields of science, and also for agriculture and industrial production, disaster prediction and warning systems, among many other applications. The potential impact of predicting the climate behavior is very important in the short-term for decision making, i.e. in agriculture, but also for long-term situations, i.e. to know whether a certain island will sink into the ocean in the next hundred years or not. For specific applications, such as the bombing control on sewer systems for large cities, or the prediction of water level for a river in a flood warning system, usually is it enough to know the actual conditions of meteorological variables or, in the worst scenario, some recent past values are required. However, many other important problems require knowing long-term series of climate variables records, and when considering the climate time scale, long-term could mean about 30 years and even more.
Taking into account the previous considerations, the scientific community is currently interested on developing methodologies to recover climate data stored through the years. When the search goes back in time, climate records are very scarce and more difficult to recover. Furthermore, the preservation of any climate record gathered before the digital era is in danger of destruction.
In Uruguay, the systematic and extensive recording of climate variables has been performed by the Uruguayan Institute of Meteorology (Instituto Uruguayo de Meteorología, INUMET, formerly National Direction of Meteorology) from the early years of the 20th century. Most of records are stored in paper. All this data is of great value for science, but it has limited utilization in nowadays computerized systems, mainly due to the paper-format storage. Of course, the preservation of the records is in danger: risk of fire, high humidity, or simple deterioration of the media are serious possibility that something harmful could happen and the data will be lost.
In order to make the climate information applicable for a proper use on nowadays systems, a transcription process of the historical records is needed. In some cases, climate records have information stored in natural language or handwritten numbers, and optical character recognition (OCR) techniques are needed when recovering the information. In other cases, just like in the case of pluviometer, the information has been recorded by using a non-digital equipment, but the format is more easily recognizable by computers. Thus, the transcription process can be automated by using digitalization and software.
The previously described approach is the one applied by the Digi-Clima project [1], which proposes developing an efficient image processing application for digitalizing the scanned output of pluviometers, and storing the digital data in a database of historical climate records for Uruguay. The historical records to process are stored in graph paper bands containing the pluviometer output for a certain time period, which can be divided into intervals, with each one looking like a continuous growing monotone function.
However, the image processing is not straightforward. By using ad-hoc techniques, the Digi-Clima application described in this article requires about 10-15 minutes of wall-clock time when executed in a standard computer, in order to process the image corresponding to one day of pluviometer records. Considering that more than a century of pluviometer records are available from meteorological stations situated in different locations across the country, applying high computing performance techniques is a wise choice?and in some cases a must-needed option, such as in the capital city Montevideo, with almost one third of the whole recordsin order to get the results of the processing in reasonable execution times.
The Digi-Clima Grid project [2] proposes applying distributed computing techniques for efficiently performing the digitalization of historical climate records, by using grid and cloud computing platforms. The grid/cloud systems used in the experimental evaluation of the proposed solution include: i) Cluster FING [3] from Universidad de la República, Uruguay; ii) the Latin-American/European grid infrastructure from the GISELA project [4]; and iii) the Latin-American grid/cloud volunteer-computing platform from the Ourgrid project [5].
The Digi-Clima Grid project was carried out 20122014 by the research groups on Computational Fluid Mechanics, Superficial Hydrology, and Numerical Computing Center at Engineering Faculty, Universidad de la República, Uruguay; and the Department of Computer Systems at Universidade Federal de Campina Grande (UFCG), Brazil. The project has been partly funded and received financial support from the World Meteorological Organization; the National Direction of Water, Uruguay, the Departmental Government of Montevideo, Uruguay, and the Latin American and Caribbean Collaborative ICT Research Federation (LACCIR).
This article summarizes the main research outcomes from the Digi-Clima and Digi-Clima Grid projects, describing the image-processing approach and highlighting the main experimental results for the distributed implementation over grid and cloud platforms, extending the results reported in previous conference papers [6,7].
The rest of the article is organized as follows. Section 2 introduces the Digi-Clima project, including a description of the problem of recovering historical climate records and the image processing tools proposed for digitalizing rain records. A review of related works on the project topic is presented in Section 3. The development of the parallel implementation for the digitalization process over parallel and distributed computing infrastructures is described in Section 4. Section 5 reports the experimental evaluation over three different parallel/distributed computed infrastructures: cluster, grid, and cloud. Finally, Section 6 summarizes the conclusions of the research and formulates the main lines for future work.
2. Recovering historical climate data: the Digi-Clima project
This section describes the problem of recovering historical climate records, the Digi-Clima project, and the algorithms proposed for digitalizing pluviometer bands
2.1 The Digi-Clima project
In Uruguay, the National Institute of Meteorology has systematically collected records of climate variables from the beginning of the 20th century, including tables of manuscript data for several variables (temperature, humidity, rain, etc.), descriptive reports, and also graphic records of pluviometers and other devices. These data are very useful for understanding climate phenomena and for climate/weather forecasting using sophisticated numerical models. However, the analysis and utilization of the historical climate data is very difficult, mainly due to the paper-format in which they are stored. Furthermore, their preservation is in danger, because of the inherent deterioration of the material when the paper records are handled.
In order to guarantee the preservation of the historical climate records for the country, the Digi-Clima project was conceived to provide a semi-automatic method for digitalizing climate records from weather stations across the country. The resulting data is stored in a digital database of historical climate records, making possible both the preservation and the utilization of the data in current climate numerical models. The main focus of the project is to digitalize the information from the rain history of Uruguay.
The rain intensity records are stored in millimetre-marked paper bands. In these bands, a pluviometer recorded for a certain time period the amount of rain accumulated in a given zone of the country. Each band contains on the front side the pluviometer records, and on the back side manuscript annotations that indicate the dates of the beginning and the end of the register, as well as the scale used to compute the maximum value of the rain records for the band, among other significant information. Figure 1 describes the recording procedure for historic rain data.
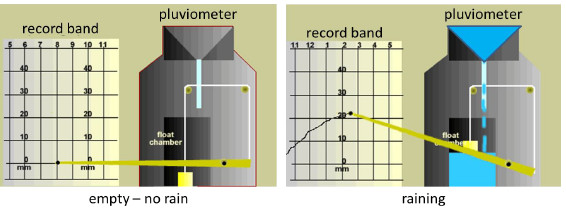
Figure 1: The process for recording pluviometer records in data record bands
The pluviometer records form a continuous line, which is drawn by a pen situated in the head of the pluviometer. This line is reasonably smooth and (piecewise) monotonically increasing, indicating the amount of rain accumulated on the device. The value represented by the line grows until the pluviometer capacity is reached. Then, a vertical fall to zero indicates that the device is emptied, and the measuring process starts again. Figure 2 presents an example of the historical rain records for the city of Artigas (North of Uruguay) in the year 1980.
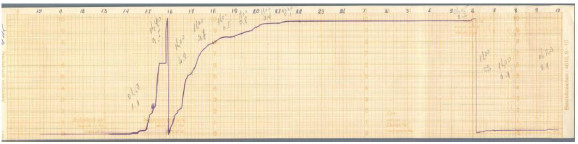
Figure 2: An example of a pluviometer record band, (Artigas, Uruguay, year 1980)
In the sample band in Figure 2, several of the inherent troubles that make the digitalization problem difficult are shown, including a discontinuous ink line, ink stains, different intensity levels on the record line, and other defects that are consequences of the measuring procedure using an analogical device. Furthermore, manuscript annotations are also present in the band to account for additional data, usually written by operators when the band was removed from the pluviometer. Nevertheless, the band presented in Figure 2 is in excellent conditions of conservation, many other bands are ragged, severely stained, or almost impossible to read, as the sample band presented in Figure 3 (corresponding to the city of Paysandú, year 2011).
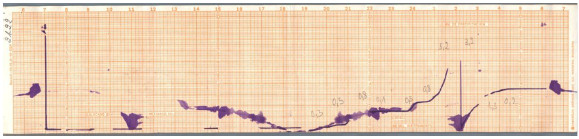
Figure 3: An example of a bad-quality pluviometer record band (Paysandú, Uruguay, year 2011)
2.2 The application for digitalizing pluviometer bands
The application for digitalizing pluviometer bands (from now, the Digi-Clima application) is a software program, developed in the Matlab scientific programming language. The Digi-Clima application is applied for extracting the data of the temporal series for accumulated rain records from the image of a pluviometer band just like the ones in Figures 2 and 3. By using scientific computing techniques for image processing, including segmentation and chromatic separation methods, counting and interpolation, the Digi-Clima application is able to successfully perform the reconstruction of the temporal series for a significant majority of the images available. The current version of the Digi-Clima application uses several functions from specific Matlab toolboxes, but we have also migrated this functions to an open-source code using the Octave programming language.
The first operation to perform in the digitalization process is to obtain a digital image of the paper data band, which is made by a semi-automatic procedure using scanners, but assisted by a human operator. After that, the algorithms developed for digitalizing the pluviometer records are based on processing the digital image obtained in the scanning process. The main goal of the Digi-Clima application is to recover the information specified by the pluviometer ink line, by correctly separating the line from the other components of the image (millimeter grid, numeric scale and axes, handwriting annotations included by human operators, ink stains or other defects due to manipulation and storage of the paper bands, etc.). We apply a strategy based on the one described by van Piggelen et al. [8] for processing information on millimeter paper (see a full description of this previous article in the related works section).
The diagram on Figure 4 describes the stages and tasks performed on the Digi-Clima application:
-
color separation: separates the rain traces from the background and other information by color tagging, getting a black and white image which the active pixels from the rain traces;
-
noise filter: eliminates noise from the black and white image, obtaining a new image with better contrast properties;
-
removing handwritten annotations: character and other data added by human operators are identified and removed from the image;
-
band and trace identification: analyzes the frame information layer to separate and scale the individual bands; for each band, identifies the traces of rain records as continuous lines;
-
trace analysis and grouping: analyzes each trace to obtain its footprint in pixel scaling, by using a spline fitting (Matlab) or a median estimator (Octave); then, orders the traces in each band, since these records should be monotonic;
-
rain intensity computation: obtains the rain intensity data from the discrete time derivative of the grouped traces.
These tasks are described in the following subsections.
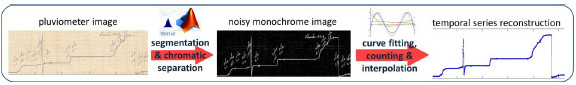
Figure 4: Diagram of the stages in the Digi-Clima application
2.2.1. Color separation
Color separation is performed by applying a statistic chromatic segmentation procedure. The main goal of this stage is to detect those pixels on the image whose chromatic information does not fit the statistical distribution of the monochrome background of the millimeter band. The pluviometer trace covers a very small region of each image (about 3–5% of the whole band surface). Thus, this methods assumes as hypothesis that the statistical distribution of the colors for the pixels on the image has the following pattern: a dominant population, which corresponds to the monochrome image impression, combined with a very reduced population of pixels with "anomalous" color, which correspond to the pluviometer line, handwritten annotations, and other features due to the instrument or the human manipulation of the band.
The chromatic segmentation is performed by computing the tridimensional histogram of color distribution for pixels in the RGB space, applying a parametric discretization of each color band using scales of 64, 128, or 256 bits. The histogram H(R,G,B) is represented by a tridimensional matrix N (64×64, 128×128, or 256×256) whose elements (n,i,j,k) indicate the number of pixels on the image (n) with the corresponding values of i, j, and k for R, G, and B, respectively. Figure 5 presents a bi-dimensional cut of an histogram for a band, considering the values of R in abscissas y G en ordinates. The color scale corresponds to the frequency of appearance of each color combination: blue corresponds to low frequency of appearance and red to the high frequencies. Figure 5 shows a dominating population of pixels aligned in a compact and connected region, with high correlation on values of (R,G), as it is expected given the pattern of the monochromatic impression of the millimeter band.
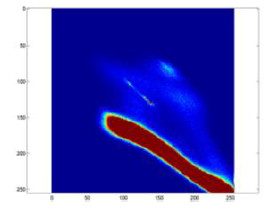
Figure 5: Bi-dimensional cut of a RGB histogram in the bands R and G
The chromatic segmentation applies a traditional thresholding technique [9], using a cutting point or threshold to separate and keep those pixels with lower frequency of appearance. The threshold value is a parameter of the proposed algorithm, which is associated to each paper type or chromatic features of the band impression. For example, some records are stored in green millimeter bands, instead of the orange ones shown in Figures 2 and 3. For green paper bands, the threshold value is slightly different than the one used for orange paper bands. This thresholding segmentation method allows obtaining a monochrome (black and white) image with high disperse noise. The black and white image keeps the main sources of information contained in the original pluviometer image, but separating clearly the rain record line from the background, as shown in Figure 6.
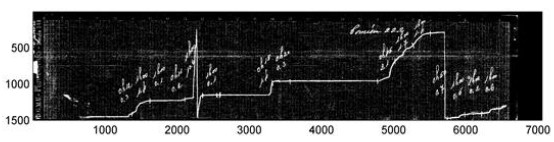
Figure 6: Monochrome black and white image with noise, obtained after applying a statistic chromatic segmentation
2.2.2. Noise filter
This stage applies a noise filter to the monochrome black and white image obtained in the previous step, in order to eliminate those pixels that are isolated or forming very small groups, according to a predefined criterion. A simple iterative procedure is applied to search in windows of size M×M pixels, and the pixel in the position (i,j) is discarded if the window centered in the position (i,j) does not contain more than K active pixels. The values of K and M are parameters of the algorithm, whose values are fixed after performing an initial parameter tuning, depending on the quality and amount of information of the original image. Representative values are M = 3, K = 3, or M = 5, K = 8,for example. Figure 7 presents an example of the output image after applying the noise filter stage, showing a significant reduction of the noise present in the monochrome image.
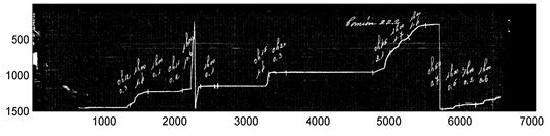
Figure 7: Output monochrome image after applying the noise reduction stage
2.2.3. Removing handwritten annotations
This stage detects and eliminates handwritten annotation, applying a topological approach for detecting characters and figures included in the image of the paper band. This function assumes that a given annotation is written with the same (or at least similar) ink color. In a first step, those regions in the image that contain cycles or rounded characters that are smaller than a predefined size, just like the sample "o" handwritten character shown in Figure 8.

Figure 8: Example of the handwritten cycles identified in the character recognizing phase
The character recognition is made by identifying connected components of pixels and studying their topological properties. Among several other properties, the algorithm checks connectivity of the inner part of the cycle, evaluates that the axis of inertia (minor and major) have similar lengths, etc. Once a character is identified, a common chromatic pattern is built in order to identify all pixels corresponding to similar annotations, which are made with the same or similar ink type and color. This way, the automatic recognition is extended to all handwritten elements, which will be eliminated from the monochrome image.
Figure 9 presents an example of the handwritten annotations detected using the proposed method, and Figure 10 shows the monochrome image obtained after eliminating all handwritten annotations identified (notice that some annotations are not identified using the proposed method, but they will be ignored in the following step).
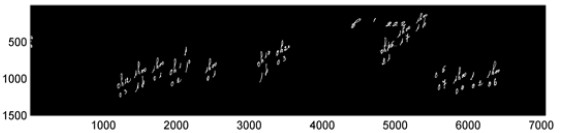
Figure 9: Handwritten annotations identified in the character recognition stage
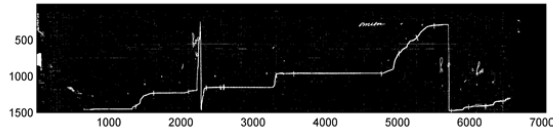
Figure 10: Monochrome image after removing the handwritten annotations
2.2.4. Trace analysis and time series reconstruction
The last step in the digitalization process consist in extracting the pluviometer information from the depurated monochrome image. A specific procedure is applied to obtain the most probable trace for the pluviometer record, considering that the trace defines a function, i.e. for each point in the time axis a unique value of the corresponding rain record is defined by the head of the pluviometer. This way, for each vertical position of the band a most probable value for the rain record is determined by analyzing the neighboring active pixels in a predefined window, and also considering the pixel values for nearby regions. This job is performed by an algorithm that takes into account the intensity and thickness of the already identified segments and pixels, and their inclusion into active regions with larger extension, in order to preserve the continuity of the trace. Specific interpolation and estimation techniques are applied to guarantee connectivity and smoothness of the resulting line: a spline interpolation method is used in the Matlab version, and a median estimator is applied in the Octave version. Ordering techniques are also applied to sort the records in a monotonic sequence. After that, the rain intensity data for each band are obtained by computing the discrete time derivative of the grouped traces.
A sample output of the algorithm is shown in Figure 11. The resulting image is not longer a set of pixels, but a graphic of height values for the vertical position of the pluviometer head in each time point, which allows the researcher to reconstruct the time series of the rain records.
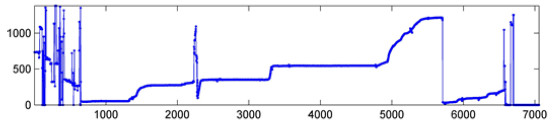
Figure 11: Sample output of the trace following stage
2.3. Validation using artificial neural networks
As a complementary approach to the one originally proposed using standard image processing techniques, we also developed another fully automated procedure for image classification, applying artificial neural networks (ANN). ANNs are soft computing methods, specifically designed to handle with data processing and approximation. As any other soft computing method, ANNs are able to handle partial information or errors in the available data, and even yet produce accurate results. For this reason, they are a useful approach to deal with the digitalization of data bands in the Digi-Clima project, being robust against errors in the rain records, missing values, and any other defects on the measuring process.
We applied a parallel ANN implemented over Graphic Processing Units (GPU). Figure 12 presents a description of the implementation, which uses the GPU computing elements to process in parallel the information from different image zones, using a number of threads that cooperates in the learning process.
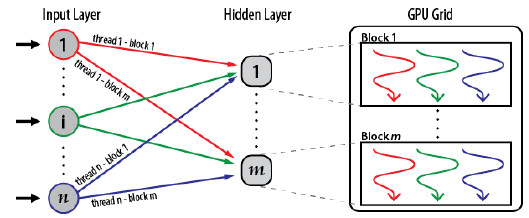
Figure 12: Diagram of the parallel ANN implementation in GPU
Several strategies were applied to process the image information, including swapping the image by zones, by rows, and by columns (and using information from neighboring columns). These strategies are schematically presented in Figure 13. Swapping by columns and using information from nearby columns allowed obtaining the best results, as these technique is more useful to process regions with discontinuities and breaks in the ink line (see the full details in our conference paper [10]).
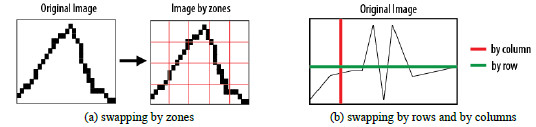
Figure 13: Strategies applied for processing rain intensity bands when applying the ANN approach
This novel approach for image processing was introduced in our conference article [10]. The main contributions of this validation are: i) the ANN approach itself, and its application for recovering historical climate information, ii) the parallel deployment over GPUs that allows reducing the execution times significantly, and iii) the experimental analysis performed using a set of representative images from the Digi-Clima project, which demonstrates the efficacy of the proposed approach, achieving classification rates and correct recovering of the rain time series up to 76%. The parallel algorithm allows reducing the execution times, with an acceleration factor of up to 2.15×.
2.4. Additional software developed and other considerations
Several other handwritten data are specified in the back face of the image, including starting and finishing date of the record and the total rain accumulated in the time period. All these data are needed to properly classify the record and store it in the database, and a specific application using an optical character recognition tool was developed. This application makes it easy for a human operator the (otherwise hard) task of manual transcription of data.
Images corresponding to both faces of each data band were digitalized and saved in JPEG format. After that, they were classified according the quality of the image, before executing the Digi-Clima application for image processing. Two categories were identified: those images where the information can be properly retrieved by the aforementioned image processing application (good quality images), and those images that are severely deteriorated or with very important errors in the pluviometer recording due to malfunction of the device, big ink stains, ore other defects (bad quality images). For this last category, the assistance of a human operator is needed to properly retrieve the rain records information, in case it is possible. More than 80% of the images have a quality good enough to apply the automatic digitalization method.
In the first stage of the project, 8000 bands were digitalized, corresponding to rain intensity records for the cities of Montevideo, Rocha, Paysandú and Artigas (Uruguay), recorded between 1968 and 2010. In a second stage, more than 30.000 images from more than 50 meteorological stations across the country were processed. Figure 14 presents the map of the regional (red) and local (blue) meteorological stations in the country providing data for the digitalization process; for each of them, more than a century of rain record are available to process. Actually, new data are periodically provided by the National Institute of Meteorology and processed using the software developed by the Digi-Clima project.
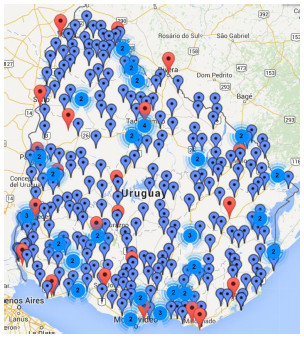
Figure 14: Meteorological stations in Uruguay, providing images for the digitalization software developed in the Digi-Clima and Digi-Clima grid projects (redregional stations, bluelocal stations)
The Digi-Clima application demands about 10-15 minutes of execution time to process a single image, depending on the complexity of the processes described in the previous subsections, especially when dealing with images with minor errors and defects that make the image processing techniques more difficult to apply.
Following a sequential approach for execution, the execution time required to digitalize the image in the first stage would have required about two months of a standard (single core) computer. Taking into account these large execution times, and considering that building the full database for the country implies digitalizing and storing a significantly large number of data bands, the Digi-Clima Grid project proposed using parallel and distributed computing techniques over cluster, grid, and cloud computing platforms for efficiently solving the digitalization problem within the Digi-Clima project.
3. Related work
Some previous works have been reported in the literature, which have tackled similar problems than the one faced by the Digi-Clima and Digi-Clima Grid projects, but using different approaches than the semi-automatic processing proposed in our research.
A number of those previous works on the topic were exclusively focused on analyzing specific climate phenomena for short time periods. Thus, these works analyzed significantly fewer volumes of data than the ones to be processed in the Digi-Clima project. In addition, several similar projects about recovering historical climate records are based on human operators, or using human-computing approaches.
One of the first initiatives that tackled the problem of recovering historical climate data from a systematic perspective was the CLIWOC project [11], funded by the EU, and developed by researchers from Spain, UK, Netherlands, and Argentina. The main achievement of CLIWOC was building a database of climate observations based on hundreds of thousands records stored manually and in natural language from logbooks of Dutch, Spanish, French, and English vessels between 1750 and 1850. Several work groups and human forces were involved in CLIWOC, each one specialized on the analysis of different climate data in the logbooks. The transcription included several data for each observation: date, geographic location, weather status, wind speed and direction, sea status, ice reports, and air temperature and pressure. CLIWOC also built a dictionary that allowed the researchers to unify the several criteria and terminology used in the logbooks, corresponding to four languages in more than 100 years.
A specific feature of the CLIWOC Project, which is also relevant for the Digi-Clima Project, is the quality control applied to the data transcription process. A random set of 5% of the transcriptions was selected for different periods; they were (manually) checked for possible significant errors, and in the presence of errors all the transcriptions for the same period were processed again.
On the same research line, the RECLAIM project [12] (still under development) proposes continuing the work started in the CLIWOC project, by processing data that were not included in the original process. At the long-term, RECLAIM proposes processing records from the instrumental era, from 1853 to the current years.
The Old Weather Project [13] was focused on the transcription phase of climate records. It proposes extracting data from digital images of handwritten climate documents by using volunteer human operators. In order to make more attractive the data transcription task and gathering more collaborators for the project, they proposed to develop an online game. A volunteer subscribes as a player in the game and chooses a ship, which corresponds to a real ship that gathered information in the past, thus having climate data logbooks to digitalize. The player starts with a low rank in the navy, and he earns experience and points by transcribing data, which allows him to be promoted to higher ranks. By using this game, the Old Weather project collected a group of human ‘digitalizers’. They implement a simple control correction mechanism by performing multiple transcriptions of the same records and deciding by voting, thus achieving high quality results. This approach follows the “human computing” paradigm, which attempts to solve computing problems using human operators, and it is proposed as a promising line for future work in the Digi-Clima project.
The three previously commented projects are somehow related to Digi-Clima, since they propose the transcription of historical climate records. The projects demonstrate that the international research community is currently interested in the problem of recovering historical climate data stored in non-digital format.
Regarding image processing and line tracing, there is a number of commercial and free software packages available, but they are mainly designed for tracing one line at a time. Furthermore, the assistance of a human operator is needed to identify specific positions of the curve, axis, and other features. The support they provide for image segmentation is poor in the case of working with fine grids, such as the ones in the millimeter papers bands using for storing rain records.
Deidda et al. [14] proposed a semi-automatic system for recognizing signals from tipping-bucket gauge strip charts. The system is based on both image analysis techniques, and mechanical features of the recording instrument and the strip charts. For the image processing, several tasks need to be performed by a human, including specifying the threshold for color segmentation, indicating the thickness of the curve, and several other parameters related to the instrument used for acquiring the values. This ad-hoc system allowed obtaining more robust results than general purpose software for image vectorialization. A graphical user interface for results verification and manual correction is also introduced. A test on a large set of strip charts from rainfall data demonstrates that the system is a useful tool for climate records digitalization.
In 2011, van Piggelen et al. [8] extended the previous approach, introducing a specific methodology for the semi-automatic recovering of data stored in paper with a millimeter grid. The approach makes use of human operators for pre-processing the images in order to improve the quality of the records. After that, image processing software is used for curve detection and data extraction to determine the coordinates of cumulative rainfall lines on the images. The proposed procedure was applied to digitalize data for a total number of 321 station/years of relevant meteorological places in the Netherlands. A human-base semiautomatic postprocessing, implemented through a graphical interface application was needed to build the time series for about 30% of the images (depending on the quality of the image records). This generic methodology for image processing and recovering time series is also applied in the Digi-Clima project.
The review of the related work allowed our research group to understand the state-of-the-art about recovering historical data from manuscripts. However, the only similar projects reviewed that have developed efficient methods for the automatic or semi-automatic transcription of data are the ones by Deidda et al. and van Piggelen et al. All other approaches are based on human operators or human computing techniques. Furthermore, there are no antecedents of using high performance or distributed computing techniques in order to speed up the recovering process.
As a consequence, the Digi-Clima Grid project is a contribution in this line of research, by proposing the use of distributed computing techniques to efficiently solve the problem.
In our previous conference articles [6,7], we described in detail the application of parallel scientific computing techniques to solve the problem tackled in the Digi-Clima project. In [6] the solutions developed by applying parallel computing techniques in cluster platforms and the GISELA grid infrastructure were described. Both approaches were appropriate to solve the problem, achieving accurate speedup values when executing in dedicated computing infrastructures. In [7] we introduced an approach based on using volunteer-computing platforms. These approaches are described next.
4. Parallel implementations for Digi-Clima
This section describes the parallel implementations of the Digi-Clima application over distributed memory HPC infrastructures (cluster, grid, and cloud).
4.1. Parallel model
The proposed approach for executing Digi-Clima in a parallel or distributed system is based on considering the Digi-Clima application (programmed in Matlab or Octave) as a black box, in order to take full advantage of the availability of computing resources in the platform.
The processing of each digitalized image is independent of the other images, so a traditional data-parallel approach can be applied on the input data, working with sets of images as partitions of the problem data.
The parallel model is based on executing multiple instances of the Digi-Clima application simultaneously, working on different input data, without communications between the parallel/distributed processing tasks. Communications between concurrent processes are only used to get the images and to keep track of the shared information about the images processing status, in order to avoid processing the same image more than once.
In this parallel model, the only overhead in the processing is due to the mutual exclusion between processes when loading images from the image database and when accessing the shared information about the processing status. These accesses are performed before (load, access to shared information) and after (set processing status) processing each image, but the negative impact of these communications on the computational performance of the distributed application can be reduced by assigning a bag of tasks (in our application case, is a bag of images) to each distributed process executing in a computing element of the volunteer grid.
A master-slave parallel architecture is proposed to execute Digi-Clima over parallel and distributed computing infrastructures. The master process launches several slave processes that execute in parallel. After that, the master assigns the work to slaves, which perform the image processing by executing the Digi-clima application on a set of images assigned by the master, using the computing elements of the distributed infrastructure. Once a slave finishes processing the assigned set of images, results are communicated to the master, which collects the output data. Different strategies are used to launch slave processes and communicate images and output results, depending on the specific features of the distributed infrastructure applied (cluster, grid, or cloud). The proposed strategy allows scaling up, theoretically achieving almost-linear speedup in case of applying an efficient utilization of the mechanisms for workload assignment, load balancing, communication, and synchronization in each platform. Figure 15 presents a generic schema of the parallel model.
Following the black-box approach for image processing allows focusing on the data parallelism itself, making the development of a distributed version on cluster/grid/cloud independent of the specific features of the Digi-Clima application. Furthermore, this strategy allows taking advantage of the continuous improvement in the processing tool described in Section 2, by using updated versions of the image-processing algorithms, which are in constant improvement by our research group.
There are two alternatives for executing the Digi-Clima application over an image or set of images: i) executing the interpreted Matlab application, or ii) executing a binary application, compiled for a given platform, by using a free runtime (i.e., the Matlab Compiler Runtime). In addition, the Digi-Clima application can be run using a single thread of execution or using multiple threads. We performed experiments to study the parallel capabilities of the multithread implementation (using from 2 to 16 cores) using different parallelization approaches for Digi-Clima at the node level inside Matlab, using both the automatic and programmed capabilities provided by the language.
The experimental results proved that the best speedup values are obtained when using 4 cores (speedup value: 1.6). When using more threads, the image processing algorithms is not able to take advantage of the parallelization, mainly because few data are processed within each image. Taking into account these results, we decided to focus on the higher level data parallelization approach (based on processing a set of images in parallel).
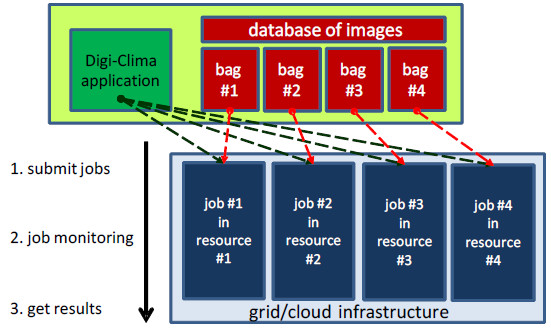
Figure 15: Generic data-decomposition approach used in the parallel-distributed Digi-Clima Grid application
All the implementations (cluster/grid/cloud) presented in this article supports executing both the interpreted and the compiled versions of the Digi-Clima application, as well as both the single and multithread versions. The compiled version of the application is preferable when executing in a cluster infrastructure, for performance reasons: it is significantly more efficient than the interpreted version. The compiled version of the application can also be used in cloud infrastructures where virtual machines are used to execute the application, and the runtime might not be available. On the other hand, in general grid and cloud infrastructures both options are usually available, and the Digi-Clima application can be executed as interpreted or compiled, according to the choice that provide the best option.
In order to analyze the benefits of applying distributed computing techniques, in this article we have decided to report the results using the single-thread option in the experimental analysis section. This decision allows working with the black-box approach, since it does not require performing modifications to the program code to handle threads, external functions and/or intermediate data.
Using other languages (for example C) instead of Matlab would improve the performance of processing a single image. However, that is not the main goal of our research; we are interested on studying the benefits of using distributed computing to speed up the process of digitalizing the whole set of pluviometer records.
The description of the cluster, grid, and cloud distributed implementations for Digi-Clima are presented next.
4.2. Master-slave implementation for clusters using MPI
A specific master-slave implementation was developed for execution in a local cluster infrastructure by using the MPI library for parallel/distributed programming [15].
The master process is in charge of performing the workload distribution and applying some control tasks in order to provide fault tolerance. The slave processes executed the Digi-Clima application over assigned images, following the black-box approach described in the previous subsection. All communications and synchronizations are performed using specific functions provided by MPI for interprocess communications.
The execution time of the Digi-Clima application depends on the image to be processed. This time is very difficult to estimate beforehand, mainly because defects and annotations makes the image processing more difficult and more time-consuming. Thus, in the parallel implementation, a dynamic workload assignment schema is applied by the master, in order to avoid severe load unbalancing situations that could appear if a static domain decomposition is applied (i.e., by statically assigning a specific number of images to each slave process). In the dynamic workload assignment, each slave process is initially assigned a low number of images to process, and the slave will demand more images to process once the previously assigned work is finished. Figure 16 presents a diagram of the master-slave application developed for cluster infrastructures using MPI.
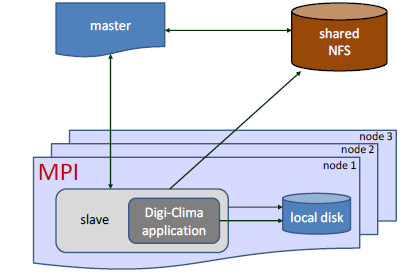
Figure 16: Diagram of the master-slave application developed for cluster infrastructures using MPI
A simple fault tolerance mechanism was implemented in order to provide support for not losing the information of already processed images when an unexpected event causes the execution to abort. The master process keeps metadata of the images assigned to each slave (including the path to the physical location of the image and its processing state). These metadata are updated every time that an image is assigned and the processing status changes (from 'unprocessed' to 'processing' to 'processed'). This information is used by the fault tolerance mechanism: before starting a specific task, assigning a new workload, or processing a set of images, both the master and the slave are able to check the status of every image to assign, allowing to continue the processing where an aborted slave left it in the past.
In the particular case of a cluster infrastructure, the Network File System (NFS) can be used as a shared resource to implement the fault tolerance method described. Slave processes can also use the local disks of the computer nodes where they are executing in order to provide a faster storage for intermediate data.
4.3. Distributed implementation for grid infrastructures using pilot jobs
Using a grid infrastructure for scientific computing provides a significantly large amount of computing resources, which are shared by institutions. This large and loosely-coupled parallel/distributed system allows facing problems that are significantly more large and complex than those to be solved in local facilities. However, the main features of grid infrastructures poses some challenges to developers and scientists, as the computing resources are geographically distributed and specific methods must be applied for data distribution, communications, and fault tolerance.
The main issues to solve when implemented a distributed version of Digi-Clima over a grid infrastructure are: i) applying a specific method to properly distribute the images to process over the computing nodes in the grid; ii) implementing a mechanism to avoid processing a single image at the same time by two instances of the Digi-Clima application executing in different computing nodes; and iii) proposing and implementing a procedure to retrieve the results of the image processing and knowing to which image they belong.
When executing over a grid environment, the Matlab interpreter may not be available on the computed nodes. As a consequence, we decided to include the runtime environment within the first set of images to be sent to each node. The time to set up the workspace to execute the Digi-Clima application in each computing element of the grid infrastructure is not negligible: downloading the Matlab Compiler Runtime, which size is about 200MB, and downloading the set of images are to be processed may take a considerable time when computing nodes are far away from the local repository where images are stored. In order to mitigate the negative impact of this software and data transfers, we proposed to use an implementation based on pilot jobs.
Pilot jobs is a paradigm for organizing data processing jobs, which is widely used in parallel and distributed systems. In a pilot job application, the computing resources are acquired by a process, which is able to directly receive or retrieve workload assignments scheduled by the application (or a master process controlling the application). This way, the process does not need to wait in a local queue for every work unit or piece of data to be processed [16,17].
The pilot jobs paradigm is often applied in parallel computing systems, but they are more useful when working on systems, where the computing resources are grouped in logical organizations and following specific policies for job queue managements.
The grid implementation of Digi-Clima was developed and executed over the Latin-American-European grid built by the project Grid Initiatives for e-Science in Europe and Latin America (GISELA), which gathered researchers and computing resources from institutions located in 19 countries in Europe and Latin-America [18].
In the distributed version of Digi-Clima developed for grid infrastructures, the processing is performed by a set of independent pilot jobs that cooperates to process the database of images from the Digi-Clima project.
Once submitted and assigned to a computing element, each pilot job runs a loop, executing the Digi-Clima application on each iteration to process multiple images without the delay due to job submission and the setup of the computing environment. Grid file services are used to distribute the images and to get the results: i) a file catalog service is used to locate files or replicas in every storage element in the grid, and ii) a metadata managing service is used for accounting on the images metadata as processing status and the mapping between the original image file names and their corresponding results. In the grid implementation developed for Digi-Clima, we use the LCG File Catalogue (LFC) [19] from the Worldwide Large Hadron Collider Computing Grid (WLCG), which allows maintaining a mapping between the logical file name (LFN) for each image and the physical storage URL of all of the file replicas. We also use the ARDA Metadata Grid Application (AMGA), a general purpose metadata catalogue developed by the European Middleware Initiative middleware distribution [20]. A metadata catalog is conceived as a simplified database of non-file related data, too small or too volatile to be stored in data files.
The image distribution and image processing procedures are performed by specific scripts that are described next.
The image uploading script. The script for uploading images to the grid environment runs on the directory where the images are stored. Then, a specific directory entry is created on AMGA for the Digi-Clima application, by adding the attributes for image accounting information. Five attributes are included: 1) the image identification on the storage element, 2) the image processing status, 3) the original name of the image file, 4) the timestamp of the last update of the image, and 5) the job identifier of the job which last updated the entry. After the attributes are added to the directory in AMGA the lcg-cr command from LCG is used to upload the images to the grid.
The pilot job for computing. The pilot job that runs Digi-Clima has two components: the file used to submit the job to the Workload Management System of the grid, and the loop script that runs on a computing element, launching on each step the script to set up and run Digi-Clima for each image. The file to submit the job is specified is the Job Description Language (JDL), including specific instructions to set the working space, and identifying the executable to run, the input and output of the job to execute, the names of the files to process, the number of attempts to retry in case of failure, and the specific requirements (e.g., architecture type, 64 bits) by the application. The pilot job first configures the working space to work with LFC commands, and download the files needed for processing, including the Matlab runtime, the Digi-Clima application, and the images to process (it always tries to locate the nearest replica of each needed file from the storage elements in the grid). After that, the pilot job iterates executing the Digi-Clima application over the images. The iteration stops when all images are processed, when there is no available time in the infrastructure, or when an error that prevents the normal execution is detected.
The script than runs the Digi-Clima application obtains each image by executing a SQL query to the AMGA metadata service, updates the metadata of the image to set the processing status to 'processing', downloads the image from the corresponding storage element, executes the Digi-Clima application, and set the processing status to 'processed' if no error is detected in the execution. The Matlab runtime environment is downloaded only once for each computing element in the grid, and used to process multiple images (applying the Bag-of-Tasks paradigm), allowing to reduce the time needed to submit jobs and configuring the environment for execution. Figure 17 presents a diagram of the execution of the pilot job for executing Digi-Clima over a grid infrastructure.
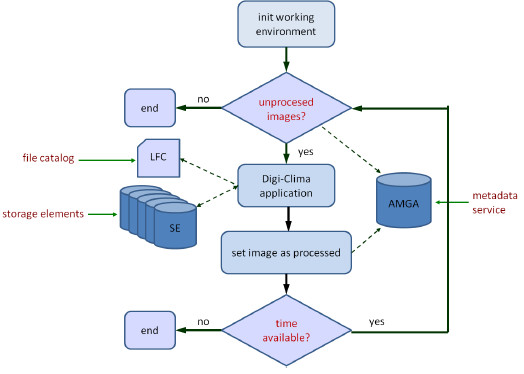
Figure 17: Diagram of the execution of the pilot job for executing Digi-Clima over a grid infrastructure
Web implementation in the GISELA Scientific Gateway. A specific web implementation of the distributed Digi-Clima application was developed to be included in the GISELA Scientific Gateway. The GISELA Scientific Gateway is a web service that allows users to send and administrate jobs to be executed and data to be processed in the grid, from a web browser. The Liferay portal [21] is used to implement a Java user interface for the execution of Digi-Clima in the grid. The implementation makes use of portlets, pluggable user interface software components [22]. Specific portlets were developed over Liferay to be used as component of the user interface for the execution of Digi-Clima. The portlets generate code in the HTML markup language to define the set of images to process and the parameters of the application. All the code generated by the portlets is integrated in a specific web page for the application, within the GISELA Scientific Gateway. The website of Digi-Clima in the GISELA Scientific Gateway is available in the URL https://gisela-gw.ct.infn.it/application-database and the home page of the application is shown on Figure 18.

Figure 18: Digi-Clima webpage within the GISELA Science Gateway
4.4. Distributed implementation for a volunteer grid/cloud infrastructure
The implementation of Digi-Clima for grid/cloud systems was developed using the Ourgrid middleware and executed over resources provided by research institutions in Latin America.
Ourgrid and the Ourgrid middleware. Ourgrid is an open source grid/cloud middleware based on a peer-to-peer architecture, developed by researchers at Universidade Federal de Campina Grande (UFCG), Brazil [5]. This middleware enables the creation of peer-to-peer computational grids, and it is intended to speed up the execution of Bag-of-Tasks applications.
The main components of the OurGrid architecture are: i) the broker: is the user interface to the grid, allowing the users to submit jobs and track their execution; ii) the workers: represents real computing resources used for processing the jobs submitted to the grid. OurGrid workers support virtualization, and so they offer an isolated platform for executing jobs comprising no risks to the local system running the component; iii) the peers: have a twofold role; from the point-of-view of the user, peers search and allocate computing resources for job execution, and from the point-of-view of the infrastructure the peer determines which workers can be used to execute an application, and also how they will be used. Normally, it is enough to have one peer per site. Communication between peers makes possible to execute jobs remotely; in case that the local resources are not enough for satisfying the requirements of a job, the peer seeks for additional resources available in remote sites; and iv) the discovery service: keeps updated information about the sites in the grid, and it is used to find out the end points that peers should use to directly communicate with each other.
All these components are integrated in a transparent way to the user, allowing the grid to provide a single-image of an infrastructure with a large computing power.
The Ourgrid middleware provides support for implementing the volunteer computing paradigm [23,24], which is based on individual users making available their computing resources to execute applications and projects. The main features of volunteer computing are: i) often unaccountable and potentially anonymous users voluntarily provide their resources for computation; ii) users can join and leave the volunteer computing platform at any time; iii) users "credits" are accounted to know how much computing time in the system has been used and provided by every user; iv) replication is usually applied as the preferred technique for fault-tolerance, in order to deal with incorrect results or anomalous events that occur when volunteers unexpectedly leave the system.
The general architecture of a middleware for volunteer computing is like the one presented for Ourgrid: a client program runs on the volunteer side, which periodically contacts servers over the Internet, requesting jobs and reporting the results of completed jobs. In Ourgrid, the standard volunteer computing model is extended to support a full P2P architecture. This feature allows Ourgrid to be used in cloud infrastructures too.
Digi-Clima implementation in Ourgrid. One of the main features of the Ourgrid middleware consists in working with virtual machines, allowing a flexible way for efficiently using the computing resources in the distributed volunteer infrastructure [25]. Following this approach, the parallel/distributed implementation of Digi-Clima in Ourgrid is based on virtual machines for implementing the domain decomposition strategy for parallel/distributed computing. Images are stored in a database in our local Ourgrid node at Cluster FING, Universidad de la República, Uruguay. Processing tasks execute in a distributed volunteer-based Ourgrid infrastructure created for this project, including computing resources in Argentina, Brazil, México, and Uruguay. In the proposed master-slave implementation, the master process assigns a set of images to each slave for processing. Each slave process executes a pre-configured virtual machine to digitalize images using the Digi-Clima application. Slaves knows how to access the database of images and how to obtain other mandatory files needed to process images, including the Digi-Clima application and the MATLAB Compiler Runtime.
A general diagram of the master-slave implementation for executing Digi-Clima in the distributed volunteer based Ourgrid infrastructure is presented in Figure 19.
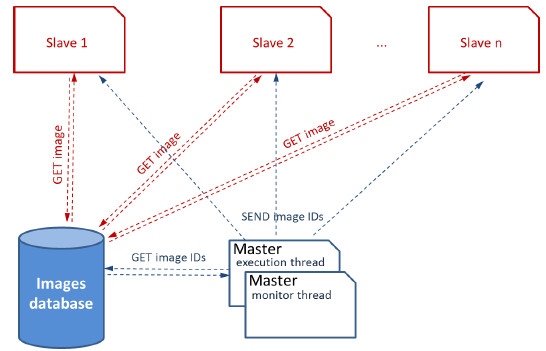
Figure 19: Diagram of the master-slave Digi-Clima implementation in Ourgrid
The master process searches for unprocessed images in the database and assign work to a slave process, based on partitions following the Bag-of-Tasks approach. After selecting a bag of images for processing, the master process starts a new thread (the execution thread), which launches the slave processes to digitalize the set of images selected. The main master thread (the monitoring thread) remains active, controlling the slaves and checking for possible errors in the processing or in the volunteer platform. Before creating a new slave, the master execution thread creates on-the-fly a Job Description File (JDF) with proper information for performing the task: i) the files to be transferred in and out of slave machines, ii) the commands to be executed, iii) the labels to be used to identify jobs, and other features.
The JDF created by the master process will be used by the launched slave process to run a job in Ourgrid for processing a bag of images. A timestamp is used to avoid repeating names for images. Two variables provided by the Ourgrid middleware are also used to identify the slave process that processes the bag of images. The Ourgrid middleware allows specifying requirements inside JDF files to comply with specific needs (for example, a 64-bits architecture for the host, etc.). These specifications are taken into consideration when the middleware searches for computing resources for allocation.
Each slave process receives the images IDs in the assigned bag and uses these data to download images, keep track of their processing and update the database. To avoid transferring the runtime each time a new process is launched, the slave process verify if a local version of the runtime is already available on the remote host, and it also checks if it is suitable for the Digi-Clima algorithm provided. In this case, only images have to be transferred, thus improving the execution time and the computational efficiency of the distributed algorithm. All files are accessed through a local webserver.
Errors in the processing are handled in two levels: i) errors in the Ourgrid middleware and the grid/cloud platform, and ii) errors in the master-slave parallel solution proposed. The Ourgrid middleware works with replicas of each defined task (the number of replicas can be defined before execution, the default value is three). In case of errors in the processing, Ourgrid will stop trying to process a specific image only after all the replicas have failed. In such a case, the slave process handling the image will mark it to be processed again (possibly by another slave) in the future.
Both the master and slave processes are implemented in the Perl programming language. Perl is available in most Linux distributions, and it is included in the virtual machines used by Ourgrid. It offers a large set of modules that make possible the interoperation of applications with very different features, including thread handling, file compression, database access and HTTP connections. The database used to keep track of the processed images and their corresponding state is implemented in the open source mysql manager. The database is structured in rows corresponding to each single image, storing the image ID, the file name, the file URL (used by the slave to download the image), the current status of the image, the output path and descriptive notes. The status of an image is updated by each slave process when an event happens. The monitor thread of the master process is continuously monitoring the database to check for new slave threads to be launched, or if there are images to be assigned. Once all the images are marked as ‘processed’, the monitor thread stops and the parallel program ends the execution.
5. Experimental evaluation
This section reports the experimental evaluation of the proposed parallel/distributed implementations of Digi-Clima over cluster, grid, and cloud infrastructures.
5.1 Evaluation platforms
The experimental evaluation of the computational efficiency of the parallel/distributed implementations of Digi-Clima was performed over the following platforms:
-
Cluster implementation: an heterogeneous cluster with processors Intel Xeon E5520 and AMD Opteron 6172, using 4/8/12 cores at 2.6 GHz, 1 GB RAM/core, and Gigabit Ethernet, from Cluster FING (www.fing.edu.uy/cluster);
-
Grid implementation: an homogenous cluster with processors Intel Xeon 5400, 4 cores at 2.6 GHz, 2 GB RAM/core, and Gigabit Ethernet, from GISELA grid.
-
Grid/cloud implementation: a volunteer computing infrastructure with heterogeneous resources from four Latin America research institutions: Universidad de Buenos Aires (UBA) in Argentina, Universidade Federal de Campina Grande (UFCG) in Brazil, Universidad Veracruzana (UV) in México, and Universidad de la República (UdelaR), in Uruguay. The committed resources for the volunteer infrastructure are: UBA-IBM Express x3650 M4, Xeon E5-2620 12 cores, (2.0GHz), 128GB RAM, Gigabit Ethernet; UCFG-Intel i5-3470S, 4 cores (2.9 GHz) and i7-2600, 8 cores (3.40GHz), 8 GB RAM, Gigabit Ethernet; UV-Intel i5-3470S, 4 cores (2.3 GHz), 48 GB RAM, Ethernet; UdelaR-AMD Opteron 6172, 24 cores (2.1 GHz), 24 GB RAM, Gigabit Ethernet, from Cluster FING.
5.2. Experimental results
Master-slave implementation in Cluster FING. The master-slave implementation was evaluated in two scenarios: a) using a lightweight prototype of the Digi-Clima application, with an execution time in the order of one minute per image and a reduced database of 1000 images b) the full Digi-Clima application and a database of 5000 images. In both cases, we evaluated the execution time of the sequential and the parallel processing using different numbers of processes. The execution time results are summarized in Table 1. We also report the speedup values when using different number of processes. The speedup is a metric that evaluates the acceleration on the execution times when using a parallel implementation when compared against the sequential implementation. The speedup is defined by the expression in Equation 1, where T1 is the execution time of the sequential implementation (using only one process) and TN is the execution time of the parallel implementation using N processes executing in N computing resources.
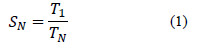
Table 1: Computational efficiency of the master-slave Digi-Clima implementation in Cluster FING
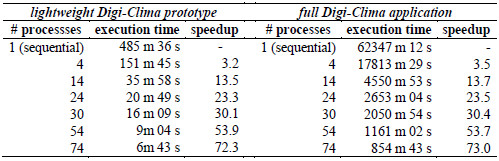
The computational efficiency results reported in Table 1 demonstrate that the parallel implementation is able to achieve almost linear speedup values when using up to 74 processes executing on computing resources from the Cluster FING infrastructure. The speedup values are slightly better when using the full Digi-Clima application when compared with the lightweight prototype implementation. This result confirm previous experiments regarding the increasing values of speedup when processing more images [26] and it suggests that there is a relationship between the number of images to process and the number of slave processes used in the parallel implementation: when a more intensive utilization of the computing resources is demanded, better speedup values are obtained. This is explained because the impact of the overhead of both the initialization times and the communications between processes are reduced when processing more images. Figure 20 summarizes the speedup results obtained for the master-slave Digi-Clima implementation in the Cluster FING infrastructure.
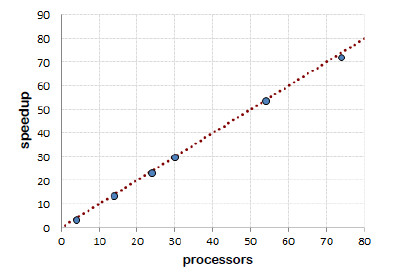
Figure 20: Speedup values for the master-slave Digi-Clima implementation in Cluster FING
Distributed implementation using pilot jobs in grid. We used a reduced databank of 500 images for evaluating the grid implementation. The analysis is representative of a realistic scenario for a distributed implementation, using resources in datacenters having local replicas of the image data bank. Executions using 4 and 20 pilot jobs were used, which waited for about 9 minutes in the local queues of the grid and demanded about 11 seconds for updating results using the grid infrastructure, according to the architecture described in Section 4.3. Table 2 reports the execution times when executing the grid implementation of Digi-Clima for the lightweight prototype of the Digi-Clima application and the full Digi-Clima application.
Table 2: Computational efficiency of the grid Digi-Clima implementation in GISELA grid
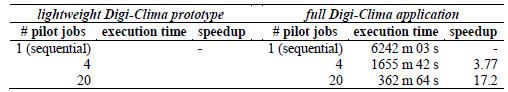
Promising almost-linear speedup values are reported in Table 2 for the distributed Digi-Clima application in a grid infrastructure. Considering that when using a geographically distributed system the pilot job processes must compete with other research jobs and wait in local queues in the datacenters of the grid, the 17.2 speedup value when using 20 pilot jobs represents a significant improvement in the computational efficiency. Taking into account the previously presented results, a grid implementation would allow to digitalize the full current database of images (50000 images) using 20 pilot jobs in 610 hours (about 25 days) instead of the 10500 hours (about 14 months and 15 days) when using a sequential implementation. Even more efficient execution times can be achieved when using more pilot jobs for the distributed implementation.
Distributed implementation in the Ourgrid volunteer computing platform. Table 3 reports the times required to process a database containing 500 images using the full implementation of the Digi-Clima application. The time required to process an individual image differs, depending on the specific characteristics of each image. Processing times between 4 and 20 minutes have been observed, and the average execution time is 12 m 40 s. In the evaluation reported in Table 1, we consider four different numbers of Ourgrid worker processes (1, 8, 16, and 24). When using 8, 16, and 24 workers, Ourgrid allocated the computing resources in the volunteer infrastructure and each worker is assigned a bag of images to process. We performed a fine tuning of the number of images in each Bag-of-Tasks; we evaluate using 5 and 10 images in each bag. We evaluate the computational efficiency of the distributed algorithm in each case.
Table 3: Computational efficiency of the distributed implementation of Digi-Clima in Ourgrid
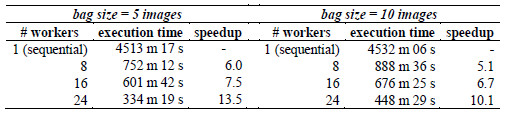
The computational efficiency results reported in Table 1 indicate that the distributed Digi-Clima application over a volunteer grid/cloud computing infrastructure allows reducing the processing times considerably. In addition, using a smaller bag of images (assigning 5 images for each request of slave processes) allows achieving a better level of parallelism, thus improving the execution times. Figure 21 summarizes the main results of the speedup analysis, showing that promising computational efficiency values and scalability behavior are obtained when using up to 24 slave processes. Taking into account the obtained efficiency results, the current whole database of 50.000 pluviometer records can be digitalized using the distributed Digi-Clima application over Ourgrid in about 23.3 days, while the sequential processing would demand more than 311,66 days (more than 10 months).
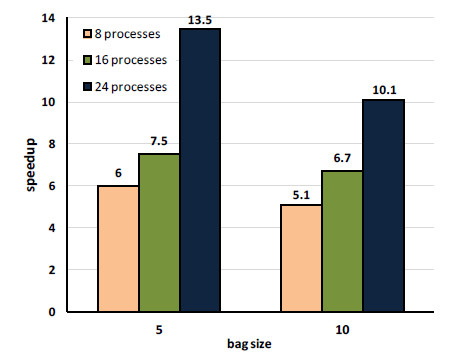
Figure 21: Speedup analysis for the distributed Digi-Clima implementation in Ourgrid
6. Conclusions and future work
This article presented the Digi-Clima and Digi-Clima grid projects. The main goals of the projects are: i) applying image processing techniques for the semi-automatic recovering of historical rain data in Uruguay, and ii) develop distributed implementations to be executed over high performance computing platforms.
The image processing involves applying several strategies to get the rain information, including: color separation and noise filter; removing handwritten annotations; and performing trace analysis and grouping using approximation, curve fitting (Matlab), and curve tracking. In addition, an automatic approach applying a parallel neural network in GPU was developed to classify and digitalize images, achieving accurate classification rates and efficient execution times. This method provides an additional software for the verification of the image processing results.
Three implementations were proposed for the parallel-distributed version of Digi-Clima: a master-slave approach executing on a local cluster, an implementation using pilot jobs over an institutional grid, and a distributed implementation over a volunteer computing infrastructure built using the Ourgrid middleware.
The implemented solutions demonstrated the simplicity and the versatility of using both the GISELA and Ourgrid middlewares for distributed computing. By defining simple tasks and processes, and using the correspondent services in the grid, the implementation of a distributed application is rather simple and efficient.
The experimental analysis performed over the aforementioned computing platforms demonstrated that accurate speedup values are achieved when applying a domain-decomposition approach based on partitioning the set of images according to the Bag-of-Tasks model. The master-slave implementation allows obtaining almost linear speedup values, while the utilization of wide area distributed platforms (grid and cloud) also allows an efficient processing obtaining accurate sub-linear speedup values and reasonable computational efficiency. Nowadays, a specific version of the Digi-Clima application is installed for public utilization in the GISELA Scientific Gateway.
Using the proposed parallel-distributed approaches, the whole database of pluviometer records (January, 2015, as provided by the National Institute of Meteorology, Uruguay), can be digitalized in just about 20-25 days, while the sequential processing of all images would demand about one year of computing time.
Right now, the Digi-Clima grid project is over, but some lines have emerged as promising lines for future work. The proposed approach can be extended to process other historical climate data, possibly by including more sophisticated mechanisms using computational intelligence techniques for processing and human computing techniques for verification. This way, the distributed computing approach could be applied to solve similar problems dealing with information recovery.
References
[1] Digi-Clima Project. Online www.fing.edu.uy/inco/grupos/cecal/hpc/digiclima, May 2015.
[2] G. Usera, S. Nesmachnow, F. Brasileiro, M. Da Silva, and S. García, “Recovering historical climate records through grid computing”, in Latin American eScience Workshop, São Paulo, Brazil, 2013.
[3] S. Nesmachnow, “Computación científica de alto desempeño en la Facultad de Ingeniería, Universidad de la República, Uruguay”, Revista de la Asociación de Ingenieros del Uruguay, vol. 61, pp. 12–15, 2010.
[4] GISELA. Grid Infrastructures for e-Science virtual communities in Europe and Latin-America. Online www.gisela-grid.eu, May 2015.
[5] F. Brasileiro, E. Araujo, W. Voorsluys, M. Oliveira, and F. Figueiredo. 2007, “Bridging the High Performance Computing Gap: the OurGrid Experience”, in Proceedings of the Seventh IEEE International Symposium on Cluster Computing and the Grid, Washington, DC, USA, pp. 817–822, 2007.
[6] S. Nesmachnow, S. García, G. Usera, F. Brasileiro, “Grid Computing para la recuperación de datos climáticos” in VI Conferencia Latinoamericana de Computación de Alto Rendimiento, San José, Costa Rica, 2013.
[7] S. Nesmachnow, M. Da Silva, “Semi-automatic historical climate data recovering using a distributed volunteer grid infrastructure”, in International Sipercomputing Conference in Mexico, Ensenada, México, 2014.
[8] H. van Piggelen, T. Brandsma, H. Manders, J. Lichtenauer, “Automatic curve extraction for digitizing rainfall strip charts”. Journal of Atmospheric and Oceanic Technology, vol. 28, pp. 891–906, 2011.
[9] M. Sezgin and B. Sankur. “Survey over image thresholding techniques and quantitative performance evaluation”, Journal of Electronic Imaging, vol. 13, pp. 146–168. 2004.
[10] J.P. Balarini, S. Nesmachnow, “Recovering Historical Climate Records using Parallel Artificial Neural Networks in GPU”, in International Supercomputing Conference in Mexico, Ciudad de México, México, 2014.
[11] R. García-Herrera, G. Können, D. Wheeler, M. Prieto, P. Jones, and F. Koek. “CLIWOC: A climatological database for the World’s oceans 1750–1854”. Climatic Change, vol. 73, pp. 1–12, 2005.
[12] C. Wilkinson, S. Woodruff, P. Brohan, S. Claesson, E. Freeman, S. Lubker, C. Marzin, and D. Wheeler. “Recovery of logbooks and international marine data: the RECLAIM project”, International Journal of Climatology, vol. 31, no. 7, pp. 968–979, 2011.
[13] Old Weather Project. Online www.oldweather.org, May 2015.
[14] R. Deidda, G. Mascaro, E. Piga, and G. Querzoli, “An automatic system for rainfall signal recognition from tipping bucket gage strip charts”, Journal of Hydrology, vol. 333, pp. 400–412, 2007.
[15] W. Gropp, E. Lusk, and A. Skjellum, Using MPI: Portable Parallel Programming with the Message-Passing Interface, MIT Press, Cambridge, MA, USA, 1999.
[16] I. Sfiligoi, “glideinWMS—a generic pilot-based workload management system”, Journal of Physics: Conference Series, vol 119, no. 6, pp. 44–62, 2008.
[17] A. Luckow, L. Lacinski, S. Jha, “SAGA BigJob: An Extensible and Interoperable Pilot-Job Abstraction for Distributed Applications and Systems”, in 10th IEEE/ACM International Conference on Cluster, Cloud and Grid Computing, pp. 135–144, 2010.
[18] S. García, S. Iturriaga, and S. Nesmachnow, “Scientific computing in the Latin America-Europe GISELA grid infrastructure”, in Proceedings of 4th HPC Latin America Symposium. Córdoba, Argentina, 2011.
[19] P. Kunszt, P. Badino, A. Frohner, G. McCance, K. Nienartowicz, R. Rocha, and D. Rodrigues, “Data storage, access and catalogs in gLite”, in Local to Global Data Interoperability–Challenges and Technologies, pp. 166–170, 2005.
[20] B. Koblitz, N. Santos, and V. Pose, “The AMGA metadata service”, Journal of Grid Computing, vol. 6, 61–76, 2008.
[21] P. Sarang. Practical Liferay: Javabased Portal Applications Development. Apress, Berkely, CA, USA, 2009.
[22] J. Linwood and D. Minter, Building Portals with the Java Portlet API (Expert's Voice), Apress, Berkely, CA, USA, 2004.
[23] O. Nov, D. Anderson and O. Arazy. “Volunteer computing: a model of the factors determining contribution to community-based scientific research”, in Proceedings of the 19th International Conference on World Wide Web. New York, USA, 741–750, 2010.
[24] D. Anderson and G. Fedak. “The Computational and Storage Potential of Volunteer Computing”, in Proceedings of the Sixth IEEE International Symposium on Cluster Computing and the Grid, Washington, DC, USA, pp. 73–80, 2006.
[25] W. Cirne, F. Brasileiro., N. Andrade, L. Costa, A. Andrade, R. Novaes, and M. Mowbray. “Labs of the world, unite!!!” Journal of Grid Computing, vol. 4 pp. 225–246, 2006.
[26] S. García, S. Iturriaga, S. Nesmachnow, M. da Silva, M. Galnarés, and G. Rodriguez. “Developing parallel applications in the GISELA grid infrastructure”. In Proceedings of the Joint GISELA-CHAIN Conference, 9–16, México, 2012.
Acknowledgements
The Digi-Clima and Digi-Clima Grid projects have been partly funded and received financial support from the World Meteorological Organization; the National Direction of Water, Uruguay, the Departmental Government of Montevideo, Uruguay, and the Latin American and Caribbean Collaborative ICT Research Federation (LACCIR). The work of S. Nesmachnow is partly funded by ANII and PEDECIBA, Uruguay.

