


Servicios Personalizados
Revista

Articulo
 Inglés (pdf)
 Articulo en XML
 Referencias del artículo
Links relacionados
Compartir

 Permalink
CLEI Electronic Journal
versión On-line ISSN 0717-5000
CLEIej vol.16 no.3 Montevideo dic. 2013
A Data Pre-Processing Method for Software Effort Estimation Using Case-Based Reasoning
Katia Cristina A. Damaceno Borges
Iris Fabiana de Barcelos Tronto
Universidade Federal de Viçosa – UFV- CRP
Rio Paranaíba, Brasil
{katia.borges,iris.tronto}@ufv.br
and
Renato de Aquino Lopes
Universidade Federal de Uberlândia – UFU
Monte Carmelo, Brasil
and
José Demisio Simões da Silva (in memorian)
Instituto Nacional de Pesquisas Espaciais - INPE
Brasil
Abstract
Software effort estimates is an important part of software development work and provides essential input to project feasibility analyses, bidding, budgeting and planning. Analogy-based estimates models emerge as a promising approach, with comparable accuracy to arithmetic methods, and it is potentially easier to understand and apply. Studies show all the models are sensitive to the quality and availability data, thus requiring a systematic data treatment. In this paper, it is proposed a data pre-processing method for use in software effort estimate. The results of it on applying on applying Case Based Reasoning - CBR that enables us to enhance the precision of the estimates.
Resumo
Estimativa de software é uma importante parte do trabalho de gerenciamento de software, fornecendo informações essenciais para projetar, analisar a viabilidade, licitação, orçamento e planejamento. Estimativas baseadas em analogia surgem como uma abordagem promissora, sendo comparável a precisão de métodos matemáticos e ainda é mais fácil de entender e de aplicar. Estudos mostram que todos os modelos são sensíveis a qualidade e disponibilidade de dados, exigindo para isso um tratamento sistemático. Este artigo propõe um método de pré-processamento de dados para utilização dos mesmos em estimativas de esforço de software. Os resultados obtidos sobre a aplicação de Raciocinio Baseado em Casos – RBC, permitiram aumentar a precisão das estimativas realizadas.
Keywords: effort estimates, cost management, accuracy of estimation, ISBSG.
Palavras: estimativas de esforço, gerenciamento de custo, precisão das estimativas, ISBSG.
Received: 2013-03-01, Revised: 2013-11-05 Accepted: 2013-11-05
1 Introduction
Due to the great development of hardware and software and with the advent of globalization, it has increased the competition between software enterprises. There is a constant search for software every time more robust, with bigger quality, in agility in time with low cost.
An effective management of projects are crucial for an enterprise to reach the goals and to maintain itself in this competitive market. Therefore it is necessary an implementation of a group of activities, among them there are the making of size estimation, effort, cost and time for development required to deliver a certain software.
An estimation of accuracy and concise effort (quantity of men/hours required for the development of the software) are crucial for the effective management of the software project. However, the bibliographical canvas made by Young and others (19) reveals worrying data, 59% to 76% of the projects are delivered with an effort superior than. And 35% to 80% are delivered in delayed term. In Brazil the cenary is a little different, according to the research made by the Science and Technology Cabinet – STC, only 45,7% perform estimates for software effort(12). There are no specific studies that identify the causes of the low index of effort estimates use, but the low levels of trust in the models can be a possible cause.
Despite of extensive researches, the software community is still challenged when it comes to effective estimates. As results of these researches several different models have been suggest, which include: regression analysis (15), COCOMO (7), Analysis Point per Function (3), estimation by analogies (16), clustering techniques (20) and artificial neural nets – ANN [8, 14].
The results of a research using case based reasoning (4), about the data group COCOMO (6) point out that a preliminary analysis of the historical data increases the trust of the estimates. Although the data analysis has been performed, it was not established a systematic procedure, that other researchers can apply to the generation of their models.
Considering what is exposed, it is necessary to have a systematic approach that can be applied for the performing of estimates with a higher level of precision. The goal of this study is to present a method data to support the data pre-processing for software effort estimation. It was performed a case study using reasoning based on cases, about the data group ISBSG (International Software Benchmarking Standards Group) 10th version (9) based on the group of variables selected with the application of the method data presented.
The article is organized in six sections. In the next section presents a brief description of the work related to the application of different approaches for software estimates, followed by a description of the CBR technique. The method the pre-processing data are then presented. Later it will be presented a case study. The last section presents our final remarks.
2 Related Study
Techniques of data mining have been frequently used to exploratory data analysis in software engineering, as observed in the International Workshop about Software Repositories Mining.
Several methods for exploratory data analysis have shown efficiency to the estimates executed, among them the probabilistic models used by Sentas and others (15), the Ordinal Regression method – OR, clustering applied in order to perform software quality estimates (20). In this study, it is applied ANOVA to verify the impact of the independent categorical variable over the dependent variable. This method adjusts itself to situations in which the data group presents a large number of categorical variables.
Over the thirty years it was already suggested that the analogy formed a good base of forecasting the software effort (7). Therefore a tendency has been established when referring to the application of CBR to solve problems related to management of software projects. The development of a system, based on CBR, similar to a software specialist and with accuracy bigger than the model for estimates COCOMO (7) or points per function (3), was proposed by Vicinanza (18). This system was named Estor. However, as it was conceived it is necessary the acknowledge of a specialist so as to derive rules of estimates and create a Case Base. Another project based on CBR to perform estimates it is the FACE (Finding Analogies for Cost Estimating) (6).
Studies show that CBR presents advantages when compared to other management techniques of knowledge and paradigm of Artificial Intelligence (1). Therefore the use of CBR brings reductions to the problems associated to specifying and codification of knowledge, manipulation of cases that failed and makes it easier for the users to identify situations apts to a high risk. Another factor that overcome the sympathy of the users is the fact that the CBR is similar to the way a human solves the problems.
3 Case Based Reasoning - CBR
CBR is a technique, based in analogy, that will solve new problem getting answers from previous problems. In the reasoning by analogy it is searched the identification of similar characteristics in earlier and current problems, with the goal of evaluating answers to develop a better solution to the new problem. Considering that the quality of a CBR system which is strongly related to its experience, in other words, it depends on the number on relevant cases that composes a data base. According to Aamodt and Plaza (1), the knowledge referred to previous experiences (cases) is used to solve new problems, considering what a solution is found through the recovering of a similar case in the past. The cases are described as a group of characteristics, attributes, such as the size of a file, the number of interfaces or development method. CBR solves the new case via the recovery and adaptation of earlier cases (solved previously).
The CBR process is described by Aamodt and Plaza (1) and consists of four steps: codification, recovery, reuse and retention. These four items constitute a cyclic process. So that, whenever a new problem is presented, it is decoded in a vector of attributes (or descriptions of the problem) and effects the search in the repositorys memory, the bigger the degree of attributes overlapping, the more effective will be the similarity measurements and the case recovery. The goal is to make a decreasing classification of similarity to the new case and to use solutions known of the closer k cases. Therefore, the solutions derived from the recovered cases can be adapted to be better adjust to a new case using rules, a human specialist or simply a statistic procedure. For this last case, the system is called Nearest Neighbor Technique (K - Nearest Neighbor – NN). When this new case is completed it is incorporated to the cases base.
Therefore, the cases base grows with time and with the new knowledge acquired. It is of extremely importance a maintenance of the cases base, because the bigger it is the better will be. It is relevance to the reuse of new cases.
4 A Method Data Proposed
When an enterprise participates in a contract bidding or even develops a software in the own organization, make effort estimation is a critical activity. The problem considered in this article is the development of a method data that can help some projects manager to predict the quantity of effort used to development of a new software.
If an enterprise already has a group of items collected in its historic database, it can be used to predict a new software effort estimate and whether it does not it should create a measurement program to collect and store a historic data of its projects.
Thus, before collecting data about the parameters to an estimate model it must be carefully defined what factors influence the effort of projects in a determined organization. Besides that, it is important to have an idea of how the parameters must be used to produce effective estimates.
The method data presented in the First Figure is constituted of three steps: the data preparation, the pre-processing of data and the making of effort estimates.
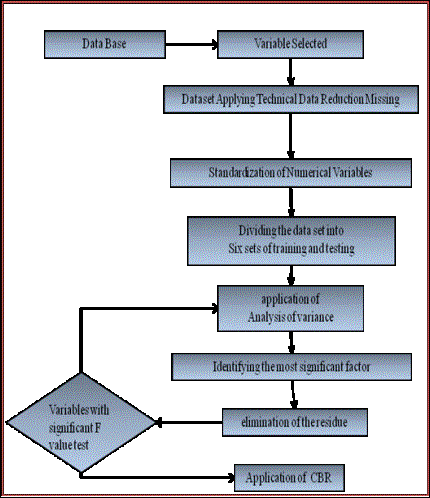
Figure 1: Method data developed
Selection of variables: the selection of variables will occur through knowledge expressed in the literature about factors that influence the software effort and eventually it will be able to be used the previous knowledge of the project manager to help the selection.
1. Analysis and treatment of lost data: an occurrence of lost data forbids the application of some techniques of prediction, about the data group. To solve this problem lots of researches have been performed in an investigate on the application of lost data treatment technique, in other words, the blank space in the variables. Among these techniques there are some contrasts: omission techniques (13), imputation techniques (17) and technique of lost data tolerance(2).
2. Normalization of numerical variables: when applying a statistics technique, it is common to verify whether the numerical variables is close to a normal curve. There are different ways to decide if a group of values have normal distribution: a) the formal tests of normality (21); b) simple visual methods such as normal probability graphic. When a variable stabilization is required, a natural transformation, in other words, log in the e base, is effective; for more information about transformations see Hoaglin et al. (9). Thus, when a non-normality occurs in numerical variables it is suggested a logarithm transformation.
3. Division of the group of data in subgroups of test and training: it has been done the same procedure as in (11) with the goal of investigating the precision of an estimation built in this study. Kitchenham developed a simple procedure to investigate the precision of the predictions done by his model over the COCOMO database. Based in this process, it was omitted a subgroup of projects (the group of test data), after that it was developed a model with the remaining projects (the group of training data) and finally it was evaluated the precision of the predictions of a model over the test data group. Thereby, it was created six pairs of training and test groups. The training group was built to remove every sixth project, beginning from the first project. Each removed data group represents the respective test data group.
The second step of the method data refers to the pre-processing of a treated data group. The pre-processing must be done to identify a subgroup of variables that have a bigger significance over the effort. Previous researches developed by authors (4) and (5), show that the data pre-processing have a very significant impact in the precision on estimate models of data effort. The approach of pre-processing used, adapted from Kitchenham (11), is constituted of the following steps:
1. If necessary, to transform the variable corresponding to the effort to enhance a normality, in particular, the variance stability. Logarithms transformations are, generally, effective. To obtain more information about logarithms transformations consult (4) or (17).
2. Apply simple variance analysis (ANOVA) using each factor (to variables of nominal or ordinal scales), and simple regression analysis to each variable of absolute scale.
1. Identify the most significant factor, in other words, from a group of factors that have a statistically significant effect over the effort, chose the one that has the smallest mistake term.
2. Remove the effect of the most significant factor (in other words, for each level of the factor, it should be reduced the medium factor value from the project effort value) and obtained the residues.
3. Apply ANOVA using each remaining factor over the residues. It should be reduced the levels-of-freedom applied to a mistake term (because K-1s levels-of-freedom were used to remove the impact of the most significant effort, in which K is the number of levels of the most significant factor).
4. Eliminate the redundant factors. The factors that were considered significant in an original analysis, but did not have a significant effect over the residues,they are confused with the most significant factor of previous analysis. Confused factors must be identified and excluded from a subsequent analysis. Although there is the risk of a factor being removed without need, it is important to recognize that over the use of this procedure it can be obtained an acceptable model. It reduces the risk of occuring certain analysis problems and it could be the base for some future researches, but as any other analysis technique, it cannot guarantee the generation of a real model.
5. Identify the next most significant effort. Only the factors that have a significant effort based on variance analysis over the residues must be considered, and again, if there are lots of candidate factors, chose the one that has the smallest mistake term.
6. Remove the most significant factor effect and obtain the second residue.
7. Repeat the analysis procedure until all the significant factors are removed, or until there is not enough levels-of-freedom to continue. It must be assured that there are at least four levels-of-freedom available for a mistake term rather than ten.
Factors of the absolute and interval type can be easily included in the analysis procedure. Their impact over the variable answer can be evaluated using linear regression and calculating the medium square due to the regression equation. If a factor of an absolute or interval type is considered as the most significant, its effect should be removed and the residues analysis should continue. In this case, the levels-of-freedom attributed to the mistake term in the subsequent analysis must be reduced to one. It is important to note that in statistic, the variable and factor terms are used indistinctly.
The third step it is the application and it refers to the making of the software effort estimate using a technique to be chosen according to the abilities and knowledge of the team responsible for the estimates, for example: Case Based Reasoning – CBR, Artificial Neural Nets – ANN, statistics techniques, among others.
5 Case Study
In this section it is presented the data group used in this analysis, the preparation and approach techniques followed to construct and evaluate cases.
To make this study it was used the ISBSG database, tenth version (9), and it was applied in it the method data described in the first Figure, which consists of a pre-processing of the stored data in this repertory and afterward evaluation of the variables that influence the case.
5.1 The Data Group
The data group used was the ISBSG (International Software Benchmarking Standards Group), 10th version, (9), that consists of a total of more than 4100 projects, originated from the enterprises located in 24 different countries. Due to the fact of being a data group containing projects implemented less than 9 years ago and using software development with modern techniques, it is widely used by the academic community for the making of several researches in the software estimate area ((8)) and others).
5.2 Data Preparation
In this subsection it is described a sequence of preparation of the original data group.
5.2.1 Variables Selection
The initial process of variables selection it is based on literature studies about variables that influence the effort (5). It was selected 14 independent variables (Table 1) and the dependent variable: (Summary Work Effort).
Table 1: Independent Variables
5.2.2 Analysis and treatment of Lost Data
Due to a big quantity of lost data contained in the ISBSG repository, what means the blank spaces in the variables, the prediction becomes difficult. Thus, to solve this problem, it was considered an omission in this study, due to its simplicity. For example, all of the registers referred to the variable Development Techniques, which did not contain any data were eliminated. After this procedure, the resultant data group used in this study was composed by 403 projects.
As most part of the variables selected containing categorical data, it has being necessary to pre-process the registered data. Therefore, it was attributed numerical values for each factor, in each project. Besides, it was applied a procedure to convert the adjusting factors for levels, according to the illustration in Table 2.
Table 2: Independent Variables
Variance analysis – ANOVA is a method, generally applied to decide whether different levels of a factor affect the answer of a variable (in this case, effort). This analysis permits to test if there is a significant differences between the medium levels in each factor. It restricts to the mediums of levels from each factor for the proposal of this study.
Each one of the categories variables were submitted to the ANOVA process of only one factor to verify the impact of each factor over the original dependent variable and to identify the categories that need to be connected in each factor. Through these tests it was possible to compare each category (level) of a factor with all of the other categories in the same factor and determine the significance of the difference. Based on the result obtained from this analysis, the categories of each independent variable which are not significantly different were connected and recoded in homogeneous groups for each factor.
5.2.3 Normalization of the Numerical Variable
It was verified that a numerical variable, Summary Work Effort and Adjusted Function Points, it did not have a normal distribution for them to be applied to a static methods, such as regression analysis and variance analysis. As these are parametric statistic methods and require an approximate normal distribution, the first step is to evaluate if the effort (the answer variable given by the Summary Work Effort) has a normal distribution. The second Figure shows the effect of producing a graphic representation of normal probability to the values of gross effort of the second group of data training.
The diagram of data scattering is clearly not linear. Thereby, it is reasonable to assume that the data do not have a normal distribution. To enhance the normality it was applied a normal transformation, in other words, log in the e basis. The third figure shows the diagram of normal probability after the application of a logarithm transformation over the effort values of the second training group.
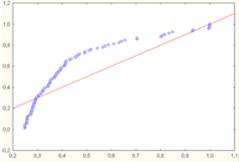
Figure 2: Diagram of the normal probability for the raw data
It is easy to note that the data scattering diagram is more linear. Therefore, the analysis procedure shown in the case studies was done over the transformed data. The variable Summary Work Effort (workers effort/ month) and points per function adjusted were transformed to enhance the normality.
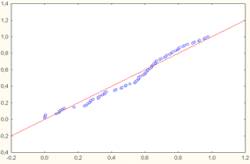
Figure 3: Diagram of the normal probability for the transformed data
5.2.4 Subdivision of the Data Group
Based on the technique presented in the fourth section, there were built six groups of test and training. Thereby the test data group 1 was built removing the projects: 1, 7, 13, 19, 25, 31 (
), the test data group 2 was built removing the projects: 2, 8, 14, 20, 26, 32(...), this process was repeated for the selection of six test groups. Knowing that all of the 403 projects of the ISBSG data group (9) were used to construct the model the learning data group counts with 5 groups containing 335 projects and one with 336 projects.
5.3 Pre-processing of variables
The approach (adapted from Kitchenham, (11)) was applied over six learning data group derived from the ISBSG data group. This section explains the approach followed the selection of these variables which will be used after in the application of CBR in the pre-processed group.
5.3.1 Variables selection
The problem in the estimate using a data group with a big number of categorical variables (factors) can be solved using a procedure based in combined statistics techniques how it was described in the fourth section.
The variables selected in each one of the training groups were used to make estimates over the pre-processed data group. The variables selected in each training subgroup were: TAM, LINGPROG, and PLATFDES.
5.3.2 Make Effort Estimates
To make a software effort estimates it was chosen the CBR technique in the recovery of similar cases, using the K-NN similarity algorithm (K – Nearest Neighbors). To do so, it was used the WEKA software. For each test subgroup it was searched the similar cases within the database of the training group, providing then the estimate effort for each test project.
5.3.3 Precision Analysis and Estimates Evaluation
Different mistake measurements have been used by different researchers, but for this study it was used two measurements of the precision of the model: the Mean Magnitude of Relative Error (MMRE) (2) and the PRED (x) (2).
MMRE is the medium of the absolute percentage errors:

In which n is the number of projects, Mact is the real effort observed and Mest is the estimated effort.
The Pred(x), on the other hand, is an indicator of accuracy that shows the percentage of measurements which the MRE is smaller than x. According to the definition of McConnell (22) to evaluate if an organization has done good estimates it has to commit mistakes up to 25% in 75% of the cases, in other words, PRED (25%) ≥75%.

The third and fourth Tables summarize the MMRE found for the subgroups of gross and pre-processed data after CBR application. In this dimension, the performance after the proposed method data application is relatively better than when applying the CBR to the gross data.
Table 3: Accuracy after application CBR of Data Raw
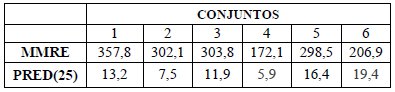
Table 4: Accuracy after application CBR of Data Pre-processed
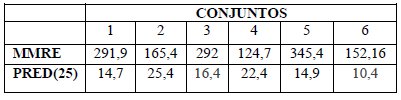
This experience illustrates two points, the first is that the method data selected in a consistent manner the variables that influence the effort, and the second shows that with CBR application the results were enhanced in more than 80% the subgroups.
6 Suggestions for Beginners
This article shows a data pre-processing method data, specifically used to select a subgroup of variables related to the software effort estimate, from a software project database. This method data was instantiated and presented with a case study, in which is used the ISBSG project database and the CBR technique to make a software effort estimate.
In this study models of effort estimate were calibrated and tested to present approaches that can be used by an organization of software development which wants to apply estimate models in its project managing.
CBR applied over the pre-processed data had a more satisfactory development, when the method data is applied over a data group without the pre-selection of the variable subgroup. The improvement in terms of MMRE occurred in 80% of the subgroups and when analyzing the PRED (25) it is observed that the success rate enhanced in all of the subgroups. The fact of the cases base being much reduced through the application of lost data treatment technique, could have hampered the location of similar cases and influenced the result to the other data group.
Therefore, new studies are being conducted to investigate if this hypothesis, applying a new technique of lost data treatment, providing thereby an increase in the cases base.
Acknowledgements
CNPQ (Conselho Nacional de Desenvolvimento Cientifico e Tecnológico).
References
(1) Aamodt, A.; Plaza, E.: (1995) Case based reasoning: foundational issues, methodological variations, and systems approaches. AI Communications, 7, p.39–59.
(2) Aggarwal, C.C. and Parthasarathy, S., (2001), Mining massively incomplete data sets by conceptual reconstruction, Proceeding of the Seventh ACM SIGKDD Conference on Knowledge Discovery and Data Mining, pp. 227-232.
(3) Albrecht, A. (1979) Measuring application development productivity, Proc. IBM Application Development Symposium, pp. 83-92.
(4) Barcelos Tronto, I. F., Silva, J.D.S., SantAnna, N., (2006). Melhorando as estimativas de esforço de software através de um modelo baseado em analogia. In: SEMISH- Seminário Integrado de Software e Hardware, Campo Grande, Julho, 2006.
(5) Barcelos Tronto, I. F., Simões da Silva, J.D. and SantAnna, N. (2008). Na investigation of artificial neural neworks based prediction systems in software Project management, Journal of Systems and Software 81(3): 356 -367.
(6) Bisio, R., Malabocchia, F., Cost estimation of software projects through case base reasoning. 1st Intl. Conf. on Case-Based Reasoning Research & Development, Springer-Velag, pp. 11-22.
(7) Boehm, B.W. (1981) Software engineering economics, Prentice-Hall, Englewood Cliffs, NJ.
(8) Buglione, L. Gencel, C. (2008) "Impact of Base Functional Component Types on Software Functional Size based Effort Estimation," Proceedings of PROFES 2008 Conference, LNCS 5089, A.Jedlitschka & O.Salo (Eds.), pp.75-89.
(9) Hoaglin, D.; Mosteller, F.; Tukey, J. Understanding robust and exploratory data analysis. New York: John Wiley & Sons, 1983.
(10) ISBSG, International Software Benchmarking Standards Group Dataset. Release 10, 2007, [Online]. In: http://www.isbsg.org/.
(11) Kitchenham, B., (1998). A procedure for analyzing unbalanced datasets.IEEE transactions on Software Engineering 24, pp. 278–301.
(12) MST Ministério da Ciência e Tecnologia, (2001) Qualidade e Produtividade no setor de software, In: http://www.mct.gov.br/Temas/info/Dsi/Quali2001/2001Tab402001Tab40.htm, Tabela 40 – Práticas de Engenharia de Software no Desenv. e Manutenção de Software.
(13) Roth, P., Missing (1994) Data: A Conceptual Review for Applied Psychologists. Personnel Psychology, v.47, pp. 537-560.
(14) Samson, B. Ellison, D. and Dugard, P. (1997) Software Cost Estimation Using Albus Perceptron (CMAC), Information and Software Technology, vol.39, pp. 55-60.
(15) Sentas, P. Angelis, L. Stamelos, I. and Bleris, G. (2005) Software productivity and effort prediction with ordinal regression, Journal Information and Software Technology, no. 47, pp.17-29.
(16) Shepperd, M. and Schofield, C. (1997) Estimating Software Project Effort Using Analogies, IEEE Transactions on Software Engineering, vol.23, no.12, pp.736-743.
(17) Troyanskaya, O., Cantor, M., Sherlock, G., (2001) Missing Value estimation Methods for DNA Microarrays. Bioinformatics, v. 17, pp. 520-525.
(18) Vicinanza, S., Prietula, M.J. and Mukhopadhyay, T. (1990). Case-based reasoning in software effort estimantion, In Proc. 11 Int. Conf. Info. Syst., pp 149-158.
(19) Yang, DA. Et al (2008) A Survey on Software Cost Estimation in the Chinese Software Industry. Of: ESEM 08: Procedings of the Second ACM-IEEE Intenational Symposium on Empirical Software Engineering an Measurement, pp.253-262.
(20) Zhong, S.; Khoshgoftaar, T.M.; Seliya, N.: (2004) Analysing Software Measurement Data with Clustering Techniques. IEEE Intelligent Systems, pp.20-27.
(21) Shapiro, S.; Wilk, M. (1965) An Analysis of variance test for non-normality (complete samples). Biometrics, v. 52., p.591-611. .
(22) Mcconnell, S. (2006). Software Estimation, Demystifying the Black Art. Microsoft Press.

