


Services on Demand
Journal

Article
 English (pdf)
 Article in xml format
 Article references
Related links
Share

 Permalink
CLEI Electronic Journal
On-line version ISSN 0717-5000
CLEIej vol.16 no.3 Montevideo Dec. 2013
Abstract
Motorcycle accidents have been rapidly growing throughout the years in many countries. Due to various social and economic factors, this type of vehicle is becoming increasingly popular. Over the past years, automated mechanisms to inspect traffic violations such as radars and surveillance cameras are being used ever more. This paper’s goals are the study and implementation of some methods for automatic detection of motorcycles on public roads. Traffic images captured by cameras were used. For feature extraction of images, the algorithms SURF, HAAR, HOG and LBP were used as descriptors. For image classification, Multilayer Perceptron, Support Vector Machines and Radial-Bases Function Networks were used as classifiers. Finally, the results are presented and discussed.
Portuguese abstract
Acidentes envolvendo motocicletas vem crescendo rapidamente através dos anos em muitos países. Devido a diversos fatores sociais e econômicos, esse tipo de veículo tornou-se popular. O principal equipamento de segurança dos motociclistas é o capacete, mas muitos não o usam. Com o passar dos anos surgiram mecanismos automáticos para monitorar violações no tráfego como radares e câmeras de segurança. Esse trabalho tem como objetivo o estudo e implementação de alguns métodos para detecção de motocicletas em vias públicas. Imagens de tráfego capturadas por câmeras foram utilizadas. Para extração de atributos das imagens, os algoritmos SURF, Haar, HOG e Fourier foram utilizados como descritores. Para classificação das imagens foram utilizados os classificadores Perceptron de Múltiplas Camadas, Máquina de Vetor de Suporte e Redes de Função de Base Radial.
Keywords: Classification, Motorcycle, Machine Learn.
Portuguese keywords: Classificação, Motocicleta, Aprendizado de Máquina.
Received: 2013-03-01, Revised: 2013-11-05 Accepted: 2013-11-05
In the last decade, an increase in the number of motorcycle accidents was observed. According to the National Traffic Department in Brazil (DENATRAN), in January 2012, Brazil had a fleet of  motorcycles and scooters.
Due to the large number of existing vehicles, researches in intelligent traffic systems became popular, including detection, recognition and vehicle counting, and traffic parameters estimation.
Segmentation of motorcycles on public roads can be seen as the first step to develop any research in traffic estimation as speed computation, motorcycle helmet use, vehicle tracking and occlusion processing.
Over the past years many works were carried out in traffic analysis on public roads [ 1, 2, 3, 4].
A segmentation and classification vehicle system was proposed in [ 5]. It also computes the approximate speed of the vehicle. Three-dimensional models are created based on the vehicle size. The vehicle size changes depending on the vehicle class (car, bus, pedestrian, etc). In the classification phase, the generated models are compared to the computed models. The main drawback of this paper is that a single model is used for both bicycles and motorcycles.
In [ 6] it was proposed a computer vision system aiming to detect and segment motorcycles partly occluded by another vehicle. A helmet detection system is used, and the helmet presence determines that there is a motorcycle. In order to detect the helmet presence, the edges are computed on the possible helmet region. The Canny edge detector [ 7] is used. The quantity of edge points which are similar to a circle define if the region corresponds to a helmet. The method needs so much information that it must be provided by a user (helmet radius, camera angle, camera height, etc).
In another paper [ 8], a system that identifies vehicles even if part of it is occluded was implemented. The system can track the detected vehicle even if the occlusion continues to occur.
A computer vision system for bicycle, pedestrian and motorcycle detection is proposed in [ 9]. The system detects moving objects (horizontal motion) and pedaling movement (vertical motion) using the Gabor filtering. The HOG descriptor is computed and the SVM classifier divides the objects into two classes: two-wheeled vehicle and pedestrian. At the end, the vertical motion is computed and the two-wheeled vehicle is classified into motorbike or bicycle.
Sonoda et al. [ 10] proposed a system to detect moving objects. The system aims to detect moving objects at an intersection (like vehicles and pedestrians), and warn the driver. They use the Mixture of Gaussians to detect the moving objects and the Lucas-Kanade Tracker algorithm for pedestrian tracking.
Chiverton [ 11] described and tested a system for the automatic classification and tracking of motorcycle riders with and without helmets. The system uses support vector machines trained on histograms. The histograms are derived from head region of motorcycle riders using both static photographs and individual image frames from video data. A high accuracy rate was obtained but the number of test images is insufficient.
The aim of this study was to propose and develop a system for automatic detection of motorcycles on public roads. For this purpose, we created a strategy divided into four parts: region of interest determination, background detection, dynamic objects segmentation and vehicle classification. In the specific case of the classification of detected vehicles in non-motorcycle or motorcycle, a comparative analysis was performed to identify the best pair of descriptor and classifier. In order to do this, SURF, HAAR, HOG and LBP descriptors, and Multilayer Perceptron (MLP), Radial-Bases Function Networks (RBFN) and Support Vector Machine (SVM) were used as classifiers.
This paper is divided as follows. In Section 2 the problem of motorcycle detection is detailed, the main steps of this problem are depicted in the Sections 3, 4, 5, 6 and 7. The results are presented in Section 8.2 and discussions in Section 9.
This work deals with the problem of detecting motorcycles on public roads. The problem can be split into five steps. The first step of the solution is related to the determining the background image. This step aims to determine an image that will serve as a pattern to identify which objects are in motion. Next, a dynamic detection of objects is made from the subtraction of the current image with the background image computed in the previous step. The third step is the tracking; this step aims to not processing the same object two times or more. At the end, the detected objects are segmented and the algorithm for feature extraction is used in order to classify them into two classes: motorcycle and non-motorcycle. The Figure 1 shows how the problem is solved.
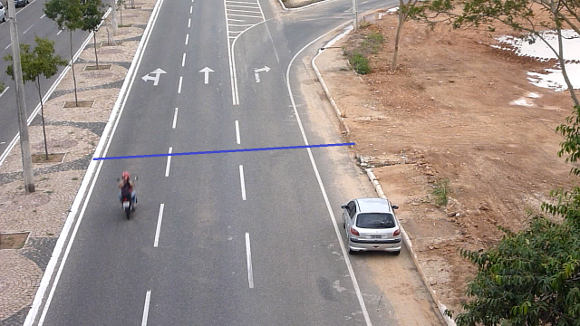
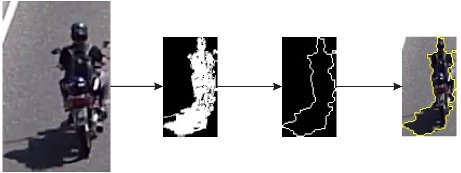

Figure 1: The three main steps of the segmentation process of dynamic objects. The first figure shows the example of background determination. The second figure shows the steps for determining the dynamic object, and the last figure is the result of all processing including the vehicle count.
The background image detection is very important to the development of this work. The main objective of this step is the determination of an image that will be used for the dynamic objects detection.
Traffic images captured by video cameras were used. The frames were captured and used to create an image which represents the background scenario. In the course of time, this background is subject to change. The algorithm used to update the image background was the adaptive Mixture of Gaussians [ 12].
In the problem of motorcycle detection on public roads, the segmentation of the dynamic objects in the scene allows only objects of interest in the image to be evaluated. This causes a reduction in processing time, because the classification algorithm works only with a small area of the image. It also reduces the probability of false-positive outputs in classifiers.
The background subtraction method gets all points that have changed in a scene [ 13]. In environments where the static objects change with time (parked vehicles along the roads, changing position of the shadow over the hours, etc), the algorithms to calculate adaptive backgrounds are necessary.
In our goal for the dynamic object segmentation, it is necessary to define a line (see the Figure 1) that will serve as a marker. When the vehicle crosses the line, the process of dynamic object segmentation begins.
When the vehicle crosses the line, the frame is captured. After this, an image resizing to a smaller size is made. The purpose of this is to reduce the processing time; this causes the computational performance to increase. The motion detection is made using the Mixture of Gaussians algorithm [ 12]. The image is obtained through the subtraction between the current frame and the background image. The corresponding grayscale image is computed. After this, the threshold calculation is also done. One morphological closing operation is used in order to remove the image noises. The next step is the shape detection; for this we use the algorithm proposed in [ 14].
For each shape found, if there is an intersection between the diagonal of the shape and the line defined by the user and if there is not a tracking point already, then one is added. If there is a tracking point in the edge, it means that this object has been analyzed and a tracking point is not necessary. This process can be seen in Figure 1.
The next step is to compute the optic flow of the object; it is computed using the algorithm proposed in [ 15]. The optic flow detects when a vehicle is the same in another instant, which makes a vehicle count possible. The optic flow is necessary to not detect the same vehicle multiple times. The optical flow is computed only for the tracking points; this decreases the computational processing time. The Figure 1 shows the result of the processing.
02 Image resizing to a lower resolution -
 ;
; 03 Background detection by Mixture of Gaussians algorithm;
04 Subtraction image between the current frame and the background image;
05 Grayscale image and threshold calculation;
07 Morphological operators and shape detection;
09 For each shape:
10 If there is an intersection between the shape diagonal and the line defined:
11 If there are no tracking points then add one tracking point;
12 End If;
13 End For;
14 Generates standard for corners;
15 Compute the optic flow of all tracking points and update them.
An image object has some characteristics such as shape, color and texture. These properties can be measured and they are called object features. These features are normally grouped into a scalar array called “feature vector” or “feature descriptor”. In this paper, the SURF, HAAR, and HOG algorithms are used as descriptors for extracting the object features.
The SURF descriptor [ 16] is based on the Scale-invariant feature transform (SIFT) [ 17]. It uses the same concepts of SIFT, but the algorithm is optimized without any drastic reduction in the description quality. The SURF algorithm was designed to obtain features independently of scale, rotation, illumination changing and viewpoint. It returns two arrays, namely: interest points and descriptor.
The HAAR algorithm is a multiresolution wavelet transform [ 18]. The Haar descriptor is mainly used in pattern recognition and image processing [ 19]. It is also appropriate in communication technologies for data encoding, multiplexing and digital filtering. The HAAR functions are widely applied in numerical calculations because they produce a uniform function system approximation of a function system with various arguments [ 19].
The HOG algorithm [ 20] is a feature descriptor that calculates an image histogram of oriented gradients. The final descriptor is an one-dimensional array of histograms extracted from the image. The algorithm is based on the local object shape and appearance, which in an image can be represented by intensity gradients or edge directions. The feature extraction can be done without an edge position foreknowledge.
The LBP has a good performance in many applications, including classification and texture, image recovery and surface inspection [ 21, 22, 23]. The original LBP [ 24] labels the image pixels for a threshold neighborhood of  . Each pixel is compared with the central pixel and the result is the binary number. The Figure 2 shows how the LBP is computed.
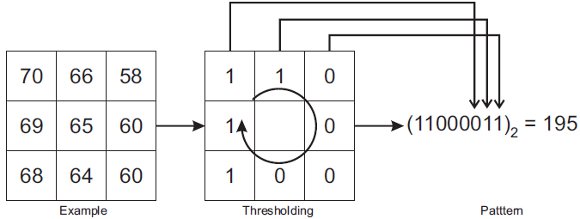
After the threshold, a histogram of  label’s partitions is computed, which can be used like a texture descriptor. Each histogram partition encodes local primitives. The local primitives include different types of edges, curves, stains, plain areas, etc. The most important features of the LBP descriptor are its tolerance to monotonic lighting changes and the computational simplicity.
The main goal of a classifier is to use the object’s features to identify which class it belongs to. The feature vectors that are contained in the same region of decision have similar characteristics. This way, the classifier input is the feature vector which represents an object and the output is the class which that object belongs to.
The vehicle classification task consists of differentiating the segmented objects into two classes: motorcycle and non-motorcycle. In this work, the objects are classified only into just two groups because it does not matter to differentiate cars from bicycles, bus or trucks. It is enough to know that each object is a motorcycle or not.
In this paper we use, in order to classify the segmented objects, the algorithms MultiLayer Perceptron Network (MLP), Radial Basis Function Network (RBFN)and Support Vector Machine (SVM).
The MLP classifier was created to solve complex problems which could not be solved by the basic neuron model. In order to overcome such problems, more neurons interconnections are necessary. This configuration only exists in a Multilayer Perceptron Network [ 25]. The basic principle of a MLP is to create a hyperplane where classes can be discriminated.
In its basic form, the Radial Basis Function Network (RBFN) contains three layers with different goals. The input layer nodes (sensory unit) connects the network to its environment. The second layer applies a nonlinear transformation from the input space to the hidden space and a linear transformation to the output layer [ 25]. When the RBFN is used to perform a pattern classification, the problem is solved by input space transformation into a high dimensionality space. This process is performed in a nonlinear form according to the Cover Theorem [ 26]. The main RBFN objective is to generate a region that fully encloses the desired classes.
The studies about Support Vector Machine (SVM) were introduced by Vapnik [ 27]. The SVM makes an input space mapping into a high dimensionality space . Thereafter, the hyperplane for optimal separation is figured out. To use SVM in pattern recognition it is necessary to convert a nonlinearly separable function in a linearly separable function. This is done by increasing the problem dimensionality .Thereby, it is possible to ensure a larger generalization space. The function that increases the input dimensionality space is called Kernel Function [ 25].
8.1 Methodology for Performance Evaluation and Training
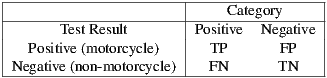
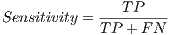
To evaluate the classifiers performance, sensitivity, specificity, positive predictive value (PPV), negative predictive value (NPV) and accuracy were used. All these measures can be calculated based on four values: true positive (TP), number of images correctly classified as motorcycles; false positive (FP), the number of images wrongly classified as motorcycles; false negative (FN), the number of images wrongly classified as non-motorcycles and true negative (TN), the number of images correctly classified as non-motorcycles. Those values are defined in table 1.
From these quantities, the sensitivity, specificity, positive predictive value, negative predictive value and accuracy are computed using equations 1, 2, 3, 4 and 5.
 | (1) |
 | (2) |
 | (3) |
 | (4) |
 | (5) |
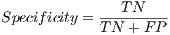
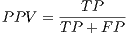
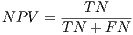
Sensitivity, also known as recall, is the proportion of true positives out of the total number of cases belonging to that class; in other words, it evaluates the classifier ability to predict an image as a motorcycle given that it is a motorcycle. Specificity reflects the proportion of true negatives; i.e., it evaluates the classifier ability to predict an image as a non-motorcycle when it is not. The VPP rate is the proportion of true positives in relation to all positive predictions, i.e. the motorcycle image actually classified as a motorcycle. The rate of VPN is the proportion of true negatives for all negative predictions (non-motorcycle image classified as motorcycle).Finally, accuracy is the proportion of correct predictions without considering what is positive and what is negative but the total hit.
The videos used for tests were obtained from a CCD video camera on public roads during day and night. The videos have a resolution of  pixels, and they are
  minutes long, we use
  videos. All the algorithms were implemented using the MATLAB
 tool and the OPENCV library. The results reported here are based on the vehicles classification stage. There were two required steps to compute the results: feature extraction and vehicle classification.
The segmentation of dynamic objects phase returns a total of  vehicle images . These images are used for the classification phase. The Figure 3 shows examples of images generated in this step.
We did not evaluate the results generated in background detection and segmenting moving objects phases, because this is not in the scope of work.

To generate the results we employed a cross validation strategy that randomly selected half of the dataset for training and half for testing, repeating this process 10 times and averaging the results in order to evaluate the performance of the classification methods.
The SURF descriptor was tested with  ,
,  and
and  octaves. Taking into consideration the accuracy rates obtained and the run time to generate results, it was concluded that the best results were obtained using
  octaves. For the SURF descriptor we used “Visual Dictionaries”. Visual dictionaries are matrices composed of words (matrix rows) that are made by the most representative image points extracted by the SURF algorithm [ 28].
For the feature extraction of the HAAR descriptor, it was used a similar methodology as in [ 29]. The images were resized to different sizes, and the best result was obtained from images of  pixels. The resizing procedure is necessary because all feature vectors generated by the descriptor must have the same size. This was done because the classifier cannot work with vectors of different sizes.
The HOG descriptor has been set up with a  histograms by
  partitions window, we tested other values but that was the best. This way, a vector of
  features is generated. Here, it was also used a large variation of histogram and partition sizes to conclude which one is the best.
The LBP was used with a window of  corresponding to
  histograms. The neighborhood used was
  for the computation of the label. The labels are of
  to
to  . A grayscale image was used for the processing.
The SVM classifier was performed using linear and polynomial kernel functions. Better results were obtained from these functions in comparison to radial basis functions and tangent sigmoid functions. In relation to the MLP classifier, only one hidden layer and a variable number of neurons for each descriptor were used. The RBFN data were normalized first before being trained.
Tables 2, 3 and 4 summarize the classifiers performance for each descriptor used. In all the tested situations, the SVM classifier obtained the highest accuracy rates. The values obtained were  for the HAAR descriptor,
  for the HOG descriptor,
  for the LBP descriptor and
  for SURF descriptor. Therefore, note that the best result was obtained when the SVM classifier was used with the LBP descriptor.
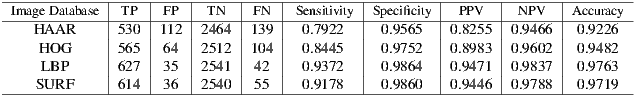
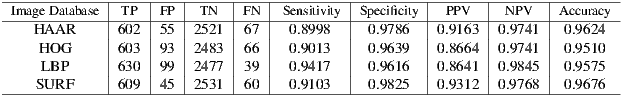
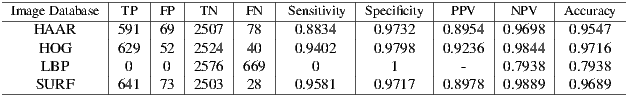
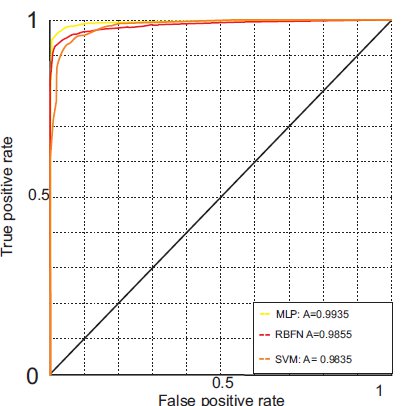
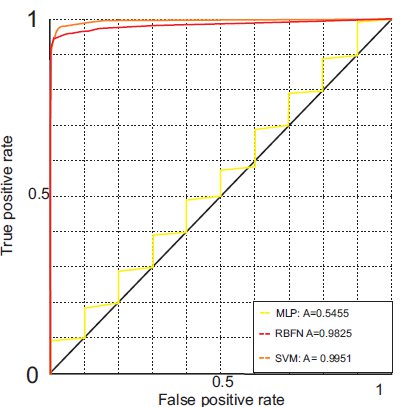
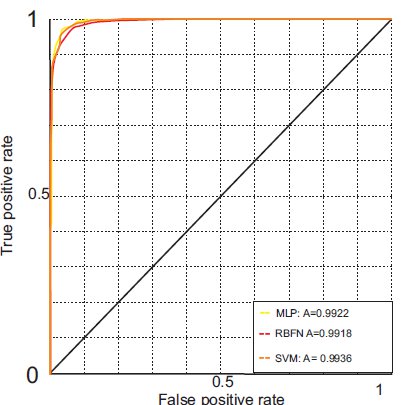
Figure 4 shows the ROC curves for all descriptors and the classifiers. The ROC curve of the SVM classifier and the LBP descriptor has the largest area: 0.9951. This is close to a perfect result (area = 1). This is explained by the results of Table 2.
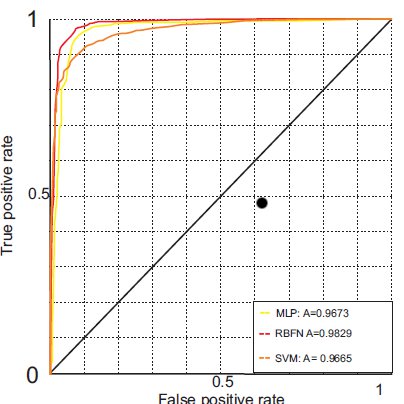
The results presented in Section 8.2 are very satisfactory for the problem of vehicle classification. It was obtained a  accuracy rate when using the LBP descriptor and the SVM classifier. The results show that the LBP descriptor proved to be robust.
The HAAR Wavelet algorithm obtained satisfactory rates too. Its efficiency can be explained by the use of filtering and compression in the images. The filtering result is an almost noiseless information. This causes the classifier learning to be easier and the correct classification of input data.
The results for the SURF descriptor are satisfactory too. This situation can be explained by the use of visual dictionaries. Without the visual dictionaries, the results were not satisfactory (near 0.85 accuracy rate).
The LBP descriptor describes the local texture structure by pattern joint distribution. The texture patterns in motorcycles contribute to the good performance of the classifier using the LBP features.
The SVM classifier presented the best results. The SVM algorithm was designed to separate two classes only, and the main problem of this work consists of classifying vehicles into two classes: motorcycle and non-motorcycle. The poor performance shown by the MLP classifier for the LBP descriptor can be explained by the size of the attribute vector generated (2304 attributes), causing the MLP classifier to fail to converge.
In this study, it was not necessary to set up parameters like camera angle and height and vehicle size, unlike what was proposed by [ 6]. One of the challenges was to differentiate motorcycles and bicycles because they have similar characteristics. SVM combined with LBP proved to be robust enough to make this distinction. This was not observed in [ 5].
The results presented here consist of the first part of a larger project. The main future work is to design an automatic system to detect motorcyclists without helmets. In case of positive response, the system will be able to locate and identify the license plate. After an exhaustive review of the scientific literature, it can be concluded that the design of this system is viable.
Moreover, despite the good obtained results, it is intended to improve them. In order to achieve this goal, the study and implementation of others descriptors and classifiers is necessary. Some classifiers have already begun to be investigated like Kohonen map, K-Nearest Neighbor clustering and Naive Bayes classifier. In addition, another two descriptors will be analyzed: Local Binary Patterns (LBP) features and a variation of the SIFT algorithm called Affine-SIFT (ASIFT).
[1] A. Leelasantitham and W. Wongseree, “Detection and classification of moving thai vehicles based on traffic engineering knowledge,” in ITST 2008, oct. 2008, pp. 439 –442.
[2] B. Duan, W. Liu, P. Fu, C. Yang, X. Wen, and H. Yuan, “Real-time on-road vehicle and motorcycle detection using a single camera,” in ICIT 2009, feb. 2009, pp. 1 –6.
[3] V. Milanés, D. F. Llorca, J. Villagrá, J. Pérez, C. Fernández, I. Parra, C. González, and M. A. Sotelo, “Intelligent automatic overtaking system using vision for vehicle detection,” Expert Systems with Applications, vol. 39, no. 3, pp. 3362 – 3373, 2012.
[4] S. Sheik Mohammed Ali, B. George, L. Vanajakshi, and J. Venkatraman, “A multiple inductive loop vehicle detection system for heterogeneous and lane-less traffic,” Instrumentation and Measurement, IEEE Transactions on, vol. 61, no. 5, pp. 1353 –1360, may 2012.
[5] S. Messelodi, C. Modena, and M. Zanin, “A computer vision system for the detection and classification of vehicles at urban road intersections,” Pattern Analysis & Applications, vol. 8, pp. 17–31, 2005.
[6] C.-C. Chiu, M.-Y. Ku, and H.-T. Chen, “Motorcycle detection and tracking system with occlusion segmentation,” in WIAMIS ’07. Washington, DC, USA: IEEE Computer Society, 2007, pp. 32–. [Online]. Available: http://dx.doi.org/10.1109/WIAMIS.2007.60
[7] J. Canny, “Finding edges and lines in images,” Cambridge, MA, USA, Tech. Rep., 1983.
[8] M. Zengqiang, P. Cunzhi, H. Ke, and C. Qiandong, “Research on segmentation of overlapped vehicles based on feature points on contour,” in FBIE 2009, dec. 2009, pp. 552 –555.
[9] K. Takahashi, Y. Kuriya, and T. Morie, “Bicycle detection using pedaling movement by spatiotemporal gabor filtering,” in TENCON 2010 - 2010 IEEE Region 10 Conference, nov. 2010, pp. 918 –922.
[10] S. Sonoda, J. K. Tan, H. Kim, S. Ishikawa, and T. Morie, “Moving objects detection at an intersection by sequential background extraction,” in ICCAS 2011, oct. 2011, pp. 1752 –1755.
[11] J. Chiverton, “Helmet presence classification with motorcycle detection and tracking,” IET, vol. 6, no. 3, pp. 259–269, 2012.
[12] Z. Zivkovic, “Improved adaptive gaussian mixture model for background subtraction,” in ICPR 2004, vol. 2, aug. 2004, pp. 28 – 31 Vol.2.
[13] M. H. Sigari, N. Mozayani, and H. R. Pourreza, “Fuzzy running average and fuzzy background subtraction: Concepts and application,” IJCSNS, 2008.
[14] S. Suzuki and K. Be, “Topological structural analysis of digitized binary images by border following,” Computer Vision, Graphics, and Image Processing, vol. 30, no. 1, pp. 32–46, Apr. 1985.
[15] J. yves Bouguet, “Pyramidal implementation of the lucas kanade feature tracker,” Intel Corporation, Microprocessor Research Labs, 2000.
[16] D. Kim and R. Dahyot, “Face components detection using surf descriptors and svms,” in Proceedings of the 2008 International Machine Vision and Image Processing Conference, ser. IMVIP ’08. Washington, DC, USA: IEEE Computer Society, 2008, pp. 51–56. [Online]. Available: http://dx.doi.org/10.1109/IMVIP.2008.15
[17] H. Bay, T. Tuytelaars, and L. V. Gool, “Surf: Speeded up robust features,” in In ECCV, 2006, pp. 404–417.
[18] J. Hansen and M. Sekine, “Decision diagram based techniques for the haar wavelet transform,” in Information, Communications and Signal Processing, 1997. ICICS., Proceedings of 1997 International Conference on, vol. 1, sep 1997, pp. 59 –63 vol.1.
[19] H. Rafiq and M. Siddiqi, “Haar transformation of linear boolean function,” in 2009 International Conference on Signal Processing Systems, may 2009, pp. 802 –805.
[20] N. Dalal and B. Triggs, “Histograms of oriented gradients for human detection,” in In CVPR, 2005, pp. 886–893.
[21] Z. Guo, L. Zhang, and D. Zhang, “A completed modeling of local binary pattern operator for texture classification,” Image Processing, IEEE Transactions on, vol. 19, no. 6, pp. 1657 –1663, june 2010.
[22] A. Suruliandi, K. Meena, and R. Reena Rose, “Local binary pattern and its derivatives for face recognition,” Computer Vision, IET, vol. 6, no. 5, pp. 480 –488, sept. 2012.
[23] G. Zhao, T. Ahonen, J. Matas, and M. Pietikainen, “Rotation-invariant image and video description with local binary pattern features,” Image Processing, IEEE Transactions on, vol. 21, no. 4, pp. 1465 –1477, april 2012.
[24] T. Ojala, M. Pietikainen, and D. Harwood, “A comparative study of texture measures with classification based on featured distributions,” Pattern Recognition, vol. 29, no. 1, pp. 51 – 59, 1996. [Online]. Available: http://www.sciencedirect.com/science/article/pii/0031320395000674
[25] S. Haykin, Neural Networks: A Comprehensive Foundation, 2nd ed. Prentice Hall, 2001.
[26] T. M. Cover, “Geometrical and statistical properties of systems of linear inequalities with applications in pattern recognition,” Electronic Computers, IEEE Transactions on, vol. EC-14, no. 3, pp. 326 –334, june 1965.
[27] C. Cortes and V. Vapnik, “Support-vector networks,” Machine Learning, vol. 20, pp. 273–297, 1995, 10.1007/BF00994018. [Online]. Available: http://dx.doi.org/10.1007/BF00994018
[28] C. Agurto, V. Murray, E. Barriga, S. Murillo, M. Pattichis, H. Davis, S. Russel, M. Abràmoff, and P. Soliz, “Multiscale am-fm methods for diabetic retinopathy lesion detection,” IEEE Transactions on Medical Imaging, vol. 29, pp. 502–512, 2010.
[29] M. Oren, C. Papageorgiou, P. Sinha, E. Osuna, and T. Poggio, “Pedestrian detection using wavelet templates,” in Computer Vision and Pattern Recognition, 1997. Proceedings., 1997 IEEE Computer Society Conference on, jun 1997, pp. 193 –199.

