


Servicios Personalizados
Revista

Articulo
 Inglés (pdf)
 Articulo en XML
 Referencias del artículo
Links relacionados
Compartir

 Permalink
CLEI Electronic Journal
versión On-line ISSN 0717-5000
CLEIej vol.16 no.3 Montevideo dic. 2013
Abstract
The possibilities that the management of a vast amount of computers and/or networks offer is attracting an increasing number of malware writers. In this document, the authors propose a methodology thought to detect malicious botnet traffic, based on the analysis of the packets that flow within the network. This objective is achieved by means of the extraction of the static characteristics of packets, which are lately analysed using supervised machine learning techniques focused on traffic labelling so as to proactively face the huge volume of information nowadays filters work with.
Spanish abstract:
Las posibilidades que ofrece la gestión de ingentes cantidades de equipos y/o redes está atrayendo a un cada vez mayor número de escritores de malware. En este documento, los autores proponemos una metodología de trabajo para la detección de tráfico malicioso procedente de las botnets, basándose en el análisis del flujo de paquetes que circulan por la red. Este objetivo se consigue con la parametrización de las características estáticas de esos paquetes para ser analizadas posteriormente con técnicas de aprendizaje supervisado enfocadas al etiquetado de tráfico, de modo que se permita hacer frente de una forma proactiva al gran volumen de información que manejan los filtros actuales
Keywords: Botnet, Detection, Machine Learning, Packets, Supervised
Spanish keywords: Aprendizaje automático, Botnet, Detección, Paquetes, Supervisado.
Received: 2013-03-01, Revised: 2013-11-05 Accepted: 2013-11-05
Botnets are one of the most recent threats in information technologies. The main difference that can be pinpointed amongst botnets and traditional malware is the capability of the formers to combine several ideas implemented separately by the latters to manage and control in the dark a network of computers. The massive Distributed Denial of Service (DDoS) attacks received by Estonia in 2007 [ 1] reflected a paradigm change in relation to the protection of critical facilities. Since then, the capabilities of botnets to paralyse services online, including government servers, payment platforms or financial entities [ 2], has been proved to be, not only simple, but effective. Thus, starting by the North Atlantic Treaty Organization (NATO) and going on by police agencies and military commanders of the security forces of countries with presence in the five continents, there exists an increasing number of estates which are developing policies to try to, solvently, give an answer to the threat of modern cyberweapons [ 3]. This is the framework where we can identify botnets as tools for commiting a broad band of delictive acts in the Internet.
The polyvalence that characterizes botnets and their softened learning curve even for people with medium computer skills, are evolving the concept Hacking as a Service or HaaS [ 4]. By doing so, malware writers have started to find a profitable business in designing and coding applications ad-hoc with user-friendly interfaces that could be easily managed by third party users. In this context, and once left apart the old IRC-based Command & Control channel (IRC: real time text-based communication protocol that permits conversations between 2 or more people at the same time) [ 5], nowadays botnets tend to implement easy-to-understand interfaces consisting in the use of web applications to which the infected nodes get connected to receive the updated list of commands they are asked to perform. In the case explained in this paper, the sample of malware code employed in the different experiments is a variation of the educative botnet Flu whose Command & Control (C&C) is, precisely, HTTP and HTTPS-based. Flu (The official webpage of the project is http://www.flu-project.com/) is an open-source project conceived with educational purposes with the goal of bringing to light the threat of botnets for the general public.
Once the techniques used in the past have been studied, we propose a new classification method using supervised algorithms to appropriately label the C&C channels in HTTP/HTTPS botnets by means of an in-depth analysis of the network traffic.
Summing up, the corresponding contributions derived from this work are:
- The usage of a modified version of a botnet to generate malicious traffic for this proof-of-concept.
- The acquisition of those characteristics relevant for network traffic classification, even those commonly found in botnet traffic or those ones instantiated by legitimate traffic.
- The classification of network traffic using supervised machine-learning techniques to develop a model capable of classifying botnet traffic and legitimate one.
The remainder of this paper is structured as follows. Section 2 details the related work already performed by other authors in traffic modelling. Section 3 concretes the scope of this research describing the process of data capturing. Section 4 defines the methods and techniques used for the definition of the packets captured. Section 5 collects the experiments performed and explains the obtained results. Section 6 advances some of the future lines of work in the botnet detection area using traffic analysis techniques. Finally, Section 7 sums up the conclusions extracted after this research was performed.
2 Related work linked to botnet traffic modelling
There exist different approaches to detect malicious traffic originated by botnets. Some of these efforts are focused on anomaly detection once a normalized sample of traffic has been defined [ 6, 7]. Anomaly detection techniques are based in the definition of a standard behaviour and performance of certain parameters such as the characteristics of the network connection, the CPU usage or any kind of modifications of the file system. The main advantage of this approach is that they are commonly useful for the detection of certain attacks, because it is common that infections, whatever their nature, generate alterations in the reported network activity [ 8]. However, anomaly detection techniques bring another problem: in the process of modelling what will be considered normal traffic for a network, there exists a risk of modelling as normal what in fact is traffic conducted with purely malicious intentions, distorting then the final representation of truly reliable activities and making future detecting efforts useless to identify these processes.
The rest of the detection techniques are usually grouped, depending on the element they track, in two different classes: focused on the network analysis (network-based) or focused on analysing the outgoing traffic from each node (host-based). In this line, Botsniffer [ 9] exploited the spatio-temporal differences of the botnet communications contrasting them with the legitimate traffic. What inspired that model was the fact of each bot in a hijacked network getting in contact with the server in intervals and frequencies sufficiently similar so as to mark such traffic as malicious in the IRC channels. Similarly, this is the approach that, using different parameters, we want to apply for HTTP-controlled botnets. Moreover, Dietrich et al. [ 10] created an application that made use of the network analysis tools to detect the C&C of a botnet. To achieve this, the authors collected different parameters of the network traffic as well as different protocols. Once these had been obtained, making use of a ponderated average of the hierarchically grouped labels and C&C flows, they could reckon the 88% of the Command & Control channels amongst the 20 most recent ones.
Other authors like Karasaridis et al. [ 11] have focused their efforts on performing an in-depth passive analysis of the traffic in the transport layer. The objective is to be able to detect behaioural patterns independently of the nature of the information exchanged, so as not to rely on the raw information managed by the application layer. Their approach obtained very effective results when trying to identify the old-fashioned IRC botnets. Authors should also have to take into account those strategies that seek to identify the communication channel to override the possibility that the nodes receive commands from the botmaster or network administrator, whenever it were not possible to mitigate the effects of the infection in the network nodes themselves. This is precisely what happened with Hlux/Kelihos: this botnet was conceived to gain benefit from the infected nodes by sending bulk mail and extracting and stealing Bitcoins from legitimate users [ 12]. Having been discovered in 2010, its Command and Control channel was finally deactivated by researchers working for Kaspersky Labs in March 2012. This is happening thanks to the proliferation of fast flux techniques that hide the source of the channel in botnets that implement a peer-to-peer architecture.
In our case, the idea is to prevent the detection of connections to a centralized node, something that might compromise the functioning of the entire network. To achieve this, it has been designed a network topology that transparently rotates the point at which the orders are published amongst the collection of compromised servers available, exploiting that no reference is made to the C&C through static addresses, but by using domain names.
Against this background, a traffic-independent approach has been selected to cope with the detection of botnets based on HTTP and/or HTTPS protocols, making use of supervised learning techniques for labelling these connections based on the atomic parameters that characterize each of them. The goal of the current study consists on the capture of information linked to the header size, the connection frequency, etc., with the ultimate objective of being able to label both, the traffic coming from a botnet and the legitimate one. Thus, we employ the characteristics of the packets sent during the C&C communication in a similar way to how they had been used in the past for the detection of intrusions and illegitimate traffic. To achieve this objective without having to cope with biased data, all the source and destination connections have been previously anonymized by eliminating all the information related to incoming or outgoing ports or IP addresses.
Once obtained all the traffic, the main objective on this research is to evaluate the ability of a system implementing supervised machine learning techniques to detect the packets coming from a C&C channel. Additionally, the reader has to take into account the difficulties that a study of this nature imply from the point of view of privacy and legality because of the necessity of reading and interpreting the data exchanged in real communications to assess the real abilities of such a method. If we also add the fact that many of these networks are establishing communications over HTTPS encryption, implementing content-hiding-based techniques making useless the efforts to apply content analysis detection systems [ 13], the approach presented in this paper takes on a greater interest by analysing the information flow in the network itself and not the raw content of the communication.
In the subsections that follow, we define the methodology used to model the C&C traffic as well as the concrete characteristics of the botnet used to show this proof of concept. In this research, the tool used is the University of Waikato’s Weka: Data Mining software, which can be defined as a collection of machine learning algorithms prepared for the automation of data mining tasks.
The proposed working philosophy in the article will describe a host-based IDS (Intrusion Detection System), in which the traffic listening point is located on the infected network nodes to capture its communication. Thus, for the testing environment we have defined two different types of machines:
- The control machine. The control machine will include a PHP server with MySQL also installed to store the database tables containing all the references and data about the infected machines. The C&C interface installation was performed on an external server to simulate the best as possible the real deployment of a botnet and to prevent parameters (such as the number of hops that packets take and the forwarding of those lost) from introducing biased data for the classification as would appear if the installation was carried out in a laboratory environment.
- The infected machines. The infected machines are running Windows XP systems using .NET Framework 3.5, which is a prerequisite for this experiment because the version of Flu used was compiled in C# under such framework. Additionally, the source code of this malware has been partially recoded to infect Windows machines in a controlled way and to include some new features not implemented in the original version, such as sending spam remotely, image capturing from the user webcam and a simple Distributed Denial of Service attack. To monitor its functionalities, the activity of the executable installed in the victims will be run exploiting the background capabilities implemented by its original developers, making the appropriate connections to the assigned IP address to locate the .xml file where, after running some parsing methods, the malware will find the current list of commands to be executed.
For the acquisition of information related to the generated traffic, we have opted for placing a sniffing program such as Wireshark (Wireshark, previously Ethereal is a protocol analyser tool conceived with educative goals usually employed to perform analysis and solve network-related issues). At this point, the reader should note that the infection is entirely controlled. If this were not the case, the localization of the sniffing tool might be reassigned, as some of the newest collections of malware are capable of recognising themselves as being executed together with a bunch of traffic auditing tools or virtualization software [ 14, 15, 16] silencing their activities to avoid detection. Taking this into account, the Wireshark captures allow us to perform a packet-to-packet analysis of all the traffic received or sent by each and every node. The infection of the victims has been manually performed, generating externally a file with its own Command & Control channel pointing directly to the web server from where the commands would be issued.
The traffic samples used correspond to different sessions run by the students of the Máster Universitario de Seguridad de la Información —in English, Master of Information Security— held by the University of Deusto (Máster Universitario de Seguridad de la Información de la Universidad de Deusto: http://www.masterseguridad.deusto.es). Thus, the authors could proceed to the monitoring of the connections during the following browsing hours. As an additional remark, and because of the legal implications that would imply the fact of storing such kind of traffic data, it was necessary the tacit agreement of these students to take part in the experiment that was being held. This restriction has some implications experimentally speaking: it may introduce a sort of skew in the data analysed regarding the final content of the communications as a user having being advised of being monitored for an experiment is substantially less inclined to visit, for instance, banking sites or webpages with pornographic content. However, the authors consider this naturally introduced error as acceptable since students were told to perform standard browsing sessions following the patterns stated by a recent study which tried to provide data on the average usage of the Internet [ 17]. The goal was to replicate with the maximum fidelity as possible the behaviour of a standard Internet user by performing tasks such as mail checking, social networks accesses, web applications usage, Internet surfing or access to breaking news webpages.
3.3 Protocol filtering and traffic anonymization
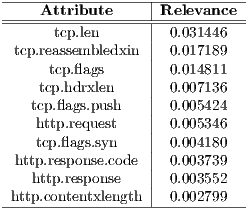
The goal of anonymizing the connection details is avoiding the identification of the connection by parameters related to IP addresses, MAC addresses or the ports to which the guest is being connected, as this approach is focused on classifying the connections using other attributes which would remain constant wherever the botnet server is placed. Additionally, because of the concrete characteristics of the connections coming from Flu, we have omitted any other reference to those protocols not directly related to this botnet’s traffic such as ARP, SIP or STP, so as to keep control of those which already uses the botnet to send or receive its orders and commands such as HTTP, HTTPS, TCP or UDP, from these attributes, the 10 most relevant ones are listed in Table 1. This classification has been performed using as a comparison ratio the Kullback-Leibler divergence [ 18], implemented in Weka under the InfoGain metric (Weka’s open implementation of the relative entropy - KLIC because of its English acronym - also known as normalized information gain).
At the same time, it was considered to define the duration and the interrelationship between the sessions as a key for linking. Since in each and every communication multiple requests are generated against a host and not a single request, we have decided to define an additional attribute which correlates packages:  time.
time.  time is defined as the interval of time that has elapsed between the reception of a packet and the reception of the preceding packet for that same connection. This attribute allows us to establish a relation about the frequency with which the connections to the different nodes are established.
4 Machine learning and supervised packet classification
The authors present in this paper an experimental model that makes use of the aforementioned modelling techniques described. The objective is to generate an appropriate quantity of traffic to be lately used by the classification algorithms implemented in Weka to test their traffic classifying capabilities.
In this regard, we have presented the problem as a supervised classification issue as Livadas et al. did in the past with IRC-controlled botnets [ 19]. In these problems, a phenomenon represented using a vector  in
in  that can be classified in
  different ways according to an
  vector of labels.
With such objective, the authors make use of a training set defined as 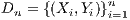 , where
  represents the corresponding events of the phenomenon
  while
while  is the label that places it in the category that the classifier estimates correct. For instance, in the case presented in this paper, we will be speaking about a
  packet defined by a series of attributes representing its state, being
  the assigned category of the packet (legitimate or from a botnet) depending on the calculations performed by each classifier.
In this research, we have chosen to compare the performance of different classification algorithms given the occasionally notable differences in effectiveness that can be observed in similar experiments conducted in other areas [ 20]. The algorithms used for the tests in Section 5 are the following:
- Sequential Minimal Optimization (SMO). SMO, invented by John Platt [ 21], is an iterative algorithm used for the solution of the optimization problems that appear when training Support Vector Machines (SVM). Basically, SMO divides the problem into a series of smaller subproblems which are analytically solved lately. At this point, we have selected different kernels with this algorithms: a polynomial kernel, a normalized polynomial kernel, RBF and Pearson-VII.
- Bayes Theorem-based algorithms. The Bayes Theorem, the base for the Bayesian inference, is a statistical method which determines, based on a number of observations, the probability of a certain hypotheses being true. For the classification needs here exposed, this is the most important capability of Bayesian networks: in our case, the probability of a packet being part of the Command & Control channel of a HTTP botnet. The theorem is capable of adjusting the probabilities as soon as new observations are performed. Thus, Bayesian networks conform a probabilistic model that represents a collection of randomized variables and their conditional dependencies by means of a directed graph. We have trained our models with three different search algorithms: K2, Hill Climbing and TAN.
In this group we have also considered the inclusion of Naïve Bayes. The idea is that if the number of independent variables managed is too big, it does not make any sense to make probability tables [ 22]. Then, the reduced model with simplified datasets give to the algorithm the appellative of Naïve.
- J48. J48 is an open source implementation for Weka of the C4.5 algorithm [ 23]. C4.5 creates decision trees given an amount of training information making use of the concept information entropy [ 24]. The training data consist of a group
 of already classified samples
  in which
  represent the attributes or characteristics of each sample. In each node of the decision tree, the algorithm will choose the attribute in the data that most efficiently divides de dataset in enriched choruses of a given class using as selection criterion the entropy difference or the already mentioned normalized information gain.
 - Random Forest. Random Forest is an aggregation classifier developed by Leo Breiman [ 25] and which is formed by a bunch of decision trees considered in a way in which the introduction of a stochastic component improves de precision of the classifier , either in the construction of the trees or either in the training dataset.
- Voted Perceptron. Perceptron can be considered as a supervised classification algorithm in the family of linear classifiers. However, its main limitation is their inability to separate datasets which are not lineally separable [ 26]. So as to face this inability of the general algorithm to be trained to recognise many classes of patterns, Yoaund Freund and Robert E. Schapire were capable of recovering the interest on them after proposing a voted formulation of the original algorithm [ 27] which have been successfully used to solve some binary classification problems [ 28] and to face issues related to distributed training strategies [ 29].
- Multilayer Perceptron (MLP). The MLP model is a feedforward model of artificial neural networks that maps input datasets into a series of corresponding output datasets. The main advantage of the MLP model is that it can distinguish data which are not lineally separable. An MLP is formed by a set of artificial neural networks placed into layers of nodes into a directive graph. Each and every layer is fully connected to the following. This model uses a supervised learning technique known as backpropagation for training the classifier. This technique is based on minimizing the error by means of the gradient descent, so that the essential part of the algorithm is the calculation of the partial derivatives of the error with respect to the parameters of the neural network.
- K-Nearest Neighbor (KNN). The KNN algorithm is one of the most simple classification algorithms amongst all of those available for the machine learning techniques. It takes decisions based on the results of the
 closest neighbours to the analysed sample in the experimental n-dimensional space (
 ). In previous research [ 30], we have proved that taking into account up to
  neighbours does not improve at all the efficiency of the classifications performed. In this case, and taken into account the simplicity of the algorithm, we have explored even more values (
 ) so as to determine if this enlargement would throw any kind of additional advantage.
In this way, knowing the concrete characteristics of the connections associated to the malicious traffic experimentally generated by the authors, we have proceeded to label each and every packet as bot or legitimate so as to generate the final datasets employed for the experiments detailed in section 5. These experiments will be performed using cross validation techniques [ 31], using some part of the dataset to train the models and the rest to evaluate the results.
4.2 Resampling and training data balancing
As we have previously suggested, the number of relevant packets on a traffic sample can vary notably. In the case of the performed experiment, the proportion of the number of packets corresponding to benign traffic in comparison with the malicious traffic generated in each and every host ranged from 4:1 to 80:1. However, the usage of so unbalanced training data may also introduce important skews in the classification process. Because of that, the final training datasets have been appropriately resampled so as to use the same number of instances to train each of the classes. In the case of the experiment, we have selected the Spread Subsample algorithm implemented by Weka which, from the class with more training samples, extracts the same number of instances available in the training dataset for the other class. Finally, after having extracted all the atomic characteristics of individual packets, the number of characteristics was not big enough to consider adding a new preprocessing step to reduce the number of attributes employed for the classification as it was required in similar research on malware detection [ 32].
Having defined the modelling guidelines in the previous sections, we have proceeded to the gathering of network traffic with the aforementioned Wireshark tool. The samples obtained corresponded to traffic sessions extracted from equipment used by students of the Master of Information Security at the University of Deusto, voluntarily, have offered to monitor their outgoing traffic stop on computers infected with the modified version of Flu dedicated to this experiment.
The aim was that legitimate users carry out one-hour sessions of normal browsing during a class: access to search engines, encyclopedias queries online, browsing social networks like Facebook, Twitter, LinkedIn or Myspace, queries to digital newspapers, web access to email servers, etc. Meanwhile, from a different computer, an administrator would update the file of the commands and orders to be executed by the nodes of the infected machines. Some of the actions included creating admin user accounts, obtaining screenshots, sending files, obtaining the keylogging recordings or the remote execution of programs installed on the computer, amongst others.
With all these data, the size of each of the samples generated ranged between 0.9 GB and 1.5 GB in the .cap capturing format. Subsequently, to facilitate the process of parsing the packets, those sessions have been exported to a .xml-like format (.pdml standing for Packet Detailed Markup Language), which facilitated, not only the information seeking tasks, but also those related with identifying the parameters which can introduce a skew knowledge in the training datasets, such as the information related to ports, protocols or IP addresses.
Thus, this section details the results obtained when evaluating the various elements analysed as predictors of malicious traffic. For each of them, there will be an experiment to demonstrate its validity as predictors using the different classifiers detailed in section 4. This evaluation will be performed according to the following parameters, usually employed to compare the performance of different algorithms in the field of machine learning:
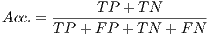
- Accuracy (
 ), which is worked out by dividing the total number of successfully classified samples (
 ) by the total number of packets in the whole testing dataset (
 ).
). 
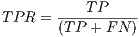
(1) - True Positive Ratio (
 ), which is worked out dividing the number of illegitimate packets correctly classified (
 ) by the total number of botnet packets in the testing population (
 ).
). 
(2) - Possitive Predictive Value (
 ). The
  —also known in English as precision— is a value that presents the chances of a given positive result having correctly reflected the tested condition: id est, the probability of an instance labelled as a positive effectively being a
  . Mathematically, it is defined in equation 3 as follows:
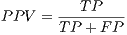
(3) At this point the False Positive Ratio (
 ) corresponds to the ratio of Type I errors. These errors, also known as Alpha (
 ) type errors, are those committed by a researcher when his/her model does not accept the null hypothesis
  when this is true for the studied population. Thus, in our case, where
  corresponds to a packet being a legitimate packet, the false positive ratio or
  can be defined as the number of legitimate packets incorrectly classified as coming from a botnet.
  is worked out dividing the number of samples of legitimate traffic which has been misclassified as coming from a botnet (
 ) by the total number of legitimate packets in the testing population (
 ):
): 
(4) - F-measure (
 ). The F-measure or
  —equation 5— is a typical measure used in Information Retrieval (IR) to evaluate the result of a search that determines to what extent the obtained groups are similar to what would be obtained using a manual categorization. This measure can be defined as:
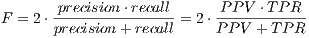
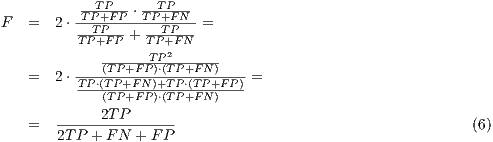
(5) In this way, if we substitute in
 the definition of the
  and
and  we will be able to simplify the formula as follows:
 - Area Under ROC Curve (
 ) [ 20], that establishes the relationship amongst the false negatives and the false positives. The ROC Curve it is usually used to generate statistics that represent the performance or the effectiveness in a wider sense of a classifier. In spite of not providing by itself information about the good behaviour of a model, the
  helps to determine the validity of the data distribution all along a series of predictive conditions [ 33].
 ), Precision (
 ), F-measure and
  .
.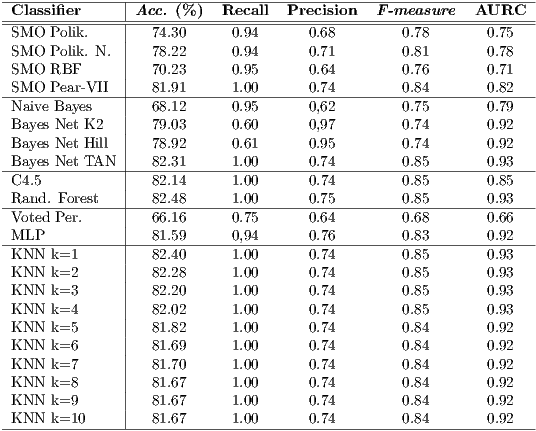
As the reader may note, the best classifier in terms of Accuracy is Random Forest being able to label correctly up to 82.53% of the samples. However, we have to pinpoint that the results are, in terms of accuracy, pretty homogeneous as C4.5 or all the versions of the KNN algorithm obtained very similar values over the 80% of the correctly classified instances. With respect to latter, we have some evidence to confirm that the fact of including more neighbours for the KNN algorithm at the time of taking decisions does not provide any noticeable improvement. In fact, we can perceive a light but continuous trend to obtaining slightly worse results in almost every testing variable.
Regarding the  , the detection ratios are, in general, high, with some exceptions such as the case of Bayes Net using K2 as search algorithm, with an apparently poor 0.6. At this point, we have to put the aforementioned information into quarantine till comparing this result with the
  which links the true positive rate or
  with the false positive rate or
  . In this case, values closer to 1 establish a greater reliability of the positive classifications, while values closer to 0.5 — as happens with Naïve Bayes— would imply lower confidence on the positively classified instances. In this case, we have to highlight the efficiency of one of the algorithms with lower
  ratios: the bayesian networks which use K2 and Hill Climbing search algorithms.
With respect to the f-measure values it is again the Bayes Net using K2 the one with the highest ratio which contrasts with the exceptionally low value achieved by Naïve Bayes (0.57). Finally, the  , which determines the degree of adjustment of the represented samples giving a value to the goodness of the proposed selection, the highest values are around 0.90 reaching the 0.93 of Random Forest and KNN.
To analyse these results we have to take into account that the number of generated packets in any communication is usually extremely high. Knowing this and the low malicious payload that a unique packet can bring into the network, we may think of improving the classification taking into account the history of the packets connected to a single point. In other words, the objective would be to use these classifications as a measure to create a more general indicator of the reliability levels of a given connection depending on how the model has been able to classify the intercepted packets of such connection.
As a first approach to this solution, we have obtained the probability  of most (
 ) of the
  (
( ) latest packets analysed from a connection have been correctly classified by a classifier
  , being
  the probability of correctly labelling an isolated packet using such classifier
  . That is to say, if
  corresponds to a correct labelling and
  to an erroneous labelling, for sequences of a length of
  packets, the possible combinations of correct/incorrect classifications are the ones that follow:
  ,
,  ,
,  y
y  .
.
As for these estimations we are only interested in those cases in which the classifiers have performed correct classifications in at least the  of the samples, the combinations of packets which we will remain will only be:
  ,
,  .
.
Then, the resultant probability  is the sum of: 1) the probability of each and every of the
  packets having been correctly classified, 2) the probability of only one of the packets having been incorrectly classified, 3) the probability of only two of the packets having been incorrectly classified, etc., and so on until we find all the possible combinations of at least
  (
( ) packets correctly classified.
In Combinatorics, this is defined as equation 7 shows:
The equations 8 and 9 are an example of the application of this formula for sequences of![( ) P(n) = n ⋅P (C)n + ( 0) + n ⋅P (C)n-1 ⋅[1- P (C )]+ 1 (n ) n-2 2 + 2 ⋅P (C) ⋅[1- P (C )]+ + ⋅⋅⋅+ ( n ) n n + n ⋅P(C )n- (2- 1) ⋅[1- P (C)]2 = n 2 - 1 2∑- 1{(n ) n-k k} = k ⋅P (C) ⋅[1- P (C )] (7) k=0](/img/revistas/cleiej/v16n3/3a0281x.png)
 and
and  packets.
 ![∑1 { (3) } P(3) = k ⋅P(C)3-k ⋅[1- P (C)]k = k=0 = P(C )3 + + 3⋅P (C)2 ⋅[1- P(C )] (8)](/img/revistas/cleiej/v16n3/3a0284x.png)
![{ ( ) } ∑2 5 5-k k P(5) = k ⋅P(C) ⋅[1- P (C)] = k=0 5 = P(C ) + + 5⋅P (C)4 ⋅[1- P(C )]+ + 10⋅P (C)3 ⋅(1- P(C )2) (9)](/img/revistas/cleiej/v16n3/3a0285x.png)
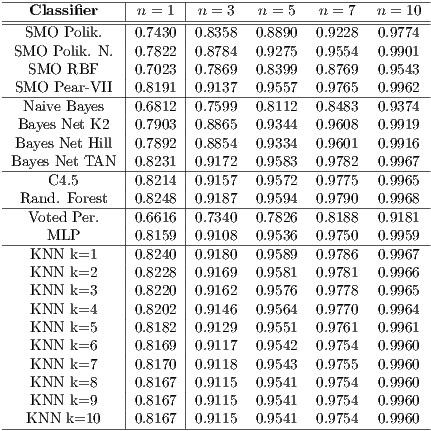
As a result, we have obtained the table 3, which are the estimations we have performed of having correctly labelled more than the half of the packets corresponding to a connection represented by different sequences of them. In other words, these calculations try to estimate the chances of having classified correctly at least the  of the packets identified by each classifier as coming from the employed version of Flu in each sequence of packets of length
  . As a self-explanatory example, given seven packets corresponding to certain connection, the classifier with more accuracy in the performed tests, Random Forest, would get 97.90% of chances (
 out of a maximum of
  ) of having correctly classified at least four of the seven intercepted packets. Since the accuracy of the classifiers is relatively high when they label traffic as legitimate or malicious, the greater the number of analysed packets per connection, the more legitimacy will reach the classification performed and the stronger the indicator will be.
These calculations confirm the hypothesis of the detection of malicious traffic does not have to be only focused on the categorization of isolated packets, but in the estimated reliability of the connection as a whole. The reader should keep in mind that it is much more representative of a given behaviour to perform a time-dependent monitoring of the network than just taking into consideration the representations of this traffic at certain given moments. This being so, it is true that the benefits of this method could be affected by the development of botnets capable of generating noise in the form of automated traffic, created to camouflage the control messages themselves.
The most direct future work lines will be centralized in trying to minimize the false positive ratio to the maximum, with the target of labelling as corrupted only those samples that have been identified as malicious with more confidence. Adjusting the threshold would have two main direct implications: 1), the detection rates per isolated packet would dramatically decrease and, 2), the suspicious packet would be malicious with much more reliability. What is more, if we take into account that the semantic nature of the generated connections in each and every communication network makes sense in a context of information exchange, we can guess that a numerous number of subsequent approaches may be centered in an evolutionary analysis of nowadays traffic labelling techniques. That is to say, instead of thinking in isolated packages with no link to the previous or the next one in the chain, modelling the traffic taking into account the connections to which they belong, defining them as temporal sequences of sent or received packets from/where each corresponding host.
At the same time, the contributions provided here also suggest a wide bunch of future work lines in fields related to traffic modelling. The reader should take into account that the proposal detailed in this paper is only focused on the detection of traffic corresponding to the Command & Control channels from a botnet; that is to say, that part of the management traffic flowing amongst the infected nodes of the network and that one who controls it. In this line, a field that has been relegated untreated is the study of the outgoing traffic for the detection of malicious behaviours beyond the infection of the system. This area carries a growing interest for institutions, given the possibilities that would offer to face the following issues: the detection of Distributed Denial of Service (DDoS) attacks, the analysis of decentralized botnets, the analysis of the automated traffic generated by a single node in the network, the study of the outgoing traffic towards third-party services that host pay-per-click campaigns to pursue click-frauding o the massive shipping of spam or bulk mail as it was done in another time using IRC channels [ 34].
Anyway, the already commented results obtain very high detection ratios for traffic coming from a botnet using such a concrete HTTP-based Command & Control channel. The next step is to check the efficiency of the system for the detection of traffic coming from other networks, so as to be able to design a more complex system capable of identifying generically, the way in which the control traffic is created. Such an effort should be conceived including in the experiments as many families of malicious samples as possible.
One of the main problems that brings with it the supervised machine learning in the field of traffic classification, is the vast amount of data managed daily by filters and the legal difficulties associated to the extraction of the samples. In this line, the legal need of having the tacit consent of the users that generate the network traffic samples, forces us to assume certain errors linked to biased browsing habits. In real life scenarios the connection to certain webpages which does not have to be necessarily harmful and which should be considered as common traffic –such as adult content webpages for example– will have very low appearance in testing environments if any because of the fact of the user knowing that is being tracked.
In this context, the objective of defining a traffic modelling methodology to identify Command & Control packets from a botnet has been fulfilled in the following terms: firstly, a series of classification parameters has been highlighted as relevant so as to identify traffic from a concrete network; secondly, a mathematical model has been generated on which different classification algorithms have been applied obtaining successful results; and, thirdly, we have performed an estimation of the capacity of these techniques to define the reliability of the connection to which they belong. Nevertheless, the main virtue of the approach exposed here is to try to classify the traffic independently of the content of the information that flows through the network, employing metrics for the detection using values associated to the length of the headers, the connection frequency or the periodicity of the polls amongst the infected machines and the control server.
The authors of this article want to thank the efforts and collaboration of the students of the Máster Universitario de Seguridad de la Información (official name in English, Master’s in Information Security) of the University of Deusto for the extraction of the experimental traffic samples needed for the achievement of this research.
[1] S. Blank, “Web war i: Is europe’s first information war a new kind of war?” Comparative Strategy (2008), vol. 27, no. 3, p. 227, 2008. [Online]. Available: http://www.informaworld.com/10.1080/01495930802185312
[2] P. Hunter, “Paypal, fbi and others wage war on botnet armies. can they succeed?” Computer Fraud Security (2008), no. 5, pp. 13–15, 2008. [Online]. Available: http://linkinghub.elsevier.com/retrieve/pii/S1361372308700824
[3] M. C. Libicki, Cyberdeterrence and Cyberwar. Santa Monica, CA: RAND, 2009. [Online]. Available: http://www.rand.org/pubs/monographs/MG877/
[4] G. Ollmann, “Hacking as aservice,” Computer Fraud & Security (2008), vol. 2008, no. 12, pp. 12–15, 2008.
[5] K.-S. Han and E. G. Im, “A survey on p2p botnet detection,” in Proceedings of the International Conference on IT Convergence and Security 2011, ser. Lecture Notes in Electrical Engineering, K. J. Kim and S. J. Ahn, Eds. Springer Netherlands, 2012, vol. 120, pp. 589–593, 10.1007/978-94-007-2911-7_56. [Online]. Available: http://dx.doi.org/10.1007/978-94-007-2911-7\_56
[6] J. R. Binkley and S. Singh, “An Algorithm for Anomaly-based Botnet Detection ,” in SRUTI ’06: 2nd Workshop on Steps to Reducing Unwanted Traffic on the Internet, Portland State University Portland, OR, USA. USENIX Association, 2006.
[7] N. Davis, “Botnet detection using correlated anomalies,” Master’s thesis, Technical University of Denmark, DTU Informatics, E-mail: reception@imm.dtu.dk, Asmussens Alle, Building 305, DK-2800 Kgs. Lyngby, Denmark, 2012, supervised by Professor Robin Sharp, ris@imm.dtu.dk, DTU Informatics. [Online]. Available: http://www.imm.dtu.dk/English.aspx
[8] G. Fedynyshyn, M. C. Chuah, and G. Tan, “Detection and Classification of Different Botnet C&C Channels,” in ATC’11 Proceedings of the 8th international conference on Autonomic and trusted computing, Lehigh University. Bethlehem, PA 18015, USA. Springer-Verlag, 2011, pp. 2228–242.
[9] G. Gu, J. Zhang, and W. Lee, “BotSniffer: Detecting Botnet Command and Control Channels in Network Traffic,” in Network and Distributed System Security (2007), 2007.
[10] C. J. Dietrich, C. Rossow, and N. Pohlmann, “CoCoSpot: Clustering and recognizing botnet command and control channels using traffic analysis,” Computer Networks, Jul. 2012. [Online]. Available: http://dx.doi.org/10.1016/j.comnet.2012.06.019
[11] A. Karasaridis, B. Rexroad, and D. Hoeflin, “Wide-scale botnet detection and characterization,” in Proceedings of the USENIX Workshop on Hot Topics in Understanding Botnets (HotBots), 2007.
[12] S. Ortloff, “Botnet shutdown success story - again: Disabling the new hlux/kelihos botnet,” Computer Fraud Security.
[13] K. Rieck, T. Holz, C. Willems, P. Duessel, and P. Laskov, “Learning and Classification of Malware Behavior,” in n Conference on Detection of Intrusions and Malware & Vulnerability Assessment (DIMVA). Springer-Verlag, 2008, pp. 232–249.
[14] A. Dinaburg, P. Royal, M. Sharif, and W. Lee, “Ether: malware analysis via hardware virtualization extensions,” in Proceedings of the 15th ACM conference on Computer and communications security. ACM, 2008, pp. 51–62.
[15] T. Raffetseder, C. Kruegel, and E. Kirda, “Detecting system emulators,” Information Security, pp. 1–18, 2007.
[16] J. Rutkowska, “Security challenges in virtualized environments,” in Proc. RSA conference 2008, 2008.
[17] F. Lera-López, M. Billon, and M. Gil, “Determinants of internet use in spain,” Economics of Innovation and New Technology, vol. 20, no. 2, pp. 127–152, 2011. [Online]. Available: http://www.tandfonline.com/doi/abs/10.1080/10438590903378017
[18] S. Kullback and R. A. Leibler, “On Information and Sufficiency,” in Ann. Math. Statist., vol. 22. USENIX Association, 1951, pp. 79–86.
[19] C. Livadas, R. Walsh, D. Lapsley, and W. T. Strayer, “Using machine learning techniques to identify botnet traffic,” in In 2nd IEEE LCN Workshop on Network Security (WoNS’2006, 2006, pp. 967–974.
[20] Y. Singh, A. Kaur, and R. Malhotra, “Comparative analysis of regression and machine learning methods for predicting fault proneness models,” International Journal of Computer Applications in Technology (2009), vol. 35, no. 2, pp. 183–193, 2009.
[21] J. C. Platt, “Sequential minimal optimization: A fast algorithm for training support vector machines,” 1998.
[22] L. Jiang, D. Wang, Z. Cai, and X. Yan, “Survey of improving naive bayes for classification,” in Advanced Data Mining and Applications, ser. Lecture Notes in Computer Science, R. Alhajj, H. Gao, X. Li, J. Li, and O. Zaïane, Eds. Springer Berlin / Heidelberg, 2007, vol. 4632, pp. 134–145, 10.1007/978-3-540-73871-8_14. [Online]. Available: http://dx.doi.org/10.1007/978-3-540-73871-8\_14
[23] J. Quinlan, C4. 5: programs for machine learning. Morgan kaufmann, 1993.
[24] S. L. Salzberg, “C4.5: Programs for machine learning by j. ross quinlan. morgan kaufmann publishers, inc., 1993,” Machine Learning, vol. 16, pp. 235–240, 1994, 10.1007/BF00993309. [Online]. Available: http://dx.doi.org/10.1007/BF00993309
[25] L. Breiman, “Random forests,” Machine Learning, vol. 45, pp. 5–32, 2001, 10.1023/A:1010933404324. [Online]. Available: http://dx.doi.org/10.1023/A:1010933404324
[26] X. Basogain Olabe, Redes neuronales artificiales y sus aplicaciones. Escuela Superior de Ingeniería de Bilbao, EHU . [Online]. Available: http://ocw.ehu.es/ensenanzas-tecnicas/redes-neuronales-artificiales-y-sus-aplicaciones/contenidos/pdf/libro-del-curso
[27] Y. Freund and R. E. Schapire, “Large margin classification using the perceptron algorithm,” Machine learning, vol. 37, no. 3, pp. 277–296, 1999.
[28] M. Collins, “Discriminative training methods for hidden markov models: Theory and experiments with perceptron algorithms,” in Proceedings of the ACL-02 conference on Empirical methods in natural language processing-Volume 10. Association for Computational Linguistics, 2002, pp. 1–8.
[29] R. McDonald, K. Hall, and G. Mann, “Distributed training strategies for the structured perceptron,” in Human Language Technologies: The 2010 Annual Conference of the North American Chapter of the Association for Computational Linguistics. Association for Computational Linguistics, 2010, pp. 456–464.
[30] F. Brezo, J. Gaviria de la Puerta, X. Ugarte-Pedrero, I. Santos, P. G. Bringas, and D. Barroso, “Supervised classification of packets coming from a http botnet,” in XXXVIII Conferencia Latinoamericana En Informatica (CLEI), 2012. IEEE, 2012, pp. 1–8.
[31] R. Kohavi et al., “A study of cross-validation and bootstrap for accuracy estimation and model selection,” in International joint Conference on artificial intelligence, vol. 14. Lawrence Erlbaum Associates Ltd, 1995, pp. 1137–1145.
[32] I. Santos, B. Sanz, C. Laorden, F. Brezo, and P. Bringas, “Opcode-sequence-based semi-supervised unknown malware detection,” Computational Intelligence in Security for Information Systems, pp. 50–57, 2011.
[33] J. Lobo, A. Jiménez-Valverde, and R. Real, “Auc: a misleading measure of the performance of predictive distribution models,” Global Ecology and Biogeography, vol. 17, no. 2, pp. 145–151, 2007.
[34] G. Guofei, R. Perdisci, J. Zhang, and W. Lee, “BotMiner: clustering analysis of network traffic for protocol- and structure-independent botnet detection,” in SS’08 Proceedings of the 17th conference on Security symposium. USENIX Association, 2008, pp. 139–154.

