


Services on Demand
Journal

Article
 Spanish (pdf)
 Article in xml format
 Article references
Related links
Share

 Permalink
CLEI Electronic Journal
On-line version ISSN 0717-5000
CLEIej vol.16 no.1 Montevideo Apr. 2013


Abstract
Spanish abstract:
Históricamente, los ingenieros de software han concebido a los catálogos de métricas como una herramienta importante para estimar la calidad de sus artefactos de software. Recientemente, ha emergido un paradigma de computación denominado Computación Orientada a Servicios (COS), pensado para diseñar software heterogéneo y masivamente distribuido. El presente paper introduce un análisis de correlación estadística que muestra que ciertas métricas clásicas de la ingeniería de software son útiles para predecir los atributos de calidad más relevantes de los documentos WSDL, vale decir, el artefacto de software por excelencia al materializar COS utilizando tecnologías Web. En los experimentos, se utilizaron dos catálogos recientes de métricas para documentos WSDL y un conjunto de 154 documentos WSDL provinientes de sistemas reales.
Keywords: Service-oriented Computing, Web Services, Code-first, Web Service Quality, Object-oriented Metrics, Early Detection
Spanish Keywords: Computación Orientada a Servicios, Servicios Web, code-first, Calidad en Servicios Web, Métricas Orientadas a Objetos, Detección temprana
Received 2012-07-09, Revised 2012-12-13, Accepted 2012-12-13
The Service-Oriented Computing (SOC) paradigm has been steadily gaining territory in the software industry. With SOC, the composition of loosely coupled pieces of software, called services, drives software construction. A key to SOC is that services may be provided by third-parties who only expose services interfaces to the outer world.
This basic idea has been present in the software industry for a long time. However, the advances in distributed system technologies nowadays encourage engineers to implement the SOC paradigm in environments with higher levels of distribution and heterogeneity. For instance, broadband and ubiquitous connections enable to reach the Internet from everywhere and at every time, enabling a global scale marketplace of software services. In such a marketplace, providers may offer their services interfaces and consumers may invoke them regardless of geographical aspects, using the current Web infrastructure as the communication channel. When services are implemented using standard Web languages and protocols –which is the most common scenario– they are called Web Services. Nowadays, Web Services are the leading character in diverse contexts. For example, they are the chosen technology usually employed when migrating legacy systems (1) or the technological protocol stack used when accessing remote information from smartphones (2).
Like programs or in general any other software artifact, service interface descriptions have a size, complexity and quality, all of which can be measured (3). Previous research has emphasized on the importance of services interfaces and more specifically their non-functional concerns. Particularly, the work of (4) identifies common bad practices found in services interfaces, which impact on the understandability and discoverability of described services. In this context, understandability is the ability of a service interface description of being self-explanatory, i.e., a software engineer can effectively reason about a service purpose just by looking at its associated interface description. Discoverability, on the other hand, refers to the ability of a service of being easily retrieved, from a registry or repository, based on a partial description of its functionality, i.e., a query. At the same time, in (3) the author describes a suite of metrics to assess the complexity and quality of services interfaces.
In an attempt to study the relationships between understandability and discoverability problems associated with services interfaces, such as (4), and service implementation metrics, such as (5, 6), in (7) a statistical correlation analysis has been reported. The rationale behind the study is that in practice services interfaces are not build by hand, but instead they are automatically generated by mapping programming languages constructors onto service interface descriptions expressed in Web Service Definition Language (WSDL). WSDL is an XML-based format for describing a service as a set of operations, whose invocation is based on message exchange. For services implemented in Java, this mapping is usually achieved by tools such as Axis’ Java2WSDL, Java2WS, EasyWSDL, and WSProvide.
As a complement, in this paper we study the feasibility of obtaining less complex, of the highest possible quality, and more maintainable services by exploiting Object-Oriented metrics (OO) values from the code implementing services. Similar to (7), the approach behind this work relies on employing these metrics as early indicators to warn software engineers about the possibility of obtaining services interfaces with high complexity, low quality or low maintainability at development time. For the purposes of this paper, the terms complexity, quality and maintainability are used as follows. Complexity refers to lingual, data, and structural aspects of WSDL documents. Furthermore, the term quality refers to Modularity, Adaptability, Reusability, Testability, Portability, and Conformity attributes. Each quality attribute will be explained later in this paper. Finally, maintainability estimates the effort required to understand the messages that are responsible for representing services operations inputs/outputs.
Interestingly, we have found that there is a statistical significant, somewhat high correlation between several traditional (source code-level) OO metrics and the catalog of (WSDL-level) service metrics described in (3) and (8). To date, these are the most comprehensive catalog of metrics for measuring complexity/quality and maintainability, respectively, of WSDL interfaces. All in all, we argue that based on these indicators, software engineers could consider applying simple early code refactorings to avoid obtaining services interfaces with the mentioned problems.
It is worth noting that although our approach to correlation does not depend on the programming language in which services are implemented, we limit the scope of our research to Java, which is very popular in back-end and hence service development. To evaluate our approach, we performed experiments by employing a data-set of real services, and one of the most popular Java-to-WSDL generation tool, namely Java2WSDL(http://ws.apache.org/axis/java).
The rest of the paper is structured as follows. Section 2 gives some background necessary to understand the goals and results of the study presented in this paper. Section 3 surveys relevant related works. Section 4 presents detailed analytical experiments that evidence the correlation of OO metrics with the Web Service metrics both proposed in (3) and (8). Finally, Section 5 concludes the paper.
WSDL allows providers to describe a service from two main angles, namely what it does (its functionality) and how to invoke it. Following the version 1.1 of the WSDL specification, the former part reveals the service interface that is offered to potential consumers. The latter part specifies technological aspects, such as transport protocols and network addresses. Consumers use the functional descriptions to match third-party services against their needs, and the technological details to invoke the selected service. With WSDL, service functionality is described as a port-type  , which arranges different operations
  that exchange input and return messages
  and
and  , respectively. Port-types, operations and messages must be labeled with unique names. Optionally, these WSDL elements might contain some documentation in the form of comments.
Messages consist of parts that transport data between providers and consumers of services, and vice-versa. Exchanged data is represented by using XML but according to specific data-type definitions in XML Schema Definition (XSD), a language to define the structure of an XML document. XSD offers constructors for defining simple types (e.g., integer and string), restrictions, and both encapsulation and extension mechanisms to define complex constructs. XSD code might be included in a WSDL document using the types element, but alternatively it might be put into a separate file and imported from the WSDL document or external WSDL documents in order to achieve type reuse.
A requirement inherent to manually creating and manipulating WSDL and XSD definitions is that services are built in a contract-first manner, a methodology that encourages designers to first specify the WSDL-based interface of a service and then supply an implementation for it. However, the most used approach to build Web Services by the industry is code-first, which means that one first implements a service and then generates the corresponding service interface by automatically deriving the WSDL document from the implemented code. This means that WSDL documents are not directly created by humans but are instead automatically derived via language-dependent tools. Such a tool performs a mapping T (7), formally:
 | (1) |
Mapping T from  to
to  , being
  the front-end class implementing a service and
  the WSDL document describing the service, generates a WSDL document containing a port-type for the service implementation class, having as many operations
  as public methods
  are defined in the class. Moreover, each operation of
  is associated with one input message
  and another return message
  , while each message conveys an XSD type that stands for the parameters of the corresponding class method. Tools like WSDL.exe, Java2WSDL, and gSOAP (9) are based on a mapping
  for generating WSDL documents from C#, Java and C++, respectively, though each tool implements
  in a particular manner mostly because of the different characteristics of the involved programming languages.
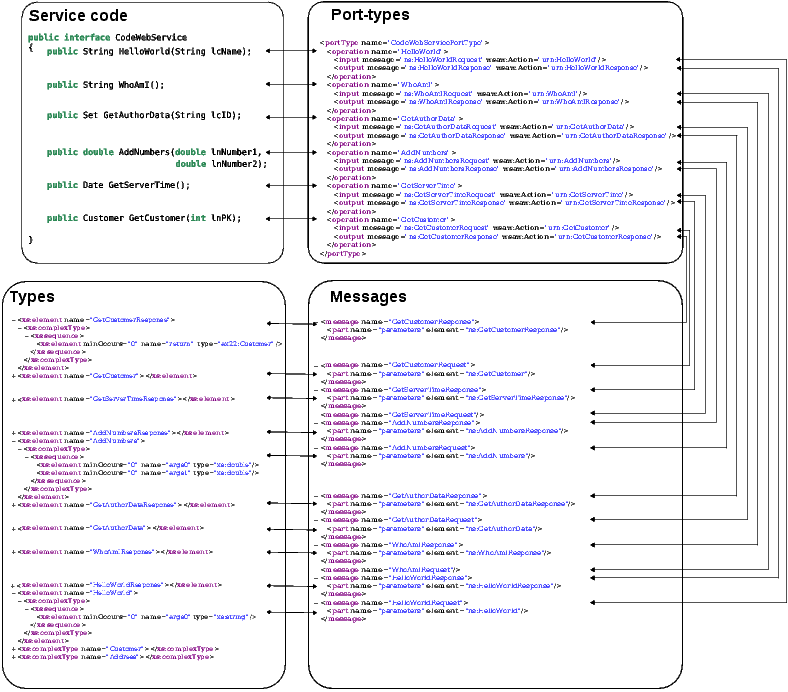
Figure 1 shows the generation of a WSDL document using Java2WSDL. It can be noted that the mapping  maps each public method from the service code to an operation containing two messages in the WSDL document and these, in turn, are associated with an XSD type containing the parameters of that operation. As shown in (7), depending on the tool used, however, some minor differences between the generated WSDL documents may arise. For instance, for the same service Java2WSDL generates only one port-type with all the operations of the Web Service, whereas WSDL.exe generates three port-types (one for each transport protocol). As we mentioned before, these differences are a result of the implementation each tool uses when applying the mapping to the service code.
There are metrics for assessing WSDL documents size, cohesion, understandability, discoverability, complexity and quality, just to name a few characteristics. Precisely, the fact underpinning our study is that WSDL metrics in the general sense are strongly associated with API design attributes (7, 4). These latter have been throughly studied by the software engineering community and as a result suites of OO class-level metrics exist, such as the Chindamber and Kemerer’s metric catalog (5). Consequently, these metrics tell providers about how a service implementation conforms to specific design attributes. For example, the LCOM (Lack of Cohesion Methods) metric provides a mean to measure how well the methods of a class are semantically related to each other, or the cohesion design attribute.
An interesting approach is then to assess whether a desired design attribute as measured by OO metrics is maintained after WSDL generation as measured by one or more WSDL-level metrics (e.g., (3, 8)) suitable for the attribute. As a corollary, by using well-known software engineering metrics on a service code  , a provider might have an estimation of how the resulting WSDL document
  will be like in terms of understandability, discoverability, complexity and so on, since a known mapping
  relates
  with
with  . If indeed such code metric/anti-pattern relationships exist, then it would be possible to determine a wider range of metric values for
  so that
  generates
  without undesirable WSDL-level metric values in the best case.
It can be found in the literature that researchers have been using traditional OO metrics at development time of conventional software to predict the number of defects or other quality attributes (10, 11, 12). With respect to Web Services, though there has been a substantial amount of research concerning improving services interfaces quality (3, 4, 8), the approach to associate implementation metrics with services interfaces has been recently and exclusively explored in (7).
In (7) the authors collect a publicly available data-set of Web Services projects, which by itself has been a valuable contribution to the field, and analyze the statistical relationships between metrics that were taken from services implementations and metrics taken from corresponding WSDL documents. In particular, the authors employed a sub-set of the WSDL metrics presented in (4), as it subsumes those research works focused on obtaining more legible, clear and discoverable WSDL documents (13, 14, 15). Therefore, (7) studies the relationships between service implementation metrics and the discoverability of target services interfaces in WSDL. Complementary, this paper presents the statistical relationships between Object-Oriented metrics (OO) values from the code implementing services and the WSDL metrics values of two metrics suites, namely Sneed’s suite (3) and Basci & Misra’s suite (8).
The suite of metrics proposed by H. Sneed (3) broadly comprises metrics to assess the complexity of services interfaces and to determine their size for estimating testing effort. The suite consists of different kinds of metrics, which range from common size measurements like lines of code and number of statements, to metrics for measuring the complexity and quality of Web Services. All the involved metrics can be statically computed from a service interface in WSDL, since the metric suite is purely based on WSDL schema elements occurrences. For the purposes of this work, we focus on two groups of metrics, namely 6 complexity metrics: Interface Data Complexity (Chapin’s metric (16)), Interface Relation Complexity, Interface Format Complexity, Interface Structure Complexity (Henry et al.’s metric (17)), Data Flow Complexity (Elshof’s Metric), Language Complexity (Halstead’s Metric), and 6 quality metrics: Modularity, Adaptability, Reusability, Testability, Portability, and Conformity. It is worth noting that the terms used to denote quality metrics are known in the literature as properties, factors or characteristics (18). However, we are here strictly following the terminology of Harry S. Sneed, which proposed these quality metrics.
Sneed defines the complexity of a service interface as the median value of its lingual complexity and its structural complexity. By basing on Halstead’s metric (19), Sneed defines the lingual complexity of a service interface as 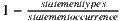 . WSDL schema operators and operands are the types of a statement that can be found in a service interface. At the same time, Sneed defines structural complexity as
  , in which entities are the instances of the data-types, messages, operations, parameters, bindings and ports defined in the schema and occurring in the target interface, and a relationship (vertical or horizontal) refers to compositions and cross-references, respectively. An example of vertical relationship is when a complex data-type definition groups XSD built-in data-types. Another example is when a message groups several parts, or a port-type that arranges two or more operations. Instead, horizontal relationships in a WSDL schema are the cross references from one schema to another and from one data-type to another.
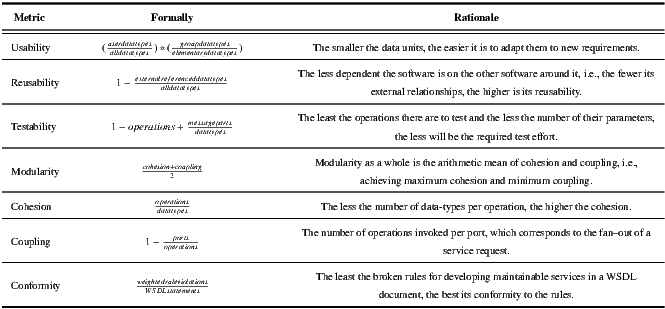
Regarding the service interface quality aspects that can be statically measured from a WSDL document, Sneed defines an intuitive metric suite purely based on WSDL schema elements occurrences. The notation used by Sneed for his metrics refers to group data-types to those XSD elements that are composed of smaller elements, e.g., a complex element with a sequence of built-in elements like int and string. Built-in elements are called elementary ones. User data-types are those elements originally defined in the WSDL types section. Table 1 summarizes these metrics.
All metrics results, except for Conformity, are expressed as a value on a scale of 0 to 1. For complexity metrics, 0 to 0.4 indicates low complexity, 0.4 to 0.6 indicates average complexity, 0.6 to 0.8 indicates high complexity and over 0.8 indicates that the code is not well designed. Instead, for quality metrics 0 to 0.2 indicates no quality, 0.2 to 0.4 indicates low quality, 0.4 to 0.6 indicates median quality, 0.6 to 0.8 indicates high quality, and 0.8 to 1.0 indicates very high quality (20). Additionally, we employed two more metrics that represent the average of either previous groups, namely Average Interface Complexity and Average Interface Quality.
The Conformity metric result is a list of non-conformed rules. The higher the number of non-conformed rules the worse the quality of the WSDL document. Set of rules employed for the Conformity metric has been extrapolated from the work of (21), and consists of 12 rules, namely Adherence to the current standard, Use of prescribed name spaces, Use of in source documentation, Avoidance of any data type, Adherence to the naming convention, Hiding of elementary data types, Restricting the size of data groups, Limiting interface width, Enforcing the first normal form, Minimizing the number of requests, Not exceeding a give size limit, and Limiting the use of links.
3.2 Dilek Basci & Sanjay Misra’s metrics
In the same direction, this paper analyzes whether there are relations between service implementation metrics and the suite of metrics proposed by Basci & Misra (8), which comprises novel metrics for measuring Web Service maintainability by computing the complexity of the information exchanged by Web Services. These metrics can be statically computed from a service interface in WSDL, since this metric suite is purely based on WSDL and XSD schema elements occurrences. Basci & Misra (8) define the data complexity of a Web Service as “the complexity of data flowed to and from the interfaces of a Web service and can be characterized by an effort required to understand the structures of the messages that are responsible for exchanging and conveying the data”. The definition of the Data Weight (DW) metric is based on the above, and computes the complexity of the data-types conveyed in services messages. To the sake of brevity, we will refer to the complexity of a message  as an indicator of the effort required to understand, extend, adapt, and test
  , by basing on its structure.
  counts how many elements, complex types, restrictions and simple types are exchanged by messages parts, as it is deeply explained in (8). Formally:
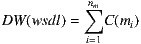 | (2) |
where  is the number of messages that the WSDL document exchanges. For the purposes of this paper, we have assumed
  to consider only those messages that are linked to an offered operation of the WSDL document, thus it does not take into account dangling messages. The DM metric always returns a positive integer. The bigger the DM of a WSDL document, the more complex its operations messages are.
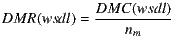
The Distinct Message Ratio (DMR) metric complements DW by attenuating the impact of having similar-structured messages within a WSDL document. As the number of similar-structured messages increases the complexity of a WSDL document decreases, since it is easier to understand similar-structured messages than that of various-structured ones as a result of gained familiarity with repetitive messages (8). Formally:
 | (3) |
where the Distinct Message Count (DMC) metric can be defined as the number of distinct-structured messages represented by ![(C(m),nargs]](/img/revistas/cleiej/v16n1/1a0538x.png) pair, i.e., the complexity value
pair, i.e., the complexity value  and total number of arguments
  that the message contains (8). The DMR metric always returns a number in the range of [0,1], where 0 means that all defined messages are similar-structured, and 1 means that messages variety increases.
The Message Entropy (ME) metric exploits the probability of similar-structured messages to occur within a given WSDL document. Compared with the DMR metric, ME also bases on the fact that repetition of the same messages makes a developer more familiar with the WSDL document and results in ease of maintainability, but ME provides better differentiation among WSDL documents in terms of complexity. Formally:
where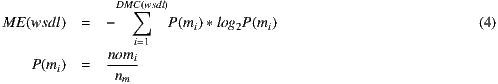
 is the number of occurrences of the
  message, and in turn
  represents the probability that such a message occurs within the given WSDL document. The ME metric outputs values greater or equal than zero. A low ME value shows that the messages are consistent in structure, which means that data complexity of a WSDL document is lower than that of the others having equal DMR values.
 The Message Repetition Scale (MRS) metric analyses variety in structures of WSDL documents. By considering frequencies of ![[C (m ),n ] args](/img/revistas/cleiej/v16n1/1a0545x.png) pairs, MRS measures the consistency of messages as follows:
pairs, MRS measures the consistency of messages as follows:
 | (5) |
The possible values for MRS are in the range  . When comparing two or more WSDL documents, a higher MRS and lower ME show that the developer makes less effort to understand the messages structures owing to the repetition of similar-structured messages.
The next section presents the performed statistical analysis.
4 Statistical analysis and experiments
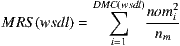
We used regression and correlation methods to analyze whether OO metrics taken on service implementations are correlated with metrics from the associated WSDL documents or not. Broadly, we gathered OO metrics from open source Web Services, calculating Sneed’s complexity and quality metrics and Basci & Misra’s maintainability metrics from WSDL documents, and analyzing the correlation among all pairs of metrics. To perform the analysis, we employed the newest version available of the data-set described in (7) at the time of writing this article. The criteria employed for conforming the experimental data-set consisted of 3 basis: (1) projects should be open source, because we needed to assess metrics from service implementations code; (2) projects source code should be in Java; (3) projects should be self-contained, in the sense that all the resources needed for compiling a project were available. Accordingly, this data-set consists of 154 WSDL documents from open source projects, which were collected via the Merobase component filter, the Exemplar engine and the Google Code Web site. It is worth noting that the data-set used in the experiments is available upon request. All projects are written in Java, and each project offers at least one Axis’ Java2WSDL Web Service description. The data-set is self-contained in the sense that for each service, its implementation code and dependency libraries needed for compiling and generating WSDL documents are in the data-set. All in all, the generated data-set provided the means to perform a significant evaluation in the sense that the different Web Service implementations came from real-life software engineers.We used 11 metrics for measuring services implementations, which played the role of independent variables. WMC, CBO, RFC, and LCOM have been selected from the work of Chindamber and Kemerer (5). The WMC (Weighted Methods Per Class) metric counts the methods of a class. CBO (Coupling Between Objects) counts how many methods or instance variables defined by other classes are accessed by a given class. RFC (Response for Class) counts the methods that can potentially be executed in response to a message received by an object of a given class. LCOM (Lack of Cohesion Methods) provides a mean to measure how well the methods of a class are related to each other. From the work of Bansiya and Davis (6) we picked CAM (Cohesion Among Methods of Class) metric. CAM computes the relatedness among methods based upon the parameter list of these methods. Additionally, we used a number of ad-hoc measures we thought could be related to the WSDL metrics, namely TPC (Total Parameter Count), APC (Average Parameter Count), ATC (Abstract Type Count), VTC (Void Type Count), and EPM (Empty Parameters Methods). The last employed metric was the well-known lines of code (LOC) metric.
On the other hand, the dependent variables were the metrics at the WSDL-level, i.e., those proposed in (3) and (8). Table 2 statistically describes both independent and dependent variables. As shown in Std. Dev. column all dependent variables values were concentrated around the central tendency (i.e., Mean column), while this phenomenon persisted for independent variables values with some exceptions namely LCOM, WMC, and TPC. The Skewness column characterizes the location for metrics values distribution, in particular these results showed that most distributions are skewed to the right since their means were higher than their median. Furthermore, the skewness of three metrics was very near to 0, which is the skewness of the Normal distribution. The Kurtosis column shows that most metrics values did not tend to have a flat top near the mean rather than a distinct peak near the mean, decline rather rapidly, and have heavy tails. These results and the correlation analysis were obtained by using Apache’s Commons Math library(Apache’s Commons Math library, http://commons.apache.org/math).
It is worth noting that all the employed OO metrics have been automatically gathered by using an extended version of the ckjm (22) tool. At the same time, we use Sneed’s SoftAUDIT tool (3) to automate the recollection of the WSDL metrics proposed in (3). SoftAUDIT receives a given WSDL document as input, and returns a metric report in a structured text file. Moreover, to compute DW, DMC, DMR, ME and MRS metrics (8) we used a software library of our own(WSDL maintainability metric suite, http://code.google.com/p/wsdl-metrics-soc-course/) that automates the recollection of these WSDL metrics.
The next section presents the correlation analysis results.
4.1 Correlation analysis between OO and WSDL metrics
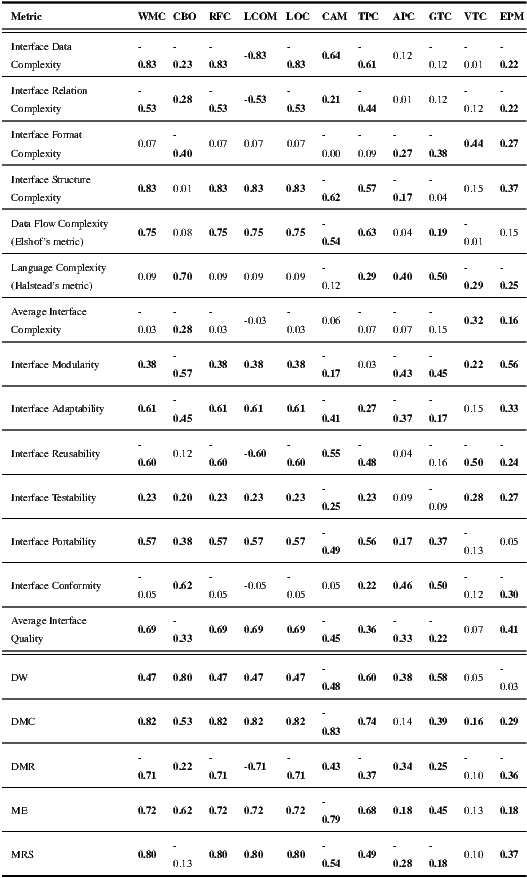
We used the Spearman’s rank correlation coefficient in order to establish the existing relations between the two kind of variables of our model, i.e., the OO metrics (independent variables) and the WSDL metrics (dependent variables). Table 3 shows the correlation between the employed OO and WSDL metrics.
The cell values in bold are those coefficients which are statistically significant at the 5% level, i.e., p-value  0.05, which is a common choice when performing statistical studies (23). The sign of the correlation coefficients defines the direction of the relationship, i.e., positive or negative. A positive relation means that when the independent variable grows, the dependent variable grows too, and when the independent variable falls the dependent goes down as well. Instead, a negative relation means that when independent variables grow, the dependent metrics fall, and vice versa. The absolute value, or correlation factor, indicates the intensiveness of the relation regardless of its sign.
 (a) Sneed’s WSDL metrics
 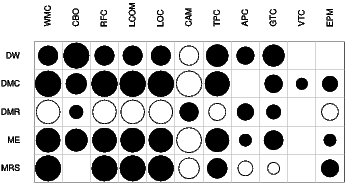 (b) Basci & Misra’s WSDL metrics
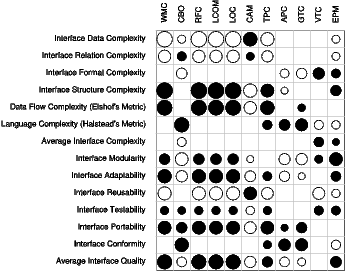
Additionally, for the sake of readability, we have employed a different approach to depict the correlation matrix, which is shown in Figure 2. In the Figure, blank cells stand for not statistically significant correlations, whereas cells with circles represent correlation factors at the 5% level. The diameter of a circle represents a correlation factor, i.e., the bigger the correlation factor the bigger the diameter. The color of a circle stands for the correlation sign, being black used for positive correlations and white for negative ones.
4.2 Exploiting correlation results for improving WSDL documents
From both Table 3 and Figure 2, it can be observed that there is a somewhat high statistical correlation between a sub-set of the analyzed OO metrics and some of the Sneed’s and Basci & Misra’s WSDL metrics. Although correlation between two variables does not necessarily imply that one causes the other, for the purposes of this paper we may assume that this fact allows us to determine which OO metrics could be somehow “controlled” by a software engineer attempting to assure the quality of his/her target WSDL documents. However, for the scope of this paper we will focus on determining a minimalist sub-set of OO metrics in each case, because determining the best set of metrics would deserve a deeper analysis.
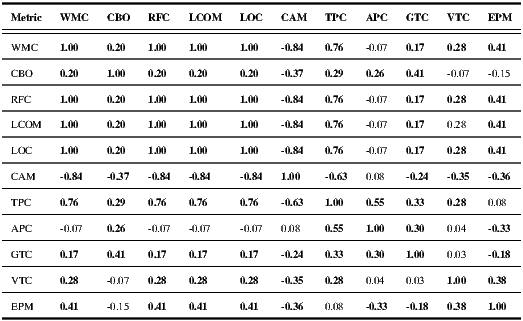
By basing on the previous assumption and since all OO metrics correlate to at least one WSDL metric, one could argue that every independent variable should be controllable. However, the study presented in (7) shows that some OO metrics are not statistically independent among them and, therefore, capture redundant information. In other words, if a group of variables in a data-set are strongly correlated, these variables are likely to measure the same underlying dimension (i.e., cohesion, complexity, coupling, etc.). Because of this, we also calculated the statistical correlation among OO metrics for the employed version of the data-set. Table 4 shows the results, which confirm that OO metrics are not statistically independent. Then, RFC, LCOM and LOC can be removed while keeping WMC, since these are statistically correlated at the 5% level with the maximum correlation factor. To understand why this happens it is worth considering that, in most cases, the WSDL generation tool input is a code facade containing only the signatures of the services’ operations. Therefore, each new method added to the facade contributes with exactly one new line of code, which explains the perfect correlation between WMC and LOC. Similarly, since LCOM measures the cohesion of a class based on its instance variables but the services’ facades contain no such variables, the value of these metrics increases in the same proportion as WMC does. Finally, RFC is defined as the set of all methods and constructors that can be invoked as a result of a message sent to an object of the class. This set includes the methods in the class and methods that can be invoked on other objects. Since methods signatures contain no logic, no invocations are made from the class methods. Therefore, for these facades, the value of RFC is exactly the same of WMC, thus resulting in a maximum correlation factor between the two.
Once the number of independent metrics has been reduced the next two subsections focus on describing the correlation relationships found.
By analyzing the correlation between OO and Sneed’s WSDL metrics, it can be seen that the values of two WSDL metrics can be computed based on the values of a different sub-set of WSDL metrics. Average Interface Complexity is the average value of complexity metrics, and Average Interface Quality is the average value of quality metrics. Then, these two metrics may be removed by basing on the fact that their statistical relationships are represented by base metrics. Furthermore, if we want to keep only highest correlated pairs of variables, the correlation factors below  at the 5% level can be removed. Then, the OO metrics APC, GTC, and VTC can be removed. Then, from Table 3, a new 4x7 table (see Table 5) can be obtained, which represents a minimalist sub-set of correlated metrics.
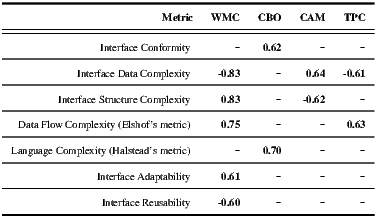
In order to analyze the minimalist sub-set shown in Table 5, it is worth remembering the importance of correlation factor signs, since the higher the value of a WSDL metric the higher its complexity or the best its quality is. To clarify this, let us take for example the case of the TPC metric, which is positively correlated to Data Flow Complexity (Elshof’s metric), but negatively correlated to Interface Data Complexity. This means that if a software engineer modifies his/her service implementation and in turn this produces an increment in the TPC metric, such an increment will cause an increment in Data Flow Complexity (Elshof’s metric), but a fall in Interface Data Complexity. Clearly, incrementing Data Flow Complexity (Elshof’s metric) would be undesirable. However the presented evidence shows that this could be the side-effect of pursuing an improvement in the Interface Data Complexity metric. From now on, we will refer to this kind of situations as trade-offs. As in software literature in general, here a trade-off represents a situation in which the software engineer should analyze and select among different metric-driven implementation alternatives.
As shown in Table 5, the resulting OO metrics are correlated with at least two WSDL metrics, and the signs of the correlations within one metric are always opposite, with the exception of the CBO metric. Therefore, some metrics represent trade-off opportunities. For example, the CAM metric is negatively related to Interface Structure Complexity, but positively related to Interface Data Complexity. Then, by incrementing the CAM metric, resulting WSDL documents will present a better value for Interface Structure Complexity metric than the original WSDL document. However, this will cause a deterioration of Interface Data Complexity metric, since the latter and CAM statistically grow together.
Controlling the CBO metric is safe, in the sense that it does not present trade-off situations and by modifying its value no undesired collateral effects will be generated. This metric is positively correlated to Interface Conformity and Interface Data Complexity. Therefore, a WSDL document may be improved in terms of conformity and data complexity alike by decrementing the CBO metric from its associated service implementation.
Finally, the WMC metric is correlated to 5 of the 7 WSDL metrics in Table 5. The correlation factor signs indicate that the metric is positively related to Interface Adaptability, Interface Structure Complexity, and Data Flow Complexity. This means that by decrementing WMC on a service implementation, the corresponding WSDL document may present improvements with regard to Interface Adaptability, Interface Structure Complexity, and Data Flow Complexity metrics. However, there are two negative correlations, i.e., with Interface Reusability and Interface Data Complexity metrics, respectively. Therefore, WMC presents different 3x2 trade-offs.
We also employed two criteria for reducing the number of OO metrics that particularly explain these WSDL metrics. First, by basing on the data of Table 4 that shows the existence of groups of statistically dependent OO metrics, we select one representative metric for each group for measuring the same underlying dimension. This is, RFC, LCOM and LOC can be removed while keeping WMC, since these are statistically correlated at the 5% level with correlation factor of 1. Second, we removed the APC, GTC, VTC, and EPM metrics because they do not have at least one relationship with its correlation factor above at the 5% level. The rationale of this criterion reduction was, again, to keep only the highest correlated pairs of variables.
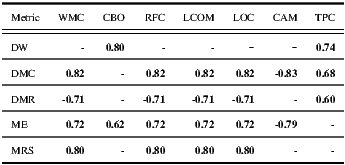
Table 6 represents a minimalist sub-set of correlated metrics, and shows that the DW metric depends on two OO metrics, i.e., CBO and TPC. Then, the DW of a service may be influenced by the number of classes coupled to its implementation, and by the number of parameters their operations exchange. The results also show that DW is not highly influenced by cohesion related metrics, such as LCOM and CAM, neither by how many methods its implementation invokes (RFC) or methods complexity (WMC).
The DMC and ME metrics may be decreased by reducing the complexity of service implementation methods. This means that if a software developer modifies his/her service implementation and in turn this reduces the WMC, RFC and LOC metrics, such a fall will cause a decrement in DMC and ME. At the same time, DMC and ME may be reduced by improving the cohesion of services implementations. This is because when the cohesion of services implementations is improved, LCOM falls and CAM rises, which may produce a lower value for DMC and ME, by basing on the signs of their respective statistical relations. ME is influenced by CBO as well.
The DMR metric has negative correlations with WMC, RFC, and LOC. Surprisingly, this means that when the complexity of services implementations methods grows, the ratio of distinct messages falls. Also, DMR has a positive correlation with TPC, which means that the higher the number of operations parameters the higher the ratio of distinct messages. The MRS metric presents high correlations with 3 complexity and 1 cohesion service implementation metrics.
The presented evidence shows that pursuing an improvement in the DMR metric may conflict with other metric-driven goals. This means that if a software developer modifies his/her service implementation and in turn this produces an increment in the WMC, RFC, LOC or LCOM metrics, such an increment will cause that DMC, ME, and MRS alert about an increment in the WSDL document complexity, however the DMR will fall. Clearly, incrementing DMC and ME would be undesirable, but this could be the side-effect of a gaining in the DMR metric. As mentioned before, this kind of situations could be treated as trade-offs, in which the software engineer should analyze and select among different metric-driven implementation alternatives for his/her Web Services.
In this article, we have empirically shown that when developing code-first Web Services, there is a significant statistical correlation between several traditional OO metrics and some WSDL-related metrics that measure complexity/quality and maintainability at the service interface (i.e., WSDL) level. It is worth noting that a correlation between two variables does not imply causation. In other words, former variable values are not a sufficient condition for latter variable ones. However, such a correlation means that the former variable values are a necessary condition for latter ones (24). In other words, we are not stating that certain levels of WSDL complexity, quality and maintainability are strictly caused by OO metrics values in their associated implementations, but we state that the mentioned WSDL qualitative aspects require certain OO metrics values to be present on services implementations. This enforces the findings reported in (7), in which a correlation between some OO metrics and metrics that measure service discoverability was also found. Interestingly, these facts allow software engineers to early adjust OO metrics, for example via M. Fowler’s code refactorings, so that resulting WSDL documents and hence services are less complex, have better quality and are more maintainable.
However, these findings open the door to extra research questions regarding how to increase/reduce a single OO metric, and how to deal with the various trade-offs that arise. With respect to the former issue, modern IDEs provide specific refactorings that can be employed to adjust the value of metrics such as WMC, CBO and RFC. For metrics which are not that popular among developers/IDEs and therefore have not associated a refactoring (e.g., CAM), indirect refactorings may be performed. For example, from Table 4, CAM is negatively correlated to WMC, so refactoring for WMC means indirect refactoring for CAM. In principle, a complete catalog of refactoring actions for each metric regardless popularity levels could thus be built.
The trade-off problem is on the other hand largely more challenging as we have found that refactoring for a particular OO metric may yield good results as measured by some WSDL metrics but bad results with respect to other WSDL metrics in the same target catalog. For example, for the metrics catalog of (3), it can be seen from Table 5 that reducing the WMC metric positively impacts on Interface Reusability, but negatively affects Interface Structure Complexity. However, the absolute correlation between WMC and Interface Reusability is weaker than the correlation between WMC and Interface Structure Complexity (i.e., 0.60 against 0.83). It is then necessary to determine to what extent WMC is modified upon code refactoring so that a balance with respect to (ideally) all WSDL metrics in a catalog is achieved. Such trade-off situations also apply to the WSDL maintainability metrics studied. The empirical evidence shows that pursuing an improvement in the DMR metric may conflict with other metric-driven goals. This means that an increment in the WMC, RFC, LOC or LCOM metrics will cause that DMC, ME, and MRS alert about a decrement in the WSDL document maintainability, however the DMR will fall. Then, incrementing DMC and ME would be undesirable, but this could be the side-effect of having gains with respect to the DMR metric.
Note that this problem is even more difficult when trying to balance the values of metrics of different catalogs, i.e., when attempting to build a service that is of better quality, and lower complexity, but also maintainable. Therefore, addressing this issue is subject of further research.
The present study has at least one treat to validity, which can be classified as “Internal validity” according to (25). This is because there can be one more factor that has influenced the correlation between services implementations metrics and services interfaces ones, and we have not measured this factor until now. This factor is the tool employed for mapping from services implementations onto WSDL documents. Changing the code-first tools is not always a smooth process, and we have to place effort on preparing each project of the data-set for the specific requirements of each selected tool. For example, for using WSProvide a developer requires to place proper annotations on a service implementation. This is the main reason because in this study code-first tools influence has not been measured. Therefore, in a follow-up study, we will analyze the correlation when WSDL documents are generated via code-first tools other than Java2WSDL, particularly Java2WS, EasyWSDL, and WSProvide. This will allow us to assess the effect of the associated code-WSDL mappings in the correlation tables reported so far.
We acknowledge the financial support provided by ANPCyT through grant PAE-PICT 2007-02311. We thank the reviewers for their helpful comments to improve this paper, and the CIbSE 2012 reviewers for their suggestions regarding the conference version of this paper. We deeply thank Harry M. Sneed and Sanjay Misra for their predisposition and valuable help towards building this article, whom provided us with several relevant documents and articles. Moreover, Harry M. Sneed facilitated us a working copy of the SoftAUDIT tool used in our experiments. We also thank Taiyun Wei, the author of the R script for drawing the graphical correlation matrixes.(1) J. M. Rodriguez, M. Crasso, C. Mateos, A. Zunino, and M. Campo, “Bottom-up and top-down COBOL system migration to Web Services: An experience report,” IEEE Internet Computing, 2011, to appear.
(2) G. Ortiz and A. G. D. Prado, “Improving device-aware Web Services and their mobile clients through an aspect-oriented, model-driven approach,” Information and Software Technology, vol. 52, no. 10, pp. 1080–1093, 2010.
(3) H. M. Sneed, “Measuring Web Service interfaces,” in 12th IEEE International Symposium on Web Systems Evolution (WSE), 2010, Sep. 2010, pp. 111 –115.
(4) J. M. Rodriguez, M. Crasso, A. Zunino, and M. Campo, “Improving Web Service descriptions for effective service discovery,” Science of Computer Programming, vol. 75, no. 11, pp. 1001–1021, 2010.
(5)S. Chidamber and C. Kemerer, “A metrics suite for Object Oriented design,” IEEE Transactions on Software Engineering, vol. 20, no. 6, pp. 476–493, 1994.
(6)J. Bansiya and C. G. Davis, “A hierarchical model for Object-Oriented design quality assessment,” IEEE Transactions on Software Engineering, vol. 28, pp. 4–17, January 2002.
(7)C. Mateos, M. Crasso, A. Zunino, and J. L. O. Coscia, “Detecting WSDL bad practices in code-first Web Services,” International Journal of Web and Grid Services, vol. 7, pp. 357–387, 2011.
(8)D. Baski and S. Misra, “Metrics suite for maintainability of extensible markup language Web Services,” IET Software, vol. 5, no. 3, pp. 320–341, 2011.
(9)R. A. Van Engelen and K. A. Gallivan, “The gsoap toolkit for web services and peer-to-peer computing networks,” in 2nd IEEE/ACM International Symposium on Cluster Computing and the Grid (CCGRID ’02). Washington, DC, USA: IEEE Computer Society, 2002, pp. 128–135.
(10)R. Subramanyam and M. S. Krishnan, “Empirical analysis of ck metrics for Object-Oriented design complexity: Implications for software defects,” IEEE Transactions on Software Engineering, vol. 29, no. 4, pp. 297–310, 2003.
(11)T. Gyimothy, R. Ferenc, and I. Siket, “Empirical validation of Object-Oriented metrics on open source software for fault prediction,” IEEE Transactions on Software Engineering, vol. 31, no. 10, pp. 897–910, 2005.
(12)P. Meirelles, C. S. Jr., J. Miranda, F. Kon, A. Terceiro, and C. Chavez, “A study of the relationships between source code metrics and attractiveness in free software projects,” in Brazilian Symposium on Software Engineering (SBES ’10), vol. 0. Los Alamitos, CA, USA: IEEE Computer Society, 2010, pp. 11–20.
(13)J. Fan and S. Kambhampati, “A snapshot of public Web Services,” SIGMOD Record, vol. 34, no. 1, pp. 24–32, 2005.
(14)M. B. Blake and M. F. Nowlan, “Taming Web Services from the wild,” IEEE Internet Computing, vol. 12, pp. 62–69, September 2008.
(15)J. Pasley, “Avoid XML schema wildcards for Web Service interfaces,” IEEE Internet Computing, vol. 10, pp. 72–79, 2006.
(16)N. Chapin, “A measure of software complexity,” Managing Requirements Knowledge, International Workshop on, vol. 0, p. 995, 1979.
(17)S. Henry and D. Kafura, “Software structure metrics based on information flow,” Software Engineering, IEEE Transactions on, vol. SE-7, no. 5, pp. 510 – 518, sept. 1981.
(18)IEEE Computer Society, “610.12-1990 - IEEE standard glossary of software engineering terminology,” http://standards.ieee.org/findstds/standard/610.12-1990.html, 1990.
(19)M. H. Halstead, Elements of Software Science (Operating and programming systems series). New York, NY, USA: Elsevier Science Inc., 1977.
(20)H. M. Sneed, “Applying size complexity and quality metrics to an Object-Oriented application,” in Proceedings of the European Software Control and Metrics Conference, 1999.
(21)G. K. Tayi and D. P. Ballou, “Examining data quality,” Commun. ACM, vol. 41, pp. 54–57, February 1998.
(22)D. Spinellis, “Tool writing: A forgotten art?” IEEE Software, vol. 22, pp. 9–11, 2005.
(23) S. Stigler, “Fisher and the 5% level,” Chance, vol. 21, pp. 12–12, 2008.
(24)J. Aldrich, “Correlations genuine and spurious in pearson and yule,” Statistical Science, no. 10, pp. 364–376, 1995.
(25)C. Wohlin, P. Runeson, M. Höst, M. C. Ohlsson, B. Regnell, and A. Wesslén, Experimentation in software engineering: an introduction. Norwell, MA, USA: Kluwer Academic Publishers, 2000.

