


Servicios Personalizados
Revista

Articulo
 Inglés (pdf)
 Articulo en XML
 Referencias del artículo
Links relacionados
Compartir

 Permalink
CLEI Electronic Journal
versión On-line ISSN 0717-5000
CLEIej vol.15 no.3 Montevideo dic. 2012
Abstract
This article presents the application of parallel computing techniques to process satellite imagery information for solar resource estimates. A distributed memory parallel algorithm is introduced, which is capable to generate the required inputs from visible channel images to feed a statistical solar irradiation model. The parallelization strategy consists in distributing the images within the available processors, and so, every image is accessed only by one process. The experimental analysis demonstrate that a maximum speedup value of 2.32 is achieved when using four computing resources, but beyond that point the performance rather decrease due to hard-disk input/output velocity.
Spanish abstract
Este artículo presenta la aplicación de técnicas de computación paralela para el procesamiento de imagenología satelital a fin de estimar el recurso solar. Un algortimo de memoria distribuida es presentado, el cual es capaz de generar a partir de imágenes del canal visible la información necesaria para alimentar un modelo estadístico de estimación de irradiación. La estrategia de paralelización consiste en distribuir las imágenes en los procesos disponibles de forma tal que cada imagen es accedida por un solo proceso. El análisis experimental muestra que un speedup máximo de 2.32 es alcanzado cuando se utilizan cuatro procesos. No obstante, si la cantidad de procesos es aumentada por encima de este punto, la performace disminuye debido a la velocidad acotada de entrada/salida de disco.
Keywords: parallel computing, satellite images, solar resource assessment
Spanish keywords: computación paralela, imágenes de satélite, estimación del recurso solar.
Received: 2012-06-10 Revised 2012-10-01 Accepted 2012-10-04
Interest in renewable energies—such as solar and wind energy and its related applications—has strongly increased in the recent years. In Uruguay, a country with no conventional energy resources such as coal, oil, natural gas or potentially fissile materials, renewable energies are seen as a way to reduce the dependence of international oil and energy prices and availability. The Uruguayan government has set some ambitious national objectives concerning renewable energies, which are projected to contributed in more than a 50% of the country primary energy supply by the year 2015. A primordial step for the successful introduction of renewable energy is resource assessment. Even though the important part that is expected for renewable energies to contribute into the primary energy mix, the assessment of the available solar resource at the national territory has been initiated only recently.
The first solar map of Uruguay was built in 2009 based on a well-established correlation between irradiation and insolation ground measurements (1). The spatial and temporal resolution obtained from methodologies based on correlating ground-data is very limited, and the method usually requires applying interpolation techniques. Such interpolation techniques provide limited accuracy, even over small distances. Perez et al. (9) showed that simple satellite-based irradiation models are able to achieve better accuracy for hourly irradiance than interpolation techniques over distances as short as 30 km. In fact, from an end-user perspective, it is preferable to rely on satellite hourly estimates than using ground data from stations located more than 30 km away of the target point.
Historically, models to assess irradiance estimates using satellite information were classified into two categories: statistical (7) and physical (8). Statistical models use regression techniques between satellite data and ground measurements. As a result, they require reliable ground measurements to tune some coefficients to a target region. On the other hand, physical models intend to describe the physical processes that occur at the atmosphere. Satellite-based solar resource estimation is also quite recent in Uruguay. The first local implementation of a irradiation model was done in 2011 (2). A statistical model was adjusted for the Uruguayan territory and it was able to perform hourly irradiation estimations with a spatial resolution of 2km and an uncertainty of 19.8%.
For research purposes, is usually required to process several times a big amount of satellite images. Typically, processing all the 91950 images database demands more than a day of computing time. The main contribution of this article is to present a study devoted to show how parallel computing techniques help to compute efficiently the satellite inputs required for a satellite-based solar resource model. A distributed-memory parallel algorithm was developed to assess mean satellite observed brightness in site neighborhoods that are distributed through the target territory. The utility of the proposed parallel algorithm relies in the possibility of performing in significantly reduced execution times the processing of the complete image database, which could be useful, for example, to process several times the data-bank varying the neighborhood size.
The rest of the article is organized as follows, in section 2 a brief description of the model and the satellite data-bank is presented. Section 3 explains the main design considerations for the parallel algorithms, while the implementation details of the proposed algorithm are described in section 4. The experimental analysis is reported in section 5. Finally, section 6 presents the conclusions of the research and the main lines for future work.
This section briefly describes the model implemented in this article to assess solar irradiation from satellite imagery, and the required satellite information. Also, a description of the satellite data-bank and its information is offered.
2.1 Satellite-based model for solar resource estimates
The first model that use satellite information to estimate the available solar resource at ground level adjusted for the Uruguayan territory was the one by Justus et al. (6). This model is a parametrization to estimate solar radiation from satellite data proposed in 1979 by Tarpley et al. (11), modified in 1986 by Tarpley and colaborators to his actual version, due to some bias problems noticed in the previous model. We will refer to that second version as JPT model hereafter. The JPT model is, in fact, an statistical model that utilizes visible channel satellite information to provide and estimation of the total amount of solar energy at a given point—specified by his latitude and longitude—at an hourly scale.
Taking into account the statistical conception of the model, some parameters must be adjusted for a target region using measurements from both satellite radiometer and ground pyranometers. The JPT model proposes the multiple regression presented in Equation 1 where the parameters  ,
,  ,
,  and
and  are the regression coefficients.
 | (1) |
In Equation 1,  is the hourly value of the solar constant (
 4920 kJ/m
 ),
),  is the cosine of the zenital angle and
  is a factor that accounts to the Sun-Earth distance. All these variables could be calculated knowing the spatial position of a site
  (latitude and longitude, respectively) and a given time
  (day of year and hour) (5).
The information required from satellite images for both operational purposes and model adjustment, are the values of  and
and  .
.  is the actual brightness of a site at a certain time, and
  is the brightness for the same site and time but in clear-sky condition. So that, we will refer to
  simply as a site brightness and to
  as a clear-sky brightness. Once the values of
  , brightness, and clear-sky brightness are calculated for every hour for each site, it is possible to make an estimation of the hourly irradiation, or, if the hourly integral for measurement is available for a specific site, it is possible to perform an adjustment of the coefficients
  ,
,  ,
,  , and
, and  by using a standard least square technique.
Due to the non-homogeneous shape of clouds and their quick movement within an hour, the  values are averaged in a small cell of a site. If more than one image is available for the hour, the
  hourly value is assessed by the mean value of the values obtained at each image. In order to compute the clear-sky brightness, a parametrization is trained based on the
  values. Thus, the computation of the
  values by averaging the counts in a small cell of a site is the base step of the process.
In this article, we focus on the implementation of a parallel algorithm to perform the computation of the brightness values for equally spaced sites in latitude and longitude through the Uruguayan territory.
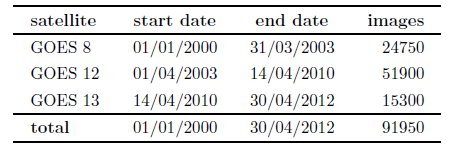
Image database consist of observations of the Geostationary Operational Environmental Satellite (GOES) located at geostationary orbit at 75 degrees West. The series of satellites that operated in that position is called GOES-East. An image for the visible channel and five spectral bands are available. The images were downloaded from the Comprehensive Large Array-data Stewardship System (CLASS) website that is administrated by the National Oceanic and Atmospheric Administration (NOAA), and available at http://www.class.noaa.gov. Images from the time period 2000 to date were acquired. The spatial resolution of the images is about 2km between pixels for the target region and, in average, there are two images per hour. GOES-East physical device has changed over time so that the database is compose with GOES8, GOES12 and GOES13 images.
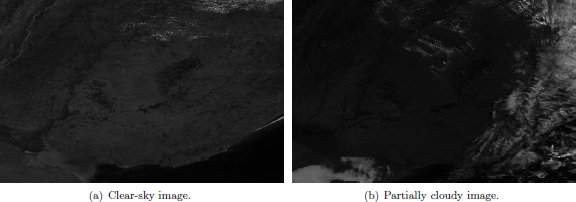
In total numbers, more than 90.000 images such as the ones presented in Fig. 1 must be processed in order to compute solar irradiation estimations for all the data-bank period. Without using parallel computing, processing this amount of images could take about 15 hours to perform in a single PC/server machine. Table 1 shows the composition of the satellite data-bank up to April 2012.
The images acquired are in NetCDF format, a standard machine-independent data format that support the creation, access, and sharing of array-oriented scientific data (10). Visible channel information is recorded in each file as a data matrix. Also, every file have his own navigation information due to the fact that GOES satellite might present orientation movements. Two additional matrices that correspond with the latitude (lat) and longitude (lon) are available for each image file. A position  in the matrices lat and lon correspond to the latitude and longitude information of the brightness count at the same matrix position.
The spatial window of the target region varies between 30 and 35 degrees South, and 53 and 59 degrees West, including the Uruguayan territory. A total of  averages are needed to compute
  at cells that are spaced by 5 minutes in latitude-longitude intervals.
3 Parallel computing for satellite image processing
This section describes the main details about the parallel model and the design of the proposed parallel algorithm.
3.1 Context and parallel model
The parallel implementation described in this article is the first step for migrating the system to a C platform using parallel computing strategies, in order to implement an efficient operational model for solar image processing. The operational model will allow researchers to perform efficiently experiments related to the characterization and prediction of solar energy availability, climate research (fog, precipitation, cloud classification, etc.), agricultural products like the estimation of evapotranspiration, and other satellite assessed products. As a result, not only the main parallel algorithm was developed, but also a set of common libraries that are used by other similar algorithms or may be used by future ones. The implemented libraries are independent from any parallelization scheme.
Processing a single image takes a reduced execution time (about half a second), so each image can be efficiently processed by an individual processor. Applying parallel processing within each image is not useful from a performance-oriented point of view, since it severely reduces the granularity of each task, and causes that several processes simultaneously try to access to the same image or to write to the same output file.
The real complexity of the tackled problem relies on the large number of images to process. Thus, a data-parallel scheme was adopted to efficiently solve the problem. Several processes are used, each one of them conceived to execute in a different node in a distributed-memory cluster infrastructure. A master-slave parallel model was adopted as shown in Fig. 2.
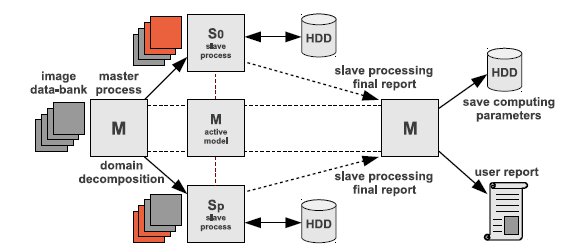
The master process is in charge of performing the domain-decomposition and the distribution of work to slave processes. The domain decomposition approach divides the total amount of images into  subsets of time consecutive images, where
  is the total amount of processes. At the beginning of its execution, every process receives a reference of the first and last image it is supposed to compute.
An active master-slave model is used: the master process also works in the image processing, performing the same operation than the slave processes.
Cell size may not be the same as the spacing between cells. Spacing between cells correspond with the spatial resolution of the resulting irradiation map for every image. On the other hand, cell size is concerned with the accuracy which with a  value, calculated for one particular image time, could represent all the time interval between two images. In this article, we work with
  cell size and
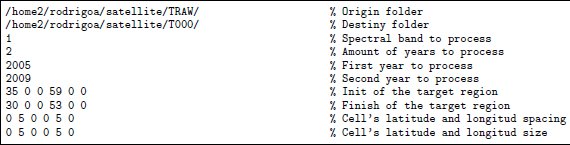
  latitude-longitude spacing between cells. These parameters are introduced via plain text file by the user, jointly with other configuration options. An example of a plain text file with input parameters to feed the algorithm is presented in Fig.3.
4 Parallel implementation of the image processing algorithm
This section describes the details of the implemented parallel algorithm. It presents a description of the set of common libraries implemented and their characteristics, the parallelization scheme, and other features of the parallel implementation.
4.1 Brief description of implemented libraries
Three libraries were built: (a) a processing library, which implements all the specific processing duties, (b) an assigment library to assess the distribution of duties in the parallelization, and (c) a calibration library to perform satellite calibration and count-to-radiance conversion.
The processing library implements all the specific functionalities required for image processing. This library includes the specials features to interact with NetCDF files, to write down the information to disk, and the logic to process every image. The reference to the start and finish image is received as a parameter. The images are scanned and the pixel values are accumulated in the corresponding cell based on the latitude and longitude information for the pixel. The average is computed for each every cell by performing the quotient between the accumulated value and the total amount of pixels counted for that cell. Finally, the average matrix of equally spaced cell is saved to disk.
In the current version of the processing software, the user is able to specify which years of images want to process. The assignment library is able to count how many images were requested to process by scanning hard-disk drive directories. Also, it has the internal logic to assess the domain-decomposition and the load balancing that is explained in the next subsection.
Finally, a library for satellite calibration was implemented. A set of coefficients is applied to the brightness count values to assess satellite observed radiance or to compensate the radiance due to satellite sensor degradation. These coefficients differ depending on the physical device and time. A different calibration procedure can be applied if a better one is available. Thus, a modular approach was followed to design the calibration library in order to easily allow changing this module.
Taking into account the uniform processing model for images, a static load balancing scheme was used. All the images in the data-bank have the same size and the processing of each separately image is exactly the same.
The parallel algorithm was conceived to execute in a dedicated parallel computing infrastructure. Thus, there is no a priori reason to think that a given process will result overloaded. In the proposed parallel algorithm, load balancing is performed simply by dividing the domain into subsets containing the same amount of images. The experimental evidence showed that in practice, some processes usually complete its assigned processing before some other ones, when executing the algorithm in operational mode. However, the deviation from the ideal equally-time processing is never larger than 20 images when processing a entire year (approximately 7500 images), corresponding to a negligible value of less than 10 seconds of execution time.
In the static load balancing scheme used, the distribution of images is done by the assignment library, which is able to count all the actual images at the directories. Then, the image assignments are performed based on the available quantity of processes  and the total amount of images required to process. The responsibilities for each process is assigned by generating six arrays, which keep the information about the starting and finishing image for each process.
Thus, two arrays indicate the starting and finishing year, two more indicate the starting and finishig month and, finally, the last two arrays got the information about the starting and finishing image’s index in the corresponding starting and finishing folder. The size of these arrays is equal to  , and are such that, when the
  -process,
  , evaluates them in the
  position, they specify the first and last image of the assignation to that process.
The parallel algorithm was implemented in C. The parallelism was implemented following the MPI standard for parallel and distributed programming (4), by using the 1.2.7p1 version of the well-known MPICH implementation.
The algorithm is composed by four main stages: (a) initialization and data parallel distribution (b) upload of images from hard-disk, (c) computation of the  values for each assigned image, and (d) save processed data to hard-disk. A final step is done by the master process to save some final parameters and information regarding the size of the cell, the amount of cells, and the grid used in the processing. A graphical explanation of this scheme is presented in Fig. 4.
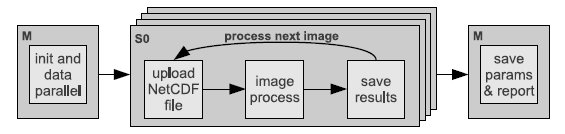
The master process is in charge of performing the initialization phase of the algorithm. The master reads the user data, initializes some parameters of the system (e.g. paths, filenames, cell size and spacing), counts the images in the data-bank, and generates the data for domain decomposition. After that, the master process send the references about the images, as well as user and system variables, to each one of the  slave process. Once the initialization phase is done, every slave process knows all the data needed to work independently. In particular, each slave have references to the first and the last image to process and where it has to write down to hard-disk the information about the processing of each assigned image.
The output of the processing includes six plain text files. Four of them contain the grid values that correspond to the brightness for each cell, and three subproducts from the image calibration. The last two files are the grid mask that indicate if a given value in the grid is corrupted or not, and the amount of pixels counted for each cell in the grid. When a process finishes its assigned processing, it sends a notification to the master, jointly with a resume of the processing performed. Since all processes inform the master when they stop working, the master knows when all the requested processing is done.
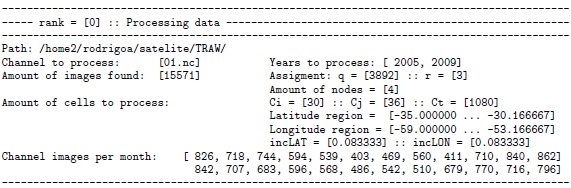
Fig. 5 shows an example of the (optional) user output that the master process writes after the initialization stage just before creating and launching the slave processes. In order to illustrate the domain decomposition performed, the sample case in Fig. 5 shows that the algorithm is executed with four processes executing on four processing units ( ) and the parameters already presented in Fig. 3. In the presented example, each process is in charge of processing 3892 images (
 ), and 3 out of 4 processes has to compute one extra image (
 ). A total number of 15.571 NetCDF files are processed. This kind of output is useful to inform the user about the system parameters, as a way to know if they are adequate before processing.
This section describes the computational platform and the image test-set used in the experimental analysis. After that, the methodology followed in the experimental analysis is described. Finally, the results of the performance analysis are presented and discussed, with special emphasis on the speedup analysis of the parallel algorithm.
The experimental analysis of the proposed parallel algorithm was performed in a server with two Intel quad-core Xeon processors at 2.6 GHz, with 8 GB RAM, CentOS Linux, and Gigabit Ethernet. The infrastructure is part of the Cluster FING, Facultad de Ingeniería, Universidad de la República, Uruguay; cluster website: http://www.fing.edu.uy/cluster).
A test-set of images was used to carry out the performance analysis for the satellite data-bank processing algorithm. NetCDF files that correspond to satellite images of the year 2011 were used. A total number of 7670 images comprises the data-bank information for that year, which represent a total disk capacity of about 60GB. Hard-disk drive used to store the test set was local to the node used to run the evaluation, to avoid the performance degradation due to transferring large image files through NFS.
The experimental evaluation studies the execution time of the parallel algorithm when varying the number of working processes between 2 and 8. This subsection introduces the performance metrics used to evaluate the parallel algorithm and the methodology used in the analysis.
The most common metrics used by the research community to evaluate the performance of parallel algorithms are the speedup and the efficiency.
The speedup evaluates how much faster a parallel algorithm is than its corresponding sequential version. It is computed as the ratio of the execution times of the sequential algorithm ( ) and the parallel version executed on
  computing elements (
 ) (Equation 2). When applied to non-deterministic algorithms, the speedup should compare the mean values of the sequential and parallel execution times (Equation 3). The ideal case for a parallel algorithm is to achieve linear speedup (
 ), but the most common situation is to achieve sublinear speedup (
 ), mainly due to the times required to communicate and synchronize the parallel processes.
The efficiency is the normalized value of the speedup, regarding the number of computing elements used to execute a parallel algorithm (Equation 4). This metric allows the comparison of algorithms eventually executed in non-identical computing platforms. The linear speedup corresponds to  , and in the most usual situations
  .
.


5.3.2 Statistical analysis of execution times.
In order to reduce the effect of non-determinism in the execution, a well-know side effect of parallel programming (3), fifty independent execution of the parallel program were performed for each value of  . For every execution the total time spent for processing the image data-bank was recorded, and the average execution time of the fifty executions was computed for every value of
  , in order to compute an accurate estimation for the operation time of the test.
In addition, an estimation of the time required by the sequential algorithm was computed by averaging fifty executions. The proposed parallel algorithm does not modify the algorithmic structure of the sequential version, since only the image processing is performed in parallel and no additional components are included. From the algorithmic point of view, the required communication between master and slave processes to start the execution and return the results is identical to a standard function calling in a sequential algorithm.
The time required for both the initialization of the MPI environment and the data parallel distribution are negligible in comparison with the time needed to processed the images. The final stage of recoding the system parameters and the grid data, which is performed by the master process, cannot be parallelized. It is included in the serial fraction of the parallel algorithm, since it demands the same execution time that when using a sequential algorithm. Taking into account the previous comments, the time that a sequential algorithm will require to perform the processing is almost equal to the time that the proposed parallel algorithm needs when using a single processing element( ).
).
With the aforementioned execution time values, estimations for the speedup and efficiency metrics are computed to evaluate the performance of the proposed parallel algorithm for solar image processing.
Table 2 reports the best, average, and standard deviation ( ) values of the execution times computed in the fifty independent executions performed for both the sequential and the parallel algorithm for different values of the number of processes
  . The corresponding speedup values for different values of
  are also reported.
 .
.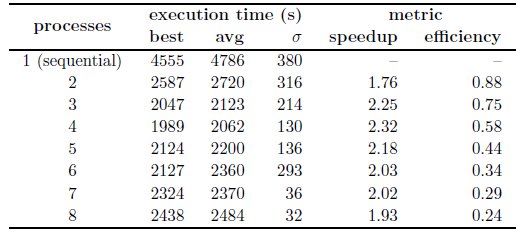
According to the straightforward domain decomposition approach applied in the proposed parallel algorithm, the performance was expected to increase when increasing the number of processes. However, the analysis of the execution time results reported in Table 2 indicates that this behavior only holds for  .
.
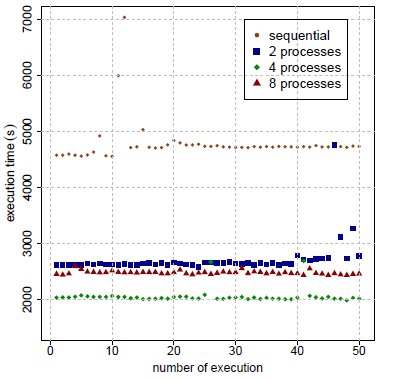
Fig. 6 shows examples of the estimated average execution time values obtained in the fifty executions of the sequential and the parallel algorithm with  ,
,  and
and  . The figure shows that the majority of the execution time values are aligned, and the standard deviation tends to reduce when more processes are used.
 ,
,  ,
,  , and
, and  .
.
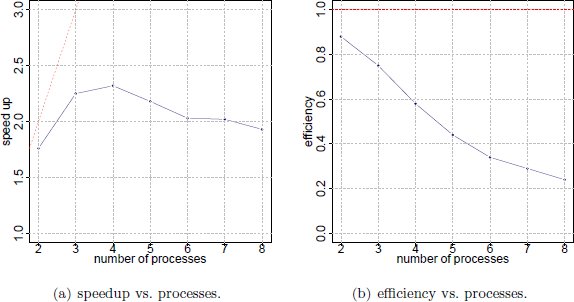
Regarding the speedup and efficiency metrics, a speedup value of 1.76 was achieved when working with  and then it is slightly improved using more processes, obtaining a maximum speedup value of 2.32 at
  . Beyond this point, using more processes causes the execution times to deteriorate. The most probable explanation for this phenomena is that the input/output capacity of the hard-disk drive severely affects the computational efficiency of the proposed parallel algorithm. Due to the large data transferred, the maximum bandwidth capacity of the data bus is almost reached using
  and fully achieved using
  . In addition, when a large number of processes (e.g.
  ) is used, the idle times due to unbalanced processing also contributes to reduce the computational efficiency of the proposed parallel algorithm.
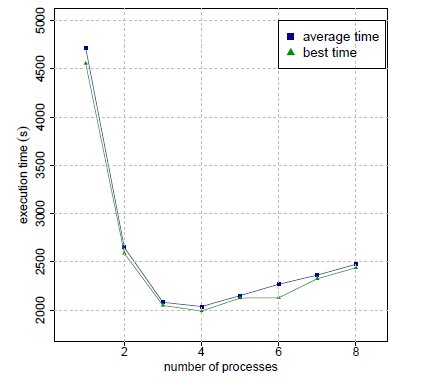
The variation of the best and average execution times for different values of  is presented in Fig. 7. The variation of the values for the speedup and efficiency metric for different values of
  is presented in Fig. 8 (a) and (b), respectively.
This article has presented a parallel implementation for an algorithm to process satellite image information for solar resource estimates.
Nowadays, satellite applications in Uruguay are at a research stage. As a consequence, satellite imagery is being processed several times. Processing each image individually does not take many computational effort and half a second is often spent. The complexity of the problem lies in the big amount of images that should be processed. The computation of all the database involves to work with more than 90000 images and a suitable automatic solution to process such a volume of information is needed. In this line of work, the parallel computing strategy described in this article was applied to reduce the computation time of a GOES-East satellite data-bank.
A parallel master-slave algorithm was developed in order to solve the particular problem of computing the inputs for a satellite-based solar irradiation model. Also, a set of common libraries were implemented to address specific processing tasks. The proposed scheme is based on image domain-decomposition in order to fully exploit the master-slave parallel model when executing in a cluster infrastructure.
The experimental analysis show that significant improvements in the execution times are obtained with the parallel algorithm when compared with the sequential version. A maximum speedup value of 2.32 was reached by the proposed parallel algorithm when using four processes, but when using more than four processes the computational efficiency reduces and the execution times increase. The phenomena is explained by the limited input/output hard-disk drive bandwidth of the infrastructure used. In its current implementation, the algorithm shall be used splitting the work on four processes, to take the best advantage of the parallel platform. Although the proposed parallel algorithm does not scale appropriately for more than four processes, it is a promising first step in the quest of designing an efficient automatic tool for solar image processing in our research context.
The main lines for future work are related to improving the computational efficiency of the proposed method, by addressing the main issues that conspire against a good scalability behavior. We plan to implement both a dynamic load balancing to execute in non dedicated infrastructures, and the parallelization of hard-disk drive access as a strategy to reduce the negative effects of hard-disk bounded bandwidth. The distribution of images in different physical hard-disk drives will aloud to launch processes in nodes with local access to them. This is expected to increase the efficiency of the parallelization when using more than four processes, and thus, to decrease execution times in such situation. Another promising line for future work is the possibility of executing the image processing in grid infrastructures, in order to take advantage of the large resource availability of distributed computing platforms.
The work of R. Alonso has been partially supported by ANII and CSIC, Uruguay. The work of S. Nesmachnow has been partially supported by ANII and PEDECIBA, Uruguay.
(1) G. Abal, M. D’Angelo, J. Cataldo and A. Gutierrez, Mapa Solar del Uruguay. IV Conf. Latinoamericana de Energía Solar (IV ISES-CLA), 2010 (text in Spanish).
(2) R. Alonso, G. Abal, R. Siri, P. Musé and P. Toscano, Solar irradiation assessment in Uruguay using Tarpley’s model and GOES satellite images. Proceedings of the 2011 ISES Solar World Congress. 2011.
(3) I. Foster, Designing and Building Parallel Programs: Concepts and Tools for Parallel Software Engineering. Addison Wesley, 1995.
(4) W. Gropp, E. Lusk and A. Skjellum, Using MPI: portable parallel programming with the message-passing interface. MIT Press Cambridge, MA, USA, 1999.
(5) M. Iqbal, An introduction to Solar Radiation, Academic Press, 1983.
(6) C. Justus, M. Paris and J. Tarpley, Satellite-measured insolation in the United States, Mexico, and South America. Remote Sensing of Environment, vol. 20, pag. 57-83, 1986.
(7) M. Noia, C. Ratto and R. Festa, Solar irradiance estimation from geostationary satellite data: 1. Statistical Models, Solar Energy 51, 449–456, 1993.
(8) M. Noia, C. Ratto and R. Festa, Solar irradiance estimation from geostationary satellite data: 2. Physical Models, Solar Energy 51, 457–465, 1993.
(9) R. Perez, R. Seals and A. Zelenka, Comparing satellite remote sensing and ground network measurements for the production of site/time specific irradiance data, Solar Energy 60, 89–96, 1997.
(10) R. Rew and G. Davis, NetCDF: An Interface for Scientific Data Access, IEEE Computer Graphics and Applications 10(4), 76–82, 1990.
(11) J. Tarpley, Estimating Incident Solar Radiation at the Surface from Geostationary Satellite Data. Journal of Applied Meteorology, vol. 18, pag. 1172-1181, 1979.

