


Services on Demand
Journal

Article
 English (pdf)
 Article in xml format
 Article references
Related links
Share

 Permalink
CLEI Electronic Journal
On-line version ISSN 0717-5000
CLEIej vol.14 no.1 Montevideo Apr. 2011
Rensselaer Polytechnic Institute, Troy, NY 12180, USA
http://wcl.cs.rpi.edu
Effective visualization is critical to developing, analyzing, and optimizing distributed systems. We have developed OverView, a tool for online/offline distributed systems visualization, that enables modular layout mechanisms, so that different distributed system high-level programming abstractions such as actors or processes can be visualized in intuitive ways. OverView uses by default a hierarchical concentric layout that distinguishes entities from containers allowing migration patterns triggered by adaptive middleware to be visualized. In this paper, we develop a force-directed layout strategy that connects entities according to their communication patterns in order to directly exhibit the application communication topologies. In force-directed visualization, entities’ locations are encoded with different colors to illustrate load balancing. We compare these layouts using quantitative metrics including communication to entity ratio, applied on common distributed application topologies. We conclude that modular visualization is necessary to effectively visualize distributed systems since no one layout is best for all applications.
Spanish abstract.
La visualización efectiva es crítica para desarrollar, analizar y optimizar sistemas distribuidos. Hemos desarrollado OverView, una herramienta para visualización en línea y fuera de línea de sistemas distribuidos, que permite el uso de mecanismos modulares de presentación, para que diferentes abstracciones de alto nivel para sistemas distribuidos como actores o procesos puedan ser visualizadas de forma intuitiva. OverView usa por defecto una presentación concéntrica y jerárquica que distingue entidades de contenedores, permitiendo que los patrones de migración activados por middleware adaptativo sean visualizados. En este artículo, establecemos una estrategia de presentación dirigida por fuerza, que conecta entidades de acuerdo a sus patrones de comunicación para exhibir directamente las topologías de comunicación de la aplicación. En la visualización dirigida por fuerza, la localización de las entidades están codificadas por diferentes colores para ilustrar el balanceo de cargas. Comparamos estas presentaciones usando métricas cuantitativas incluyendo la razón de comunicaciones a entidades, aplicada a topologías comunes en sistemas distribuidos. Concluimos que la visualización modular es necesaria para visualizar efectivamente sistemas distribuidos dado que ninguna presentación es la mejor para todas las aplicaciones.
Keywords: distributed systems visualization, network topologies.
Spanish Keywords: visualización de sistemas distribuidos, topologías de red.
Received 2011-Jan-24, Revised 2011-Mar-31, Accepted 2011-Mar-31
Distributed systems promise increased computation power and capabilities for organizations at relatively low prices, although at a cost of increased complexity. This increased complexity rests on the shoulders of distributed application developers to be solved. Consider a scientist who would like to observe the interactions between computers while they run a high performance parallel simulation. Consider a middleware developer who would like to assess the locations of various parts of a distributed program, to ensure that the program’s structure on the network is conducive to efficient inter-process communication. Consider visualizing computational activity of BOINC infrastructures[1], such as SETI@Home[2] or MilkyWay@Home [5]. Finally, consider visualizing the structure of a BitTorrent[4] swarm as its activity spikes and dwindles over time. Visualizing distributed systems, whose reconfiguration is not intuitive or easy to keep track of, is critical to assess the efficiency and performance of distributed applications.
The usual approach to distributed system understanding, involves attaching a debugger to each of the locations in which the system is executing, forcing the individual analysis of each of the locations of execution in the system. Progress has been made in terms of the visualization of distributed systems, with the creation of tools like Pip, WiDS, Jinsight[20], Jive[25], Hy+[6] and OverView[7]. OverView provides a more complete insight to a distributed program’s execution, given it’s capabilities for online/offline visualization and high level abstraction representations, as noted by Desell et al.[7]. Accurate visualization of distributed systems provides scientists and developers with tools for proper assessment of the distributed system’s performance in a large scale, taking all the execution locations into account. More particularly a visualization should provide information as to the proper co-location of actors on different locations.
Given the different network topologies that constitute different distributed systems, it is the purpose of this paper to determine the suitability of a modular approach proposed for OverView[7] to achieve this broad perspective. Two visualization modules are proposed, hierarchical concentric and force-directed, which are evaluated to find their limitations and to stress the convenience of OverView’s modular architecture to develop suitable visualizations for different types of applications. OverView’s architecture is described, as well as it’s bytecode instrumenting features and visualization module development examples.
The hierarchical concentric module proves effective in representing topologies resulting from structured overlay networks, such as Chord [24] because of it’s ring-like appearance and effective conveyance of the logarithmic number of references. This is further discussed in Section 4. When the network is deployed in a manner that requires actors to send large amounts of messages to each other, visualization becomes more difficult when using the hierarchical concentric module, because the representation becomes cluttered and messages can not be distinguished from each other. The force-directed module increases the amount of actors that can be effectively visualized in some of these topologies with a large communication to entity ratio since space is more efficiently distributed by inferring attraction/repulsion laws from communication between entities as discussed in Section 3. Analytical and experimental analysis of both modules results in the determination of each model’s effectivity at conveying distributed systems in theoretical and real scenarios, as discussed in Section 5.
OverView has been used to visualize various distributed environments, most notably by instrumenting the SALSA programming language [26] (http://wcl.cs.rpi.edu/salsa/). The examination of the existing modules as they are plugged in to OverView, demonstrates the simple nature of using OverView’s event processing approach to develop visualization modules, in order to convey the nature of a distributed application as developers or scientists require.
The majority of distributed systems visualization systems involve the use of timeline views derived from Gantt-charts [28], with notable examples including Jumpshot [29], Paj [14], ParaProf [3], Paraver [21], Projections [15] and Vampir [19]. While these timeline views are quite useful for smaller sized distributed applications, providing an effective visualization using this approach for large scale systems is problematic as it is very difficult to display the timelines for a large number of distributed entities concisely, as they are limited by the number of entites that can fit vertically within a display.
However, there has also been some recent work in scalably visualizing distributed systems that does not follow this approach. The Trivia tool [22] has been successfully used to visualize large scale simulations of BOINC volunteer comptuing grids [18]. This approach does have some similarities with OverView, such as a topological aware visualization, which represents the usage of different resources such as bandwidth with differently sized colored links between different computing hosts. However, this topological aware visualization only provides static locations for the visualized computing hosts, which can lead to confusing visualizations of dynamic systems. In addition to this topological aware visualization, there is also a treemap visualization which is uses a hierarchical space filling approach to display resource utilization. However, this visualization approach only deals with previously gathered traces of the distributed application execution, as opposed to OverView which offers both online and offline visualzation. This tracing approach may not be viable for long running large scale applications, as the traces could become extremely large. It also is a more coarse grained approach to visualization, as different nodes in the topological aware and treemap visualizations are different computing hosts, while OverView can visualize the communication between different computational entities on a single host.
The Ibis Project [23] also provides some large scale distributed systems visualization using SmartSockets [17] and JEL [9], the Join-Elect-Leave model for resource tracking. This provides a tree like visualization, which is similar to OverView in that JEL allows dynmaic joining and leaving of resources. However, it is tailored specifically for grid computing and only provides a coarse grained visualization, only displaying the links between the clusters in a grid and the individual computing hosts within those closters, in the form of a balloon view [12].
Liggesmeyer et al [16] also provide a tree like visualization for faults in a distributed system, using a gossip based approach for the dianostic of these faults [13]. This approach is interesting in that it provides a three dimensional layout of the computing hosts, and uses transparent containers to display different clusters, however it is limited to only displaying fault information.
Frishman and Tal[10] have also developed a visualization tool which bears a number of similarities to our own. While it is limited to using mobile objects (a single model of distributed systems, and thus is less generic), it takes an interesting approach to scalability. It suggests providing the user a means to select one or more points of focus; that is, parts of the visualization that are of interest. Then, the software visualization will use an algorithm to determine which mobile objects it can filter out as being uninteresting to the user. This stands in contrast to its negative: the approach of selecting the objects one wishes to filter out. Such a means might provide a better-scaling visualization; ultimately, there will always be fewer entities one is interested in than entities one is not.
Another software visualization framework which is similar to OverView is EVolve[27], having the notion of events which describe the runtime behavior of an application being translated into a graphical visualization. It focuses upon object-oriented computations, supporting visualization of method invocations; while it’s visualizations are less intuitive and generic, they are scalable and provide a large amount of information content, and may even be layered naturally on top of each other to show the user different types of information at once.
OverView[7] is a toolkit which permits visualization of Java-based systems; in particular, distributed systems such as those previously described (OverView versions 0.1 and 0.2 were developed as a plugin for the Eclipse IDE. OverView’s current version (0.5) is stand-alone to better support future features such as running the visualization from within a web browser as a Java applet.) The toolkit includes three programs, each of which performs a different task (see Figure 1):
- The OverView Instrumenter, or OVI, which allows the abstraction of a Java program’s execution into a set of visualizable events by inserting unobtrusive event-sending behavior into existing Java bytecode.
- The OverView Presenter, or OVP, which receives and interprets events into a meaningful, interactive, graphical representation of the state of the distributed system. OVP has several visualization modules, each of which can display the distributed system in a different layout.
- The OverView Daemon, or OVD, which acts as an event relay, collecting events sent by event sources (that is, any active instrumented program), and forwarding those events to event sinks (that is, any listening visualization program).
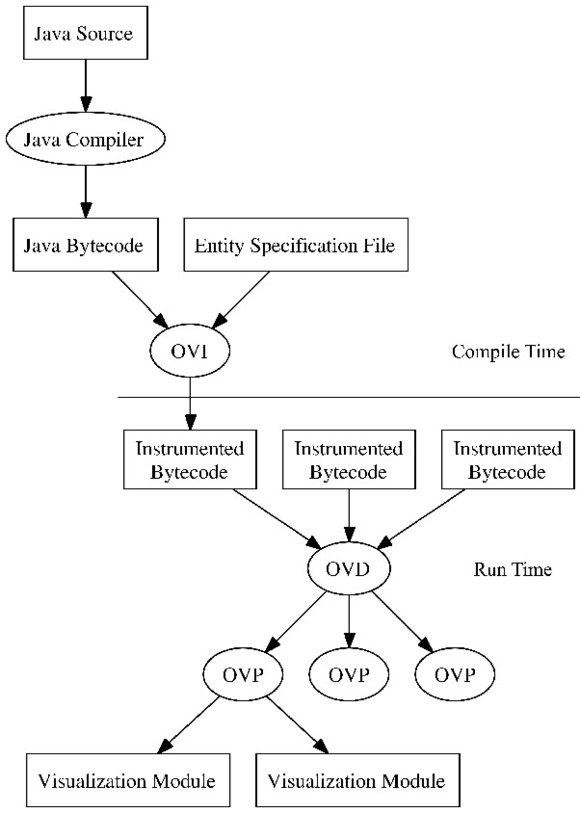
Users add event-sending behavior to any existing Java program by writing an Entity Specification Language (ESL) file, which uses a simple, declarative syntax to map Java method invocations to OverView events. These events are sent, at run-time, over a network to a listening OVD. ESL’s simple grammar definition (see [7] for details) allows the instrumentation of existing Java bytecode.
OVP can listen for incoming events from multiple sources, both online network connections and offline log files. It will multiplex these events and forward them to a visualization module, in addition to time stamping and logging them, so that they may be played back at a later date if desired. OverView visualization modules are written using the Processing Development Environment (http://www.processing.org/).
OverView’s visualization model is based on two fundamental units, called entities and containers. An entity embodies the concept of a discrete unit of computation, which could refer to an object, an actor, an ambient, a process, or even a virtual machine. A container refers to the environment in which an entity exists. Every OverView visualization is composed of some aggregation of these two basic elements.
- Position/1: Tells OverView to create a particular entity, or to move one if it already exists, outside of any container.
- Position/2: Tells OverView to create a particular entity inside a particular container. Again, if the entity already exists, it is moved instead of being created. If the container does not yet exist, it is created and placed outside any other container.
- Deletion/1: Tells OverView to delete a particular entity. If such an entity does not exist, nothing happens.
- Communication/2: Tells OverView that two entities have communicated (for example, via method invocation or message passing).
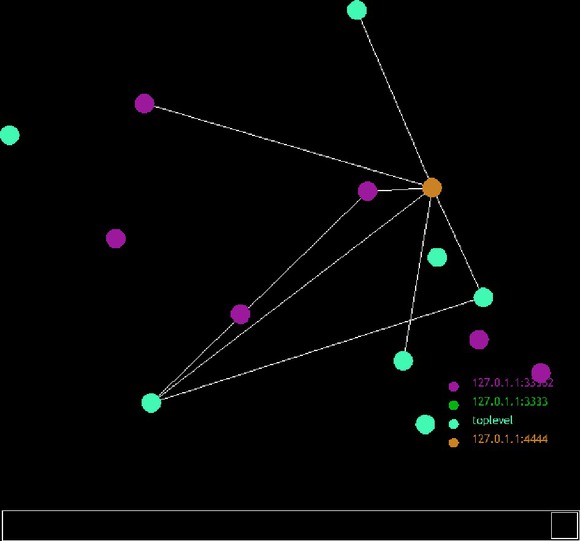 (a) Force-directed layout
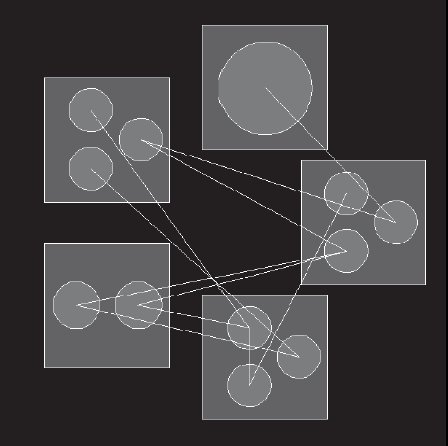 (b) Hierarchical concentric layout
A visualization module for OverView can be developed to suit the application to be visualized, since every OVP allows the connection of new modules that render information to the scientist or developer’s particular preferences. The approach involves to implement the Renderer interface provided by OverView which will allow to implement handle and unhandle methods, as well as processing’s draw method. RingVisualization.java which can be found in OverView’s website (http://wcl.cs.rpi.edu/overview) is a good example for the creation of visualization modules. There are currently two visuailzation models implemented in OverView:
The first module, called hierarchical concentric, is a visualization in which all top level entities and containers are arranged in a ring around the center of the screen, each scaling to fit if necessary (see Figure 2b). Those which are containers are differentiated from entities by being drawn as a square, rather than a circle; furthermore, any entities or containers it contains will be arranged in a circle within it. Upon communication a line is drawn between two communicating entities, disappearing momentarily. Following is a description of the actions triggered by each of the received events:
- Entity Creation: After a check for its existence an entity will be created only if it does not exist inside or outside a container.
- Entity Communication: A line is drawn between two entities that exist, the origin located on the message emitter and the destination on the message receiver.
- Entity Migration: Upon removal from its current location the entity will be created in another location. To represent this transition, the interface displays the entity as it moves along the interface from one location to its destination, this is represented through the use of animation easing.
- Entity Deletion: The entity is removed from the interface.
In force-directed visualization, entities and containers are distinguished through color-coding. While only entities are drawn, containers are distinguished by the entity’s color (see Figure 2a). A color convention is provided on the screen. Entities are not positionally constrained, they move depending on two external forces.
- Entity Creation: After a check for its existence an entity will be drawn in a color that depends on its container.
- Entity Communication: A line is drawn between two entities that exist, the origin located on the message emitter and the destination on the message receiver. This line represents the exertion of attraction force described in detail later.
- Entity Migration: Upon removal from its current location the entity will be created in another location. To represent this transition, the interface displays the entity as it changes it’s color to that assigned randomly at visualization initialization to its new container.
- Entity Deletion: The entity is removed from the interface along with it’s connections to other entities.
Entity Dynamics: There is a force of repulsion between entities. They repel each other following an inverse square rule, like Coulomb’s law for electrostatics, as follows:
 | (1) |
where r represents the distance between two given entities and K represents a repulsion coefficient. There is attraction between entities modeling communication as a force, rendering communicating entities as connected by a spring, which follows Hooke’s Law:
 | (2) |
where similarly, r represents the distance between two entities and  represents the attraction coefficient. The space through which they move provides a constant friction which acts as a damper. This results in a particle system that displays the entities in a co-location scheme influenced directly by communication between entities or lack thereof. For more information about force-directed graph drawing, we refer the reader to Herman et. al. [12] or Frutcherman and Reingold [11].
4 Visualizing Common Communication Patterns
In order to provide a general basis of comparison, a user can define his/her own clarity thresholds:
 provides a measure of efficient use of space can be proposed by setting a fixed communication/entity ratio and measure how many entities can be displayed without communications giving out false information. (e.g., communications between A and B passing through uninvolved entity C or a communication being crossed at more than 2 points):
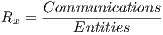
(3)
 represents the amount of points along a communication’s trajectory through which it is crossed by another:
(4)
 represents the amount of entities that are crossed over by a communication:
(5)
Force-directed visualization is also evaluated by measuring the amount of time it will take to reach a stable point, that is, when the velocity of the system is below an arbitrary value that tends to zero referred to as stability threshold which is determined in terms of (pixels/cycle). A cycle is measured to be  (using a 2000 cycle average measurement), the stability threshold was defined at
  pixels/cycle which is considered a system velocity low enough to allow for comprehensive reading of the visualization. This is done to measure the cost of increased clarity in those representations where force-directed visualization performs significantly better in terms of the clarity threshold.
Herein, we examine the performance of the hierarchic concentric and force-directed visualizations based on their meeting of the clarity thresholds in different communication/entity ratio settings, the latter provided by different topologies.
4.1 Linear and Grid-based Topologies:
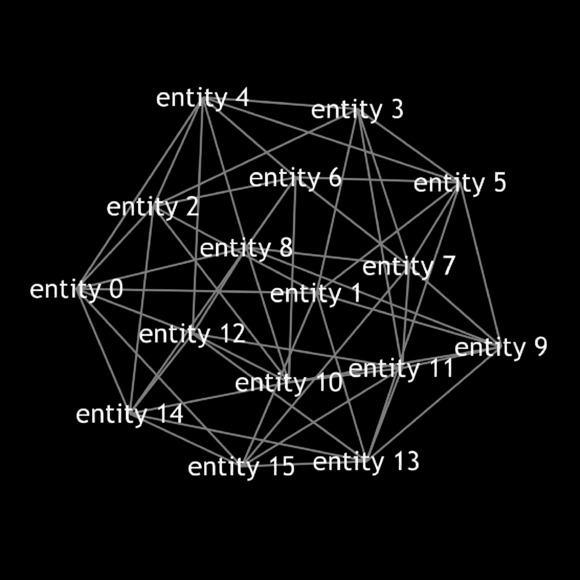
Linear and grid-based topologies are characterized by having a number of nodes set up in some  -dimensional lattice, with each node connected to and communicating with its neighbors. The most common class of programs that use such a structure are physical simulation programs, such as heat distribution or fluid dynamics applications, where each node represents an area in space (see Figure 3.)
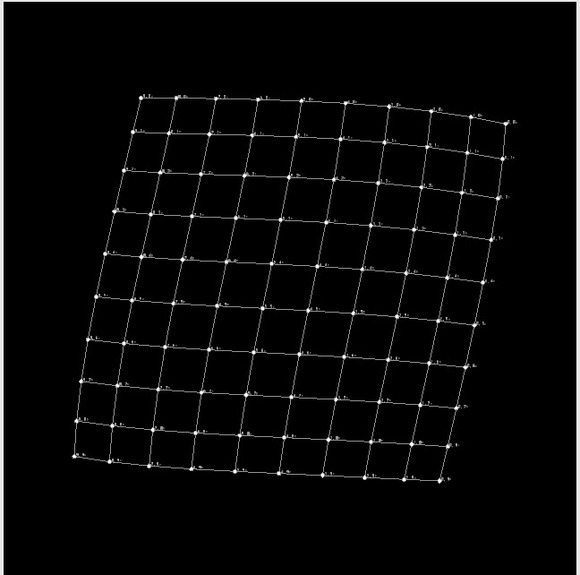 (a) Force-directed layout
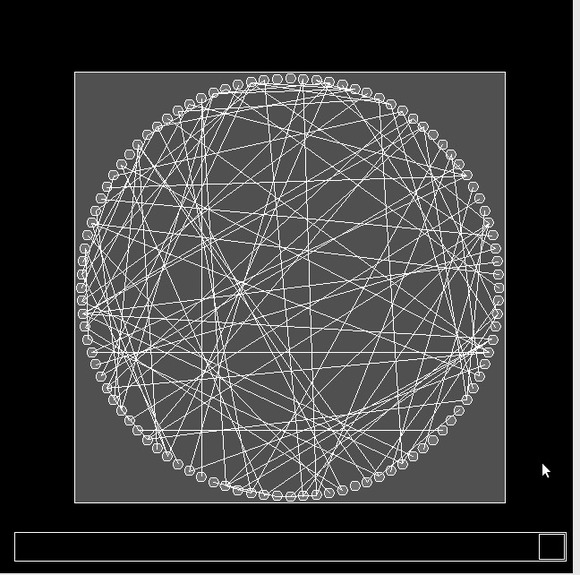 (b) Hierarchical concentric layout
Performance: Grids are better represented by force-directed visualizations because they do not display cluttered entities and the communication links are clear, the clarity threshold is met since there are no crossing lines or crossed entities. Hierarchic visualizations, highly dependent on the order of entity creation do not meet the clarity threshold. The stability threshold was reached by the force-directed approach in an average  seconds.
Ring-based topologies find a common application in peer-to-peer networks (see e.g., Figure 4.) Chord[24] increases the number of neighbor links from a constant number to a logarithmic number (based on the size of the network), which decreases the search time from linear to logarithmic as well; this makes it possible to construct robust and high-performance peer-to-peer networks (see Figure 5.).
 (a) Force-directed layout
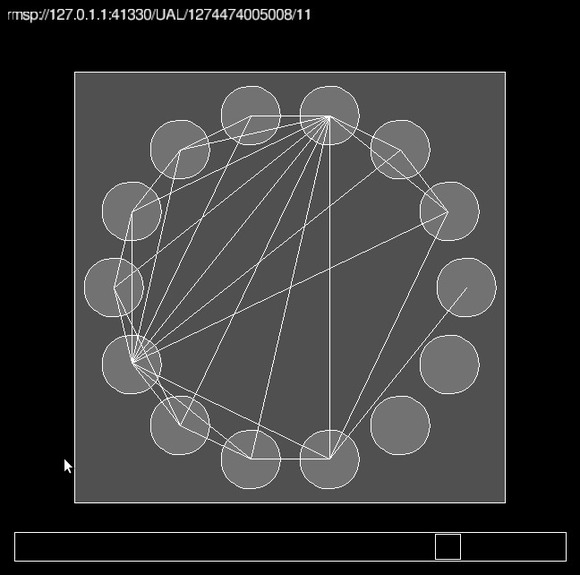 (b) Hierarchical concentric layout
Performance: Both models fail to meet the clarity threshold, however once the threshold is lowered, the first model to reach compliance of it, is the hierarchical concentric. The dense communication pattern for Chord is not efficiently viewed using force-directed approaches. The stability threshold is reached at an average  seconds.
 (a) A force-directed representation.
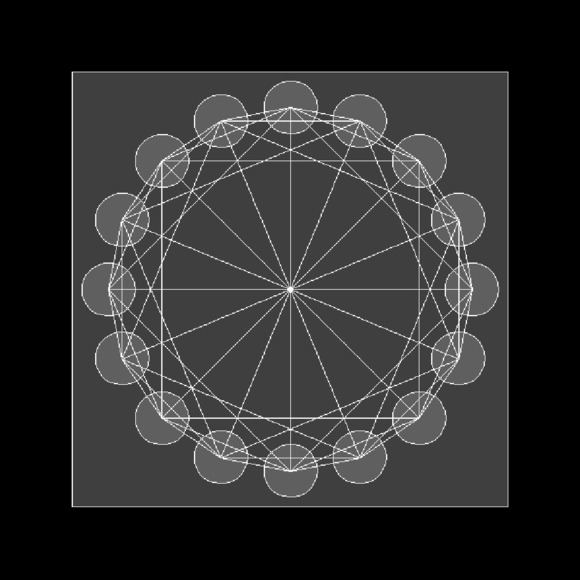 (b) A hierarchical concentric representation.
4.3 Cube and Hypercube-based Topologies
Cubes, hypercubes, and other  -dimensional cubes have a number of notable properties useful to distributed computation; among them is the upper bound on hops between any two nodes on the network, while maintaining only a small number of edges between nodes. Hypercubes are also notable for having a very structured high-dimensional organization, which is difficult to map to 2 or 3 dimensions well (see Figure 6.)
Performance: This topology does not meet the clarity threshold on either visualization, a less objective evaluation would imply that if the scale is small enough, a Force Directed approach could be intelligible. This topology lies beyond the scope of both visualizations.
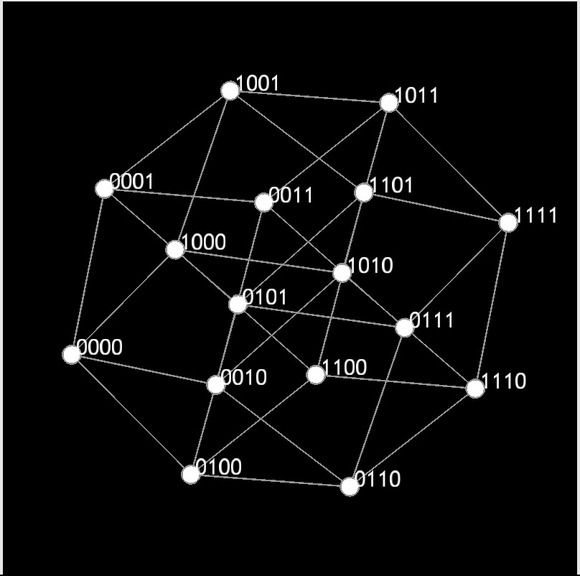 (a) A force-directed layout.
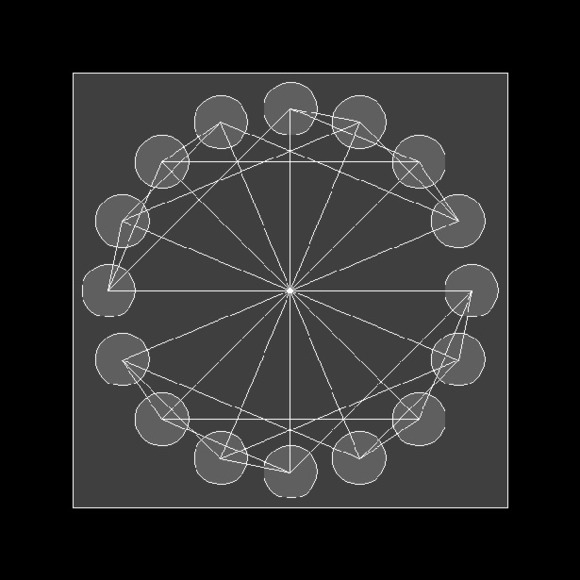 (b) A hierarchical concentric layout.
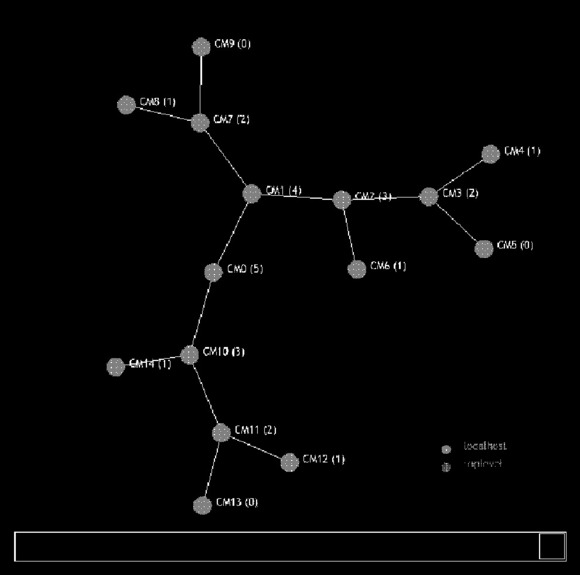
Recursive computation is as important in distributed computing as it is in sequential computing; many divide-and-conquer recursive algorithms can be made to run efficiently in a distributed setting (see Figure 7.)
Performance: When nodes are created with a particular ordering, the hierarchical concentric visualization meets the clarity threshold on binary trees which are common in recursive algorithms. A force directed approach does not rely on the order of creation to meet the clarity threshold, and allows to recognize the fractal nature of the calculation. No entity crossing or communication crossing occurs once the system is at a stable position. The stability threshold is reached at average in  seconds.
 (a) A force-directed layout.
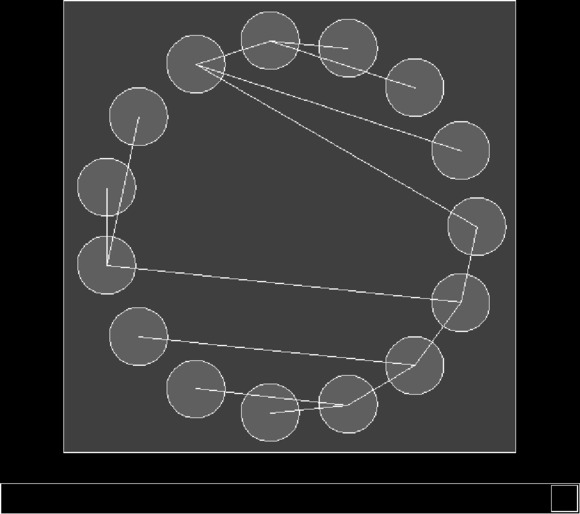 (b) A hierarchical concentric layout
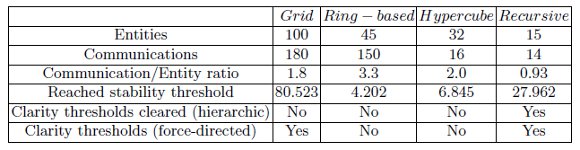
5 Discussion on Visualization Models
Figure 8 shows a table containing the data obtained for each of the topologies evaluated in Section 4.
5.1 Hierarchical Concentric Visualization
Hierarchical concentric places entities around a hierarchical series of rings. This placement mechanism was selected for several reasons: firstly, it minimizes ambiguous communications—that is, communication lines overlapping multiple entities, so one cannot determine at a glance which entities are referred to; this is a commonly-arising problem in grid-based visualizations, since many communications will either be purely horizontal or purely vertical and reach across entire rows or columns. Secondly, it can display a hierarchy of elements intuitively, even with naïve placement of new elements at the end of the list, allowing it to support recursive computations with reasonable effectiveness. This hierarchical, concentric structure is both intuitive and generic, mapping naturally both to flat systems (such as actors within theaters) and nested systems (such as mobile ambients).
Hierarchical concentric’s main drawback is in scalability. While it is effective for small numbers of entities, it rapidly breaks down and becomes confusing with as few as one hundred entities, with many communications filling the rings. Furthermore, logically grouped entities may be placed far from each other by the visualization, and since one cannot zoom in upon both sides of the ring at once, it can become difficult or impossible to understand what is occurring in parts of a system. However, despite these weaknesses, the visualization can be very effective for some application topologies, such as linear and circular topologies, as illustrated in Section 4.
5.2 Force-directed Visualization
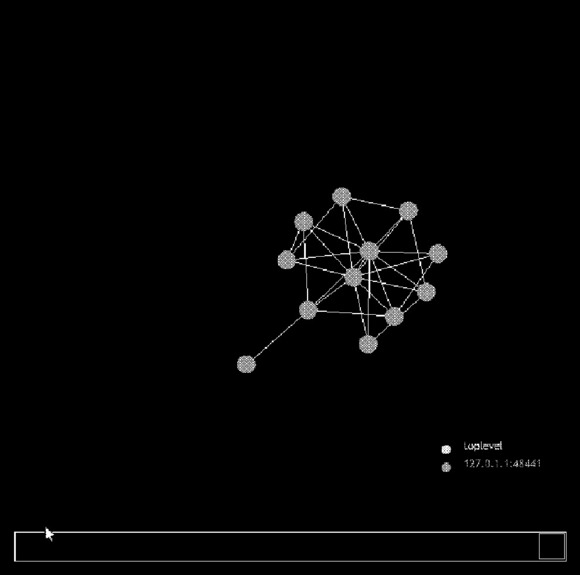
Force-directed visualization was primarily developed to remedy some of the shortcomings of hierarchical concentric. Unlike it, there is no hierarchical placement; entities are only placed upon the primary visualization surface. The only reference as to an entity’s belonging to a particular container is the color used to draw it. Furthermore, if like colors are well clustered, it provides good information on whether entities that communicate frequently are near each other physically, which is a very natural notion for the visualization to convey. An outlier to this affirmation is the case of farmer-worker topologies, where such information is not accurately conveyed since there is no communication between workers (see Figure 9a.) Given this scenario, a user can interact with the visualization by click-n-drag actions, allowing for manual configuration of entities. We note, however, that the force-directed layout provides a very intuitive visualization in most cases, especially in reference to the application communication topology.
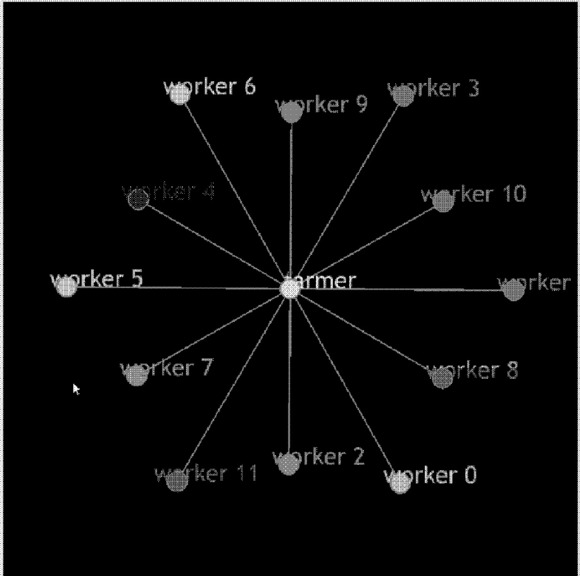 (a) Farmer-worker
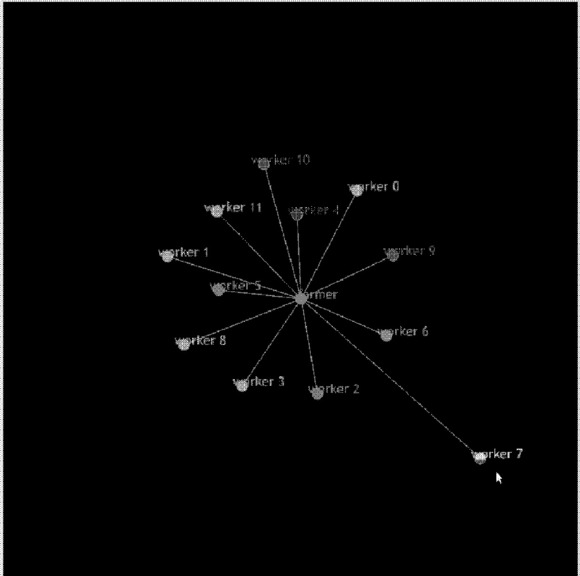 (b) User Modification of farmer-worker
The force-directed layout lacks support for nesting which is one of its most significant weaknesses, however it allows to visualize the appearance of clustering between entities that are tightly coupled in terms of communication which is a good indicator of proper application of load-balancing policies.
Our experiences with these visualizations indicate clearly and beyond a doubt that a modular approach to OverView is the correct choice, since different applications have different visualization needs. Furthermore, our experience developing these modules for OverView leads us to believe that a developer or scientist can better use a customized visualization module. This possibility of visualization renders the subjective nature of visualization clarity and effectiveness to a simple matter of instrumenting bytecode according to the events that are intended to be visualized and if the existing modules do not convey information in a satisfactory manner, the task of creating a visualization module is relatively simple.
OverView’s hierarchical concentric module provides a way to convey the nesting of entities in a clear fashion, finding its boundaries when communication patterns are dense. It approaches the issue by having the representation of a communication event fade over time, which could lead to misrepresented persistent links. The force-directed module focuses it’s attention on the communication topology of an application at a given point, which allows to evaluate the load balancing policies of adaptive middleware or the load balancing algorithms implemented within the application. An approach to migration representation is proposed within this module with the color coding of containers, however this technique is not as effective since there are topologies which do not present communication between co-located entities.
The powerful nature of OverView’s architecture is put to the test with the development of the force-directed approach that looked to the problem that rises from the hierarchical concentric module not conveying coupling. The combined usage of these two visualization modules provides the means for comprehensive evaluation of an application’s performance. Furthermore, it paves the way for more visualization modules to be developed in order to gain perspective on other particular characteristics of a distributed system.
The most obvious next step to take in the direction of distributed systems visualization using OverView is to produce modules that focus on other characteristics of distributed systems whose visualization could prove useful. For instance, a module that focuses on visualizing the different policies available in adaptive middleware to distribute autonomous actors. Such visualizations would permit users to fully comprehend the behavior induced by the policies selected for the system at hand (e.g. energy management, high performance, task management, etc.).
Extensive work on the matter has spawned a generation of middleware applications that specialize on load balancing[8] and the evaluation of such software is critical. Upon deployment of middleware, the task of load balancing the system becomes transparent to the developer, which in turn raises the question of whether the middleware selected as well as its policies are optimal given the application-level objectives.
Additional OverView visualization modules that can clearly separate physical-layer network aspects such as inter-processor latencies and bandwidths for particular clusters, from application-layer aspects would enable a better assessment of middleware resource management policies.
This work has been partially supported by the following grants: NSF CAREER CNS Award No. 0448407, IBM Innovation Awards.
1. D. P. Anderson, Boinc: a system for public-resource computing and storage, Proceedings of the Fifth IEEE/ACM International Workshop on Grid Computing., IEEE Computer Society, 2004, pp. 4–10.
2. David P. Anderson, Jeff Cobb, Eric Korpela, Matt Lebofsky, and Dan Werthimer, Seti@home: an experiment in public-resource computing, Commun. ACM 45 (2002), no. 11, 56–61.
3. Robert Bell, Allen D. Malony, and Sameer Shende, Paraprof: A portable, extensible, and scalable tool for parallel performance profile analysis., Proceedings of Euro-Par’03 Conference, 2003, pp. 17–26.
4. Bram Cohen, Incentives build robustness in BitTorrent, Tech. report, May 2003.
5. Nathan Cole, Travis Desell, Daniel Lombranaa Gonzalez, Francisco Fernandez de Vega, Malik Magdon-Ismail, Heidi Newberg, , Boleslaw K. Szymanski, and Carlos A. Varela, Parallel and computational intelligence, ch. Evolutionary Algorithms on Volunteer Computing Platforms: The MilkyWay@Home Project, pp. 64–90, Springer-Verlag Berlin Heidelberg, 2010.
6. Mariano P. Consens, Masum Z. Hasan, and Alberto O. Mendelzon, Using hy+ for network management and distributed debugging, CASCON ’93: Proceedings of the 1993 conference of the Centre for Advanced Studies on Collaborative research, IBM Press, 1993, pp. 450–471.
7. Travis Desell, H. Iyer, Abe Stephens, and Carlos A. Varela, OverView: A framework for generic online visualization of distributed systems, Proceedings of the European Joint Conferences on Theory and Practice of Software (ETAPS 2004), eclipse Technology eXchange (eTX) Workshop (Barcelona, Spain), March 2004.
8. Travis Desell, Kaoutar El Maghraoui, and Carlos A. Varela, Load balancing of autonomous actors over dynamic networks, Proceedings of the Hawaii International Conference on System Sciences, HICSS-37 Software Technology Track, January 2004, pp. 1–10.
9. Niels Drost, Rob V. van Nieuwpoort, Jason Maassen, Frank Seinstra, and Henri E. Bal, Jel: unified resource tracking for parallel and distributed applications, Concurrency and Computation: Practice and Experience (2010).
10. Yaniv Frishman and Ayellet Tal, Visualization of mobile object environments, SoftVis ’05: Proceedings of the 2005 ACM symposium on Software visualization (New York, NY, USA), ACM Press, 2005, pp. 145–154.
11. Thomas M. J. Fruchterman and Edward M. Reingold, Graph drawing by force-directed placement, 1991.
12. Ivan Herman, Guy Melançon, and M. Scott Marshall, Graph visualization and navigation in information visualization: A survey, IEEE Transactions on Visualization and Computer Graphics 6 (2000), 24–43.
13. R. Kalcklsch, Gossip-based diagnosis of arbitrary component-oriented systems, Ph.D. thesis, Technische Universitt Kaiserslautern, 2008.
14. Jacques Chassin de Kergommeaux and Benhur de Oliveira Stein, Pajé: An extensible environment for visualizing multi-threaded programs executions, Proceedings from the 6th International Euro-Par Conference on Parallel Processing (London, UK), Euro-Par ’00, Springer-Verlag, 2000, pp. 133–140.
15. Chee Wai Lee, C. Mendes, and L.V. Kale, Towards scalable performance analysis and visualization through data reduction, Parallel and Distributed Processing, 2008. IPDPS 2008. IEEE International Symposium on, april 2008, pp. 1 –8.
16. Peter Liggesmeyer, Jens Heidrich, Jrgen Mnch, Robert Kalcklsch, Henning Barthel, and Dirk Zeckzer, Visualization of software and systems as support mechanism for integrated software project control, Human-Computer Interaction. New Trends (Julie Jacko, ed.), Lecture Notes in Computer Science, vol. 5610, Springer Berlin / Heidelberg, 2009, pp. 846–855.
17. Jason Maassen and Henri E. Bal, Smartsockets: solving the connectivity problems in grid computing, Proceedings of the 16th international symposium on High performance distributed computing (New York, NY, USA), HPDC ’07, ACM, 2007, pp. 1–10.
18. Lucas Mello Schnorr, Arnaud Legrand, and Jean-Marc Vincent, Visualization and Detection of Resource Usage Anomalies in Large Scale Distributed Systems, Research Report RR-7438, INRIA, 10 2010.
19. W. E. Nagel, A. Arnold, M. Weber, H.-C. Hoppe, and K. Solchenbach, VAMPIR: Visualization and analysis of MPI resources, Supercomputer 12 (1996), no. 1, 69–80.
20. Wim De Pauw and John M. Vlissides, Visualizing object-oriented programs with jinsight, ECOOP ’98: Workshop ion on Object-Oriented Technology (London, UK), Springer-Verlag, 1998, pp. 541–542.
21. V. Pillet, J. Labarta, T. Cortes, and S. Girona, PARAVER: A Tool to Visualize and Analyze Parallel Code, Proceedings of WoTUG-18: Transputer and occam Developments (Patrick Nixon, ed.), mar 1995, pp. 17–31.
22. Lucas Mello Schnorr, Guillaume Huard, and Philippe O.A. Navaux, Triva: Interactive 3d visualization for performance analysis of parallel applications, Future Generation Computer Systems 26 (2010), no. 3, 348 – 358.
23. Frank J. Seinstra, Jason Maassen, Rob V. van Nieuwpoort, Niels Drost, Timo van Kessel, Ben van Werkhoven, Jacopo Urbani, Ceriel Jacobs, Thilo Kielmann, and Henri E. Bal, Jungle computing: Distributed supercomputing beyond clusters, grids, and clouds, Grids, Clouds and Virtualization (2010), to appear.
24. Ion Stoica, Robert Morris, David Karger, M. Frans Kaashoek, and Hari Balakrishnan, Chord: A scalable peer-to-peer lookup service for internet applications, Proceedings of the 2001 ACM SIGCOMM Conference, 2001, pp. 149–160.
25. James T. Streib and Takako Soma, Using contour diagrams and jive to illustrate object-oriented semantics in the java programming language, SIGCSE ’10: Proceedings of the 41st ACM technical symposium on Computer science education (New York, NY, USA), ACM, 2010, pp. 510–514.
26. Carlos A. Varela and Gul Agha, Programming dynamically reconfigurable open systems with SALSA, ACM SIGPLAN Notices. OOPSLA’2001 Intriguing Technology Track Proceedings 36 (2001), no. 12, 20–34.
27. Qin Wang, Wei Wang, Rhodes Brown, Karel Driesen, Bruno Dufour, Laurie Hendren, and Clark Verbrugge, Evolve: an open extensible software visualization framework, SoftVis ’03: Proceedings of the 2003 ACM symposium on Software visualization (New York, NY, USA), ACM Press, 2003, pp. 37–ff.
28. James M. Wilson, Gantt charts: A centenary appreciation, European Journal of Operational Research 149 (2003), no. 2, 430–437.
29. Omer Zaki, Ewing Lusk, William Gropp, and Deborah Swider, Toward scalable performance visualization with jumpshot, Int. J. High Perform. Comput. Appl. 13 (1999), 277–288.

