Inglés (pdf)
 Articulo en XML
 Referencias del artículo

 Permalink
1. Introduction
Honey is a naturally sweet beehive product with several nutritional and therapeutic virtues1. Known as a functional food, it is especially popular among the elderly during the winter2. Honey can come from the nectar and pollen of a single plant (monofloral honey) or of several plants (polyfloral honey). Several factors such as geographical conditions and climate can have an effect on its composition3. Its consumption varies from one country to another; in Algeria, honey consumption is of 0.200 kg per year and per inhabitant, were a third of consumers buy imported honey4. Among the locally produced honey, Jujube and Eucalyptus honey predominate. This consumption is influenced by the eating habits and culture of individuals3.
The motivations of individuals to consume honey or any other food are linked to several factors, including their behavior. According to Hossain and others5, eating behavior refers to the way of eating; this includes, in particular, consumers’ habits towards food. It involves the choice and reason for choosing the food, as well as the timing of meals and the quantities ingested; the emotional aspect has also been included in this description. The most common determinants of eating behavior are the physical and psychological aspects, the environment, the financial level, marketing, and the social and cultural environment6. According to the research conducted by Kleisiari and others7 and Mascarello and others8, it was deduced that the motivation to consume honey was for health reasons. It has also been shown that occasional consumption of honey in winter can be considered as a medicinal beverage 9)(10) . Other studies have asserted that the motivation for consuming honey is linked to nutritional value and health benefits 11)(12) . Other individuals have other motivations for consuming honey, like culinary habits. This type of consumption motivation suggests that the concerned people want to combine the sweet aspects of honey with healthy considerations13. For example, many Poles introduce honey into their culinary preparations2. On the other hand, other motivations for consuming honey remain; for example, Hungarians attach particular importance to the origin of the honey9. This type of motivation automatically refers to places of purchase that evoke a certain quality assurance for the consumer 10)(14) . On the other hand, Italian consumers pay more attention to honey purchasing quantity as long as it does not exceed 500 g15.
Understanding the factors that influence consumer food choices is critical to improving public health, reducing food waste, and aligning supply with demand. In this context, machine learning (ML) has emerged as a valuable tool for exploring complex, multivariate relationships in consumer behavior data. ML techniques, particularly decision-tree-based algorithms like Classification and Regression Tree (CART), have demonstrated effectiveness in modeling consumer preferences, predicting purchasing behavior, and segmenting populations based on shared attributes16.
In the agri-food sector, ML techniques are increasingly applied to optimize product formulation, ensure quality control 17)(18) , and support precision nutrition strategies, including the prediction of egg quality 19)(20) and the diagnosis of diet-related disorders16. However, despite honey’s recognized nutritional, therapeutic, and cultural roles, few studies have addressed consumer motivations for honey consumption using ML-based predictive modeling, revealing a significant gap in the literature.
Alongside ML, multivariate statistical methods, such as Multiple Correspondence Analysis, offer complementary insights by revealing patterns in qualitative survey data. MCA has been successfully applied to identify consumer segments and motivations in diverse food-related contexts 21)(22)23)(24) .
In response to this identified gap, this study proposes a hybrid analytical framework, integrating Multiple Correspondence Analysis with Classification and Regression Tree to model the underlying motivations for honey consumption. Specifically, this study seeks to:
2. Materials and Methods
2.1 Survey Design and Data Collection
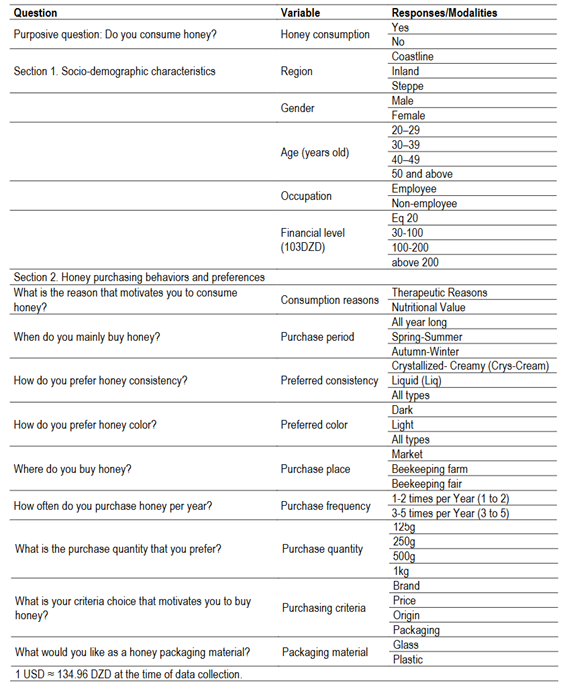
The present investigation draws on a structured questionnaire survey designed to assess honey consumption behaviors and preferences among 303 individuals in northwestern Algeria, all of whom self-identified as honey consumers. The questionnaire consisted exclusively of close-ended questions and was divided into two main sections: (1) socio-demographic characteristics of the respondents, and (2) variables related to purchasing habits, sensory preferences, and motivational drivers for honey consumption. Thirteen categorical variables were ultimately retained for statistical analysis. A comprehensive list of these variables and their respective categories is presented in Table S1 (in Supplementary Material).
The questionnaire was administered online via Google Forms, and a snowball sampling technique was used to reach a diverse population of consumers, following the approach of Mascarello and others8.
Although the sample size was not calculated through probabilistic formulas, a total of 303 respondents were deemed sufficient to ensure category saturation and the stability of multivariate analyses. This sample size aligns with recent consumer studies using MCA methodology with comparable or smaller samples25.
2.2 Data Preprocessing and Variable Selection
Before statistical modeling, the dataset was subjected to a thorough preprocessing phase. Frequency distributions were examined for all categorical variables, and rare categories were merged when appropriate to prevent over fragmentation and to enhance analytical robustness.
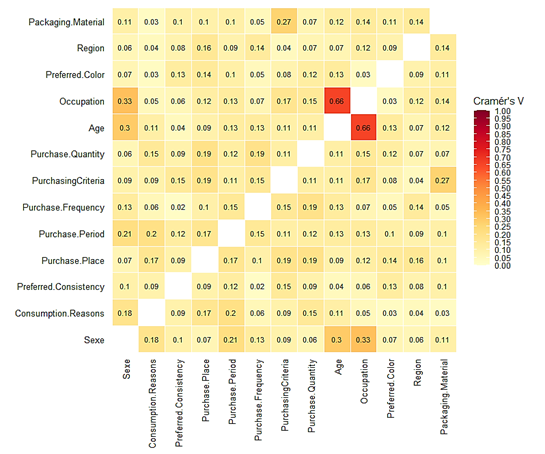
To assess the strength of association between the explanatory variables and the dependent variable Consumption Reasons, both Pearson’s Chi-square (χ²) tests and Cramér’s V coefficients were computed. The Chi-square statistic was calculated using the formula:
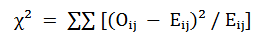
Where Oij and Eij are the observed and expected frequencies for each cell i, j in the contingency table of size r × c, under the assumption of independence.
To standardize the strength of association and enable comparison across variables, Cramér’s V was computed as follows:

Where n is the total sample size, and r and c are the number of rows and columns in the contingency table, respectively.
Cramér’s V ranges from 0 (no association) to 1 (perfect association), and is particularly suitable for assessing relationships among categorical variables with unequal dimensions. Only variables with Cramér’s V greater than 0.14 were retained for multivariate analysis, consistent with Cohen’s26 benchmark for moderate effect size. However, the variable honey texture (V = 0.09), though below this threshold, was also retained due to its strong behavioral relevance and its key role in sensory differentiation. This selective inclusion aimed to balance statistical robustness with substantive interpretability.
2.3 Multiple Correspondence Analysis and Consumer Segmentation (HCPC)
A Multiple Correspondence Analysis (MCA) was conducted using the Factoshiny interface from the FactoMineR package in R. This environment also enabled subsequent segmentation via Hierarchical Clustering on Principal Components (HCPC), a method that integrates factorial coordinates with agglomerative clustering to enhance consumer profiling. The MCA served to reduce the dimensionality of the categorical dataset and uncover latent behavioral structures underlying consumer preferences.
The individual coordinates derived from the MCA were used as inputs for a hierarchical clustering procedure based on Ward’s criterion and Euclidean distance, as implemented in the HCPC algorithm. The optimal number of clusters was determined by examining dendrogram cohesion and interpretability. Resulting consumer segments were interpreted using the most discriminating modalities, identified through v-test values (v ≥ 2), class/mod and mod/class ratios, and their relative contributions. This segmentation strategy aligns with methodological recommendations by Ćirić and others27 and Ignjatijević and others28, who demonstrated the robustness of multivariate approaches for identifying heterogeneous consumer profiles in local food markets.
2.4 Predictive Modeling Using CART
A Classification and Regression Tree (CART) model was implemented to predict the categorical target variable “Consumption Reasons”. The model construction followed a supervised learning framework, where the recursive binary partitioning of the input space was based on the hyperbolic tangent impurity function. To mitigate overfitting and enhance generalization, a ten-fold cross-validation strategy was applied. The maximum tree depth was constrained to five levels, while the minimum sample sizes required were set to 30 observations for parent nodes and 15 for child nodes, ensuring sufficient statistical power at each split. Six categorical predictors: Sex, Favorite Consistency, Purchase Place, Purchase Period, Purchase Quantity, and Purchasing Criteria were selected based on prior bivariate association metrics (Cramér’s V and χ² test). These variables were introduced into the model without transformation, allowing CART to capture non-linear and high-order interaction effects. The resulting tree structure enabled the identification of the most discriminative variables and provided interpretable decision paths that partitioned consumer profiles according to their underlying motivations for honey consumption.
2.5 Model Evaluation Metrics
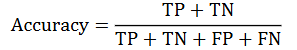
To assess the predictive performance of the Classification and Regression Tree (CART) algorithm, standard classification metrics were computed based on the confusion matrix. Let TP, TN, FP, and FN denote the number of true positives, true negatives, false positives, and false negatives, respectively.
The accuracy is defined as the proportion of correctly classified instances:
The sensitivity or recall measures the model’s ability to identify positive instances:
The precision quantifies the proportion of correctly predicted positive instances among all positive predictions:
To provide a balanced evaluation of precision and recall, the F1-score was computed as the harmonic mean of both metrics:
3. Results and Discussion
3.1 Socio-Demographic Profile of Honey Consumers
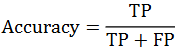
The variables selected with Cramér’s V are presented in Figure S1 (in Supplementary Material) and the socio-demographic profile of respondents is shown in Figure 1. The survey revealed a predominance of female respondents (64.7%) compared to males (35.3%). This gender imbalance is consistent with earlier findings in the honey consumption literature 7)(29) , which often attribute higher female participation to their more active role in household food purchasing and their greater engagement with food quality considerations. Cultural patterns in northwestern Algeria, where women are frequently responsible for family food provisioning, may also explain this over representation.
Age distribution was markedly skewed toward younger adults, with the 20-29 age group comprising over two-thirds of the sample (71.9%), followed by 30-39 years (16.8%), 40-49 years (7.3%), and 50 years or older (4.0%). The dominance of younger cohorts can partly be explained by the online mode of survey administration, which inherently favors digitally having and literate populations. This trend is in line with observations in similar online consumer studies conducted in emerging economies, where younger age groups display greater responsiveness due to higher internet penetration and familiarity with digital tools. Also, this result can be explained by the attachment of this study with higher education activity. The emergence of the new lifestyle that balanced between health and dietary habits is influenced essentially by age cohort30. Young generation is more preoccupied by its appearance, body weight and health.
Regarding occupational status, non-employed individuals (55.8%) outnumbered employed respondents (44.2%). The non-employed category was largely composed of university students, who were the main contributors to this higher education study -a segment known for its digital literacy and readiness to participate in online research. This may have influenced the sample’s age structure and contributed to the prominence of younger respondents.
Knowing that the national minimum wage is 20,000 DZD per month, household income levels showed that the largest proportion of respondents (48.2%) earned less than 20,000 DZD per month, followed by those earning between 30,000 and 100,000 DZD (33.7%). Only a small minority (16.2%) reported earnings above 100,000 DZD, with high-income respondents concentrated in coastal urban areas. The clear concentration of lower- to middle-income groups suggests that honey purchasing behaviors in the region are shaped by price sensitivity, as supported by prior studies linking disposable income to consumption limitation 31)(32) . On the other hand, Ribeiro and others 33) have proved that people who earn more income purchase more honey and, on the opposite, those who perceive less income buy less honey.
Overall, the socio-demographic profile suggests that honey consumption in northwestern Algeria is influenced not only by cultural and gender roles but also by generational and economic factors. The dominance of younger, digitally active respondents reflects the methodological choice of online sampling, while income disparities point to the relevance of price and affordability in shaping consumption patterns.
3.2 Consumer Preferences and Purchasing Behavior
Purchasing habits and consumption patterns are depicted in Figure 2. Analysis of preference attributes revealed a notable inclination toward liquid honey (45.2%), followed by a general openness to all types (38.0%), while crystallized honey was less favored (16.8%). This hierarchy reflects a sensory-driven preference pattern commonly observed in Slovakia, where consumers prefer liquid honey because of freshness aspect and easy manipulation22. Generally, liquid honey is perceived and often associated with freshness and premium quality by consumers. In terms of purchasing channels, direct procurement from beekeeping farms dominated (56.1%), surpassing purchases from markets (31.4%) and beekeeping fairs (10.9%). This pattern underscores the role of short supply chains in fostering consumer trust and reinforcing perceptions of authenticity, particularly for products with health-related reputations such as honey34.
Seasonal trends in consumption showed that the majority of respondents reported purchasing honey year-round (51.5%), while winter (18.5%) and summer-autumn (17.2%) purchases were secondary. According to Oliveira Neto and others35, purchasing honey takes place mainly all-year round, followed by summer and rainy season. However, this present study showed that spring purchases were minimal (12.9%), indicating that honey in the surveyed Algerian region is perceived less as a seasonal indulgence and more as a staple product with sustained demand across the year. This perception is further reflected in purchasing frequency, where 70.6% of respondents reported acquiring honey one to two times per year, compared to 29.4% purchasing three to five times annually, suggesting a balance between occasional and habitual consumption patterns.
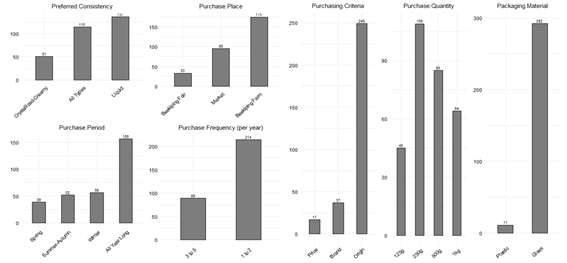
Regarding purchasing criteria, origin emerged as the primary determinant in honey purchasing decisions (82.2%), far surpassing brand (12.2%) and price (5.6%). This finding underscores the central role of provenance as a proxy for both quality and authenticity within local markets. Similarly, Oravecz and Kovacs9 showed the particular importance attach to honey origin made by consumers of Hungary. Purchase volumes were predominantly concentrated in smaller packaging formats, 250 g (36.0%) and 125 g (33.9%), while larger units such as 1 kg (21.1%) were less frequently chosen, a pattern likely influenced by budgetary constraints and storage or consumption practices in smaller households. These quantities are less than those preferred by Romanian honey buyers, who choose quantities of more than 1 kg36. Glass was by far the most preferred packaging material (96.4%), with plastic accounting for only 3.6%, reflecting consumer perceptions of honey as a premium, natural product best preserved in inert, non-reactive containers.
3.3 Latent Dimensions and Hierarchical Consumer Profiling
The first latent dimension, which explains 11.12% of the total variance, appears to structure consumer behavior around two contrasting motivations and purchasing logics (Figure 3). On the positive side of this axis, the modality “Market” shows the highest contribution (16.38%) and a strong coordinate (0.933), indicating that this purchasing channel plays a central role in the construction of Axis 1. Closely associated with this are the modalities “Nutritional Value” and “Male,” both of which are positively projected and show high v-test values (9.28 and 2.21, respectively). These results suggest that this side of the axis reflects a profile of male consumers who tend to purchase honey primarily for nutritional properties and through conventional retail outlets, such as markets. This consumption pattern may reflect a functional, diet-integrated use of honey, with less emphasis on traditional or therapeutic meanings. Similar findings have been reported in various European contexts, where male consumers with routine-oriented behaviors tend to prefer honey for nutritional integration rather than traditional or symbolic reasons. This functional and utilitarian logic has also been observed by Zanchini and others30, who found that male consumers are often driven by nutritional efficiency and purchase convenience rather than origin or cultural significance.
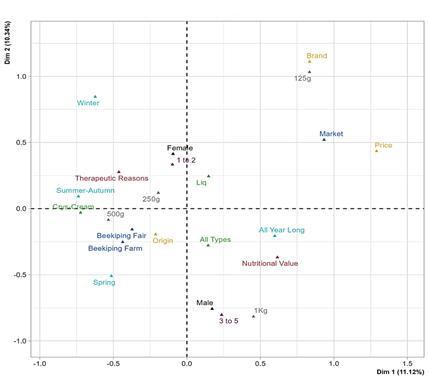
Conversely, the negative side of Axis 1 is characterized by modalities such as “Therapeutic Reasons,” “Beekeeping Fair,” and “Beekeeping Farm,” which all display strong negative coordinates and substantial contributions. These modalities are also associated with the female modality, which, although less strongly projected, aligns more with this traditional cluster. The presence of therapeutic motivations and direct or artisanal purchasing channels (e.g., fairs and farms) suggests that this pole represents a consumption style rooted in health beliefs, natural product trust, and traditional knowledge12. Several studies have emphasized the trust placed in origin, health benefits, and direct producer relationships by female consumers, especially when therapeutic motives are involved. This therapeutic-traditional orientation has been widely documented in the literature. Schifani and others37 showed that Italian consumers tend to buy local honey because of its quality and safety. Similarly, Sama and others38 found that trust in the source and natural authenticity are key drivers for consumers, with Spanish women constituting the cluster most concerned about fair-trade honey. Moreover, the authors emphasized that women are more likely to associate honey with symbolic, traditional, and emotional values rather than with functional properties alone, while women in Poland consume honey for dietary purposes34.
The second axis, which accounts for 9.5% of the total variance, introduces an additional layer of differentiation, mostly structured around gender and purchasing behavior. Male respondents are positioned on the negative side (coord. -0.758, cos² = 0.313), while females are projected on the positive side (coord. +0.414, cos² = 0.313). In addition, the “Market” modality is positively associated with this axis (coord. +0.520, v-test = +6.10) as does “Liquid Honey” (coord. +0.245, v-test = +3.87), indicating a tendency among female consumers to purchase liquid honey from markets. Conversely, texture modalities such as “Cry-Cream” and “All Types” contribute weakly to this dimension. Altogether, Axis 2 expresses a subtle differentiation where female consumers associate honey with liquid form and market acquisition, while male respondents cluster on the opposite side, without a specific texture or channel preference. These gender-based preferences have been observed by Šedík and others22, who reported that Slovaks tend to prefer liquid honey for its sensory clarity and health connotations. It is essential to note that product appeal plays a prominent role among female consumers around the world. This dual structuring by gender and sensory expectations confirms that honey is not only a nutritional good but also a culturally shaped product, where form and meaning intersect.
Taken together, Axes 1 and 2 offer a coherent and multidimensional framework for interpreting consumer segmentation in honey consumption. The first dimension captures a motivational and symbolic contrast between, on the one hand, consumers oriented toward therapeutic use and favoring artisanal purchase channels, such as beekeeping fairs and farms -often associated with female respondents-, and, on the other hand, those who value honey primarily for its nutritional properties and tend to acquire it through conventional markets, a profile more closely associated with male respondents. The second axis further refines this structure by introducing a gender-based and behavioral differentiation: female consumers are positively aligned with liquid honey and market-based acquisition, while male respondents are projected negatively and do not exhibit strong associations with specific textures or channels. Together, these two axes define a representational space gender, motivation, and purchasing behavior intersect. This factorial structure offers a robust basis for subsequent segmentation via clustering and predictive modeling (e.g., CART). This integrative perspective is supported by the findings of Cosmina and others39 and Sparacino and others40, who documented multidimensional representations of honey consumption across Italy. According to Cosmina and others39, motivations and channels of acquisition consistently emerged as powerful predictors of behavioral segmentation. However, Sparacino and others40 describe four clusters according to motivations and preferences, defined by healthy consumer, sustainable consumer, organic consumer and quality-sensitive consumer.
Hierarchical clustering performed on the principal components derived from the multiple correspondence analysis revealed three distinct consumer profiles based on preferences and behaviors toward honey consumption (Figure 4). Each cluster was interpreted using the most discriminating modalities (v-test ≥ |2|), supported by class-specific frequencies and global modality distributions. This segmentation structure confirms the multidimensional consumer landscape previously highlighted by the MCA.
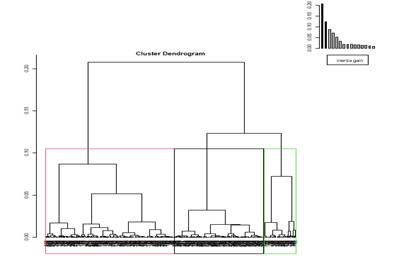
The first cluster is primarily characterized by a therapeutic motivation for consuming honey. This reason is highly overrepresented (v-test = 9.99), with 80.3% of individuals in this group citing it as their main motive, accounting for 81.8% of all respondents selecting this modality. These consumers also reported purchasing honey predominantly during the winter season, suggesting a seasonal or symptom-driven consumption pattern. The purchase location is mainly the beekeeping fair, with a strikingly high class/model association (93.9%), pointing toward reliance on specialized apicultural events rather than conventional retail channels. This cluster is also predominantly female, prefers creamy or crystallized textures, and exhibits a low purchase frequency (once or twice per year). The origin of the product is a key purchasing criterion, highlighting a strong attachment to authenticity and possibly to artisanal or local production. Collectively, this cluster can be interpreted as a health-conscious and tradition-oriented segment, where therapeutic value, provenance, and trust in the source guide purchasing decisions. This traditional, health-conscious profile has been widely documented, particularly in studies showing trust in local products and ethnocentric tendencies41. In fact, consumers who tend to buy directly from producers and are highly sensitive to product origin need to have a quality assurance 10)(14) . Similarly, Pocol and Teselios42 in Romania highlighted the importance of provenance and health values.
The second cluster reflects a more functionally oriented consumer profile, with nutritional benefits identified as the primary consumption driver (v-test = 7.95). These individuals consume honey throughout the year (v-test = 7.57), indicating its integration into daily dietary habits. The cluster is predominantly male, with a tolerance or preference for all types of textures (v-test = 5.76), and tends to purchase moderate quantities (1 kg) at a moderate frequency (three to five times per year). Although the origin of the honey remains an important selection criterion (v-test = 4.86), the emphasis appears more pragmatic than cultural. The market place is the primary purchase location, consistent with behavior that values convenience and accessibility. Altogether, this cluster represents a group of rational and regular consumers, driven by nutritional considerations rather than emotional or symbolic attachments. This pattern aligns with studies from Poland and Hungary describing daily or functional users who integrate honey into their regular diets34. This segment aligns with the findings of Oliveira Neto and others35, who showed that male consumers in Brazil incorporate honey regularly as part of dietary routines. Oliveira Neto and others35 also report that frequency and volume of honey purchase increase with functional use, particularly when the motivation is dietary rather than therapeutic. Moreover, Šedík and others12 found that Slovak adults over the age of 51 showed strong preferences for practicality and regular intake, often without symbolic or seasonal anchoring.
The third cluster is driven primarily by economic and branding considerations. Here, price is the most dominant purchasing criterion (v-test = 7.28), with over 82% of individuals selecting it, followed by brand (v-test = 6.18). These consumers are frequent buyers in local markets, like Cluster 2, but they stand apart due to their preference for very small quantities (125 g) (v-test = 3.87), suggesting limited or opportunistic consumption. Although nutritional motivation is present, it is only weakly represented in this group (v-test = 3.66). Preferences include liquid texture (v-test = 3.39) and non-seasonal purchasing patterns, but without the structural consistency observed in Cluster 2. This group can be interpreted as a price-sensitive and brand-aware segment, likely influenced by promotional offers or affordability, with less emphasis on intrinsic product quality or origin. A similar price- and convenience-driven segment was found by Batt and Liu43, who showed that price and branding are key drivers for purchasing honey.
Overall, these three profiles illustrate the heterogeneity of honey consumption behavior. The contrast between the clusters reveals multiple consumer logics: a preventive health and tradition-based approach (Cluster 1), a routine and nutrition-driven behavior (Cluster 2), and a cost-conscious and brand-influenced strategy (Cluster 3). Interestingly, while origin as a criterion emerges in Clusters 1 and 2, it is almost absent in Cluster 3, highlighting differentiated expectations across the market segments. This layered segmentation is consistent with the work by Ignjatijević and others28, who confirm that motivations vary along lines of health and routine. Studies such as that by Cosmina and others39 and further emphasize that perceived product quality, including origin, is unequally valued across segments, reinforcing the multidimensionality revealed here.
The segmentation offers actionable insights for stakeholders in the honey sector. From a marketing perspective, Cluster 1 consumers could be targeted with messages emphasizing therapeutic properties, natural origin, and traditional beekeeping practices, ideally through specialized fairs or local networks. Cluster 2 would respond better to campaigns highlighting nutritional value, reliability, and product availability, with a strong presence in conventional retail channels. Cluster 3, in contrast, would require competitive pricing, smaller package sizes, and strong brand visibility to foster engagement and loyalty. Such differentiated targeting strategies echo recommendations by Blanc and others44, who advocate for segmentation-based marketing to enhance product appeal. Kehagia and others45 further highlight the importance of labeling and traceability cues, while Popescu and Guresoaie36 suggest promotional tactics for Romanian honey.
From a public health and policy perspective, targeted education could help price-sensitive consumers (Cluster 3) recognize the nutritional and health benefits of honey, reducing reliance on price as the sole decision factor. Strengthening quality labels (e.g., origin-certified, organic) could also increase consumer trust across all profiles, especially for Clusters 1 and 2. This aligns with policy-focused findings by Pocol and Bolboacă46 and Ignjatijević and others28, who argue that well-designed food education can shift consumer choices toward health-promoting products, even among economically constrained populations.
The combination of MCA and hierarchical clustering proved to be effective for identifying latent behavioral structures, even in the context of purely categorical survey data. Despite modest bivariate associations, this approach revealed meaningful and actionable consumer typologies that contribute to a deeper understanding of honey purchasing behavior and its determinants.
3.4 CART-Derived Classification
Beyond global classification accuracy, additional performance metrics were derived from the confusion matrix to provide a more nuanced assessment of the CART model’s predictive capability (Table 1). The overall accuracy reached 67.3%, with the model correctly classifying 204 out of 303 participants. For the Nutritional Value group, the model achieved a recall (sensitivity) of 69.2%, indicating that it was able to identify the majority of participants motivated by nutritional reasons. However, precision for this class was moderate (60.4%), suggesting some degree of misclassification with respondents actually motivated by therapeutic reasons. The corresponding F1-score was 0.645, reflecting a balanced trade-off between precision and recall.
Table 1: CART model performance metrics
| Metric | Nutritional value | Therapeutic reason | Overall |
| True positives (TP) | 90 | 114 | |
| False positives (FP) | 59 | 40 | |
| False negatives (FN) | 40 | 59 | |
| Precision (%) | 60.4 | 74.0 | |
| Recall/Sensitivity (%) | 69.2 | 65.9 | |
| F1-score | 0.645 | 0.697 | |
| Accuracy | - | - | 67.3 |
| Resubstitution error rate | - | - | 0.327± 0.027 |
| Cross-validated error rate | - | - | 0.376 ± 0.028 |
For the Therapeutic reason category, the model demonstrated slightly lower recall (65.9%) but higher precision (74.0%), indicating more reliable identification of respondents in this group. The F1-score for this class was 0.697, highlighting the model's relatively stronger discriminative power for therapeutic motivations. These results suggest that while the tree-based model provides interpretable decision rules, consumer motivations for honey consumption are complex and partly overlapping, which may explain the moderate precision-recall trade-offs. Future improvements may involve testing ensemble classifiers or integrating fuzzy logic to better accommodate ambiguity in consumer preferences. These results align with those reported by Purnomo and others47, who applied a CART model in Indonesia to predict honey purchasing frequency in West Java based on demographic characteristics. Their model, which achieved an accuracy of 70.3%, identified health-related motivations as the most influential predictors of consumer behavior. By capturing context-specific patterns within the Indonesian market, their findings further illustrate the capacity of decision tree algorithms to disentangle complex and culturally embedded consumption dynamics. This convergence underscores the methodological robustness and cross-cultural relevance of CART models in exploring multidimensional consumer motivations.
3.5 CART-Based Consumer Segmentation
The CART analysis, applied to classify honey consumption motivations, revealed a well-structured decision hierarchy based on behavioral and preference-related variables (Figure 5). The root node included the full sample of 303 individuals, 42.9% of whom reported consuming honey for nutritional purposes and 57.1% for therapeutic reasons, suggesting a slight predominance of health-oriented motivations.
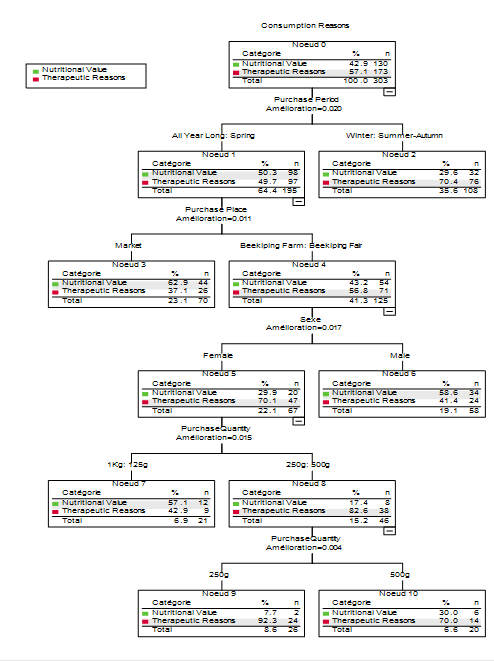
The first and most discriminative split in the tree was based on the purchase period. Consumers who reported purchasing honey throughout the year or during the spring (Node 1) displayed a nearly balanced distribution of motivations, with 49.7% citing nutritional reasons and 50.3% therapeutic ones. In contrast, those who purchased mainly in winter and autumn (Node 2) were predominantly motivated by therapeutic purposes, representing 70.4% of that subgroup. This seasonal differentiation may reflect an increased focus on health-related uses of honey during colder months, a phenomenon also observed by Ribeiro and others33, who highlighted seasonal consumption spikes due to perceived medicinal benefits.
Within the “all year long/spring” segment, a subsequent division based on purchase location further refined consumer profiles. Those who purchased honey at markets (Node 3) were predominantly nutritionally motivated (62.9%), whereas individuals who sourced honey directly from beekeeping farms or fairs (Node 4) leaned toward therapeutic motivations (56.8%). This distinction is aligned with previous studies that emphasized that consumers who prefer artisanal local foods often associate honey with quality and safety linked to social and environmental product aspect37. It means that local honey rhymes with health, tradition, and authenticity.
Node 4 is further divided based on gender. Among these consumers, women (Node 5) were predominantly driven by therapeutic motivations (70.1%), whereas men (Node 6) showed a slightly higher inclination toward nutritional consumption, with 58.6% citing this reason. This gender-based segmentation is consistent with earlier observations indicating that women often attribute greater medicinal and symbolic value to honey, while men show a functional and dietary orientation33.
Among female consumers (Node 6), the next discriminating factor was the quantity of honey typically purchased. Node 7 includes individuals buying both small (125 g) and large (1 kg) quantities, indicating a heterogeneous consumption profile. Within this group, motivations are relatively balanced, with 57.1% citing nutritional reasons and 42.9% citing therapeutic reasons. In contrast, Node 8 encompasses consumers purchasing mid-sized quantities (250 g to 500 g), among whom therapeutic motivations clearly predominate: 82.6% report consuming honey for therapeutic reasons. This pattern confirms some studies that suggest that purchasing behaviors such as quantity 33) or both quantity and packaging are strongly correlated with perceived use27.
A finer split of Node 8 reveals two subgroups. Node 9, composed of consumers purchasing exactly 250 g, exhibits a remarkably skewed distribution: 92.3% report therapeutic motivations. Node 10, representing consumers of 500 g, shows a slightly more diversified profile, with 70.0% citing therapeutic motivations and 30.0% nutritional ones. These observations support conclusions by Bimbo and others15, who emphasized that mid-sized purchases are typically associated with purchasing honey. This purchasing mode is linked with occasional or need-based consumption, often driven by therapeutic or traditional motives.
Despite not being selected as a main node in the CART output, honey texture may still influence consumer preferences in interaction with other variables. This could be further explored using interaction-based models or ensemble learning techniques, as suggested by Šedík and others48, who examined texture preferences across age segments.
Taken together, the CART model provided an interpretable and analytically sound segmentation of consumers based on concrete, observable behaviors. The combination of seasonality, sourcing channels, and purchase quantities effectively predicted the underlying motivations for honey consumption, revealing nuanced and actionable consumer profiles.
The ranking of predictor variables obtained from the CART model (Table 2) reveals a coherent behavioral structure underlying consumer motivation for honey consumption. Among all variables tested, purchasing quantity emerged as the most decisive factor, suggesting that the amount of honey acquired encapsulates deeper intentions related to its usage. Specifically, moderate and standardized quantities were closely associated with therapeutic motivations, likely reflecting deliberate, health-oriented practices. Purchase period ranked second, reinforcing the idea that seasonal timing, particularly during colder months, is a strong indicator of medicinal consumption. Gender also played a substantial role: women were more often linked to therapeutic intent, while men tended to prioritize nutritional value. Purchase place contributed to the model by distinguishing between consumers who favored conventional retail and those who sourced honey through artisanal or direct channels, the latter being more aligned with health-related consumption. Finally, although preferred consistency and general purchasing criteria displayed lower predictive weights, their inclusion points to the nuanced and multidimensional nature of consumer behavior that extends beyond overt choices to include sensory preferences and contextual habits.
Table 2: Importance of independent variables in predicting consumption reasons
| Independent variable | Importance | Normalized importance (%) |
| Purchase quantity | 0.031 | 100 |
| Purchase period | 0.020 | 64.8 |
| Gender | 0.017 | 54.5 |
| Purchase place | 0.014 | 45.5 |
| Preferred consistency | 0.006 | 17.8 |
| Purchasing criteria | 0.003 | 11.2 |
Various studies have examined the multidimensional determinants of honey consumption. Recent findings by Kowalczuk and others 29) indicate that preferences with 65% of responses, along with familial influence and habitual use, outweigh health or nutritional motivations in shaping consumption patterns. Similarly, Arvanitoyannis and Krystallis 49) emphasized that consumers often prioritize perceptible attributes -such as color, texture, and flavor- over certification or origin, framing honey as a sensorial rather than symbolic product. In contrast, Testa and others50 identified therapeutic value as the dominant factor influencing honey consumption, followed by income, variety and taste. Šedík and others22 further demonstrated that generational differences modulate the weight assigned to health, sensory, and provenance. Across diverse contexts, these studies converge to underscore that consumption is driven by an interplay of hedonic, functional, and socio-cultural dimensions. Altogether, this hierarchy of predictors not only reinforces the multidimensional nature of honey consumption but also validates the use of decision trees as an interpretable and context-sensitive modeling tool in food behavior research.
4. Conclusions
This study demonstrates that honey consumption in northwestern Algeria is driven by a complex interplay of behavioral, socio-demographic, and purchasing-related factors. By applying both Multiple Correspondence Analysis (MCA) and a Classification and Regression Tree (CART) model, we identified distinct consumer segments based on their primary consumption motivations. The integration of machine learning (CART) with exploratory statistical analysis (MCA) allowed for a robust identification of key predictors, providing both descriptive and predictive insights. The most influential factors relate to Algerian consumer profiles, seasonal consumption patterns, and purchase criteria. These findings hold significant value for stakeholders in the local apiculture sector. The insights generated may inform targeted marketing strategies, support the development of product labeling systems that align with consumer expectations, and guide production towards preferred textures and product attributes. Moreover, optimizing distribution strategies based on these consumer segments could help reduce market prices and improve accessibility to honey products.