Inglés (pdf)
 Articulo en XML
 Referencias del artículo

 Permalink
1. Introduction
Grape juice is one of the main juices with commercial adhesion and industrial applications. As well as being marketed in its natural state, in concentrated and nectar form1, this product can be used in the production of wines, yogurts, natural soft drinks, kefir and other fermented products2, microencapsulated sources of anthocyanins 3)(4) or even in the preparation of other products, such as jams, jellies and cakes, in order to add sweetness and flavor1.
The rheological behavior of liquids, such as fruit juices, has been the subject of growing interest, given its direct influence on the sensory quality, processing and formulation of food products 5)(6) . In the specific context of grape juice, understanding how determination of rheological properties is affected by factors such as the type of geometry and the distance between plates (gap) is essential to ensure a product with desirable characteristics and its suitable application in other processes.
Determining the type of plate geometry and the gap in a rheometer are essential aspects when evaluating the rheological behavior of fluids7, such as grape juice. The proper choice of these parameters can significantly influence the accuracy of the measurements, since the plate geometry and an inappropriate gap can lead to distortions in the rheological results8. There is a rule of thumb that correlates the gap value with the particle size of the fluid. The rule states that the gap value must be at least 10 times larger than the particle size to be considered an appropriate approach for obtaining reliable rheological results 9)(10) . The reason for this is to ensure that the particles do not get trapped between the plates and affect the measurement of the fluid's behavior. However, this correlation still needs to be validated for grape juice.
In turn, the application of empirical models to predict the rheological behavior of grape juice plays a fundamental role in the in-depth understanding of the fluid properties of this product11. While experimental measurements provide direct information on behavior under specific conditions, mathematical models allow these results to be extrapolated to a variety of scenarios12, saving time and resources. The validation of empirical models based on selected experimental data allows not only a better theoretical understanding of rheological behavior, but also the creation of practical tools to optimize industrial processes and develop products with specific rheological characteristics13.
Therefore, this study aims to contribute to the understanding of the rheological behavior of grape juice by experimentally investigating different plate geometry models and rheometer gaps. The aim of this research is to determine the most appropriate plate geometry and gap that result in accurate and representative measurements of the rheological properties of whole grape juice, as well as to determine the best empirical model for predicting the rheological behavior of the beverage.
2. Materials and Methods
2.1 Materials
The frozen organic grape juice (De Marchi, Jundiaí, Brazil) was purchased from a local supermarket (Campinas, Brazil) and stored in a domestic freezer at -18 ± 2 °C. The juice is a blend of several purple/pink grape varieties, such as: 'Vitória', 'Niagara Rosada' and 'Isabel'. The quality of the grape juice was previously attested to by characterizing its proximate composition and physicochemical properties. The results are detailed in the study by Almeida and others3, published by our research group, and the data is available in an institutional repository14.
2.2 Steady-State Tests: Evaluation of the Thixotropic Effect, Determining the Best Gap and Type of Plate Geometry, and Predicting the Rheological Behavior Using Empirical Models
To visually assess the thixotropy of the system, the grape juice was subjected to a process of increasing and decreasing shear stress, comprising two ascents (step 1 and 3) and one descent. The aim was to assess the area between the first and last ascending curves. To this end, a controlled tension rheometer (Hakke Mars III, Thermofisher Scientific, Massachusetts, USA) was used to generate the curves. The rheometer had parallel stainless-steel plates with a diameter of 4 cm. The measurements were carried out at a temperature of 25 °C over a shear rate range (γ̇) of 0 to 300 s-1. Three curves were collected per replicate. The gaps used ranged from 1.3 to 2.5 mm, using smooth plate geometry.
These tests were also carried out to determine the best gap to be used in determining the rheological behavior of grape juice. Initially, the tests were carried out with smooth surface geometry. The best gaps were selected to have the test replicated with the rough surface geometry, under the same analysis conditions. Based on these tests, the best gap and the best type of plate geometry were selected. However, for this stage of the research, only the third was considered to avoid thixotropic effects.
The data from the third flow curve, using the best gap, was adjusted to the empirical mathematical models for Newtonian fluids, Power-Law (Ostwald de Waele) and Herschel-Bulkley, using Eq. 1, Eq. 2 and Eq. 3, respectively. The quality of the fit of the models to the curves was assessed using the coefficient of determination (R2). The Sum of Squares of Errors (SSE) and Root Mean Square Error (RMSE) were also determined to check the quality of the models' fits to the experimental data. The modeling and statistical analysis were carried out using Excel® software, version 2016.
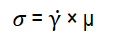
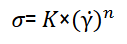
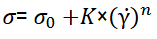
Note: 𝜎 - shear stress (Pa), σ 0 - initial (or residual) stress (Pa), γ̇ - shear rate (s-1), μ - viscosity (Pa. 𝑠 𝑛 ), K- consistency index (Pa. 𝑠 𝑛 ) and n - behavior index.
2.3 Relationship between Ideal Gap and Grape Juice Particle Size
The best gap was compared with the size of the grape juice particles to confirm a correlation commonly accepted in the literature: the ideal gap (mm) is at least ten times the value of the mean particle diameter. The mean size and particle size distribution of the grape juice were determined using a laser light diffraction instrument (Mastersizer Hydro 2000 MU - Malvern Instruments Ltd., Malvern, UK). The samples were dispersed in absolute ethyl alcohol (99.5%) and subjected to 3 readings.
The mean particle diameter was expressed using different methods: De Brouckere mean diameter (D(4.3), µm), Sauter diameter (D(3.2), µm), D(v, 0.5) (µm) and D(v, 0.9) (µm), but only the value of D(4.3) was considered when calculating the correlation. The span, known as the width of the particle size distribution and indicative of the homogeneity of the particles, was also measured.
3. Results
3.1 Steady-State Tests: Evaluation of the Thixotropic Effect, Determining the Best Gap and Type of Plate Geometry, and Predicting the Rheological Behavior Using Empirical Models
Although the gap does not alter the intrinsic thixotropic nature of the fluid, it can influence the magnitude of the thixotropic response observed during the tests15. In this study, the application of gaps of 2.3 mm, 1.75 mm and 2.5 mm, in that order, led to a lower apparent thixotropic effect, while the other gaps resulted in a more pronounced response (Figure 1). This suggests that, although subtle, the gap size can modulate how thixotropy manifests under the experimental conditions. A more detailed discussion can be found in Section 4.1.
Figure 2 shows the flow curve of whole grape juice, obtained at 25 °C and under different gaps and plate geometries. For the gap of 1.3 mm, the juice was subjected to visible compaction, which resulted in the serum being expelled and extremely low shear rate values under the applied stresses. On the other hand, using the 2.3 mm and 2.5 mm gaps provided flows that were visually like dilatant behavior. In contrast, the intermediate openings (1.5, 1.75 and 2.0 mm) showed typical pseudoplastic behavior, where the apparent viscosity decreases with increasing shear rate, consistent with some previous studies on grape juice and other fruit-based fluids 6)(11) 16. Among them, the 1.75 mm and 2.0 mm openings showed the most consistent curves, with reduced thixotropy and minimal deviation. Therefore, these gaps were chosen to have the rheological tests replicated using rough plate geometry to reduce slip effects. A more detailed discussion is available in Section 4.2.
In general, rough surfaces are known to minimize wall slip, especially in suspensions or structured fluids. The flow curves from rough plates largely confirmed the trends observed with smooth geometries, with only minor differences. As observed for smooth plate geometry, as the distance between the plates increased, the shear flow reduced (Figure 3). Higher stresses were observed at 1.75 mm in the rough plate, while the other tests showed similar stresses.
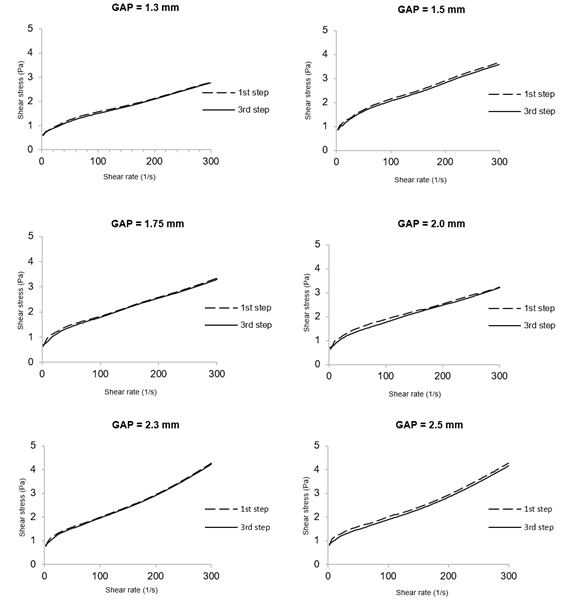
Figure 1: Evaluation of the presence of thixotropy in grape juice flow curves at 25 °C, using smooth plate geometry
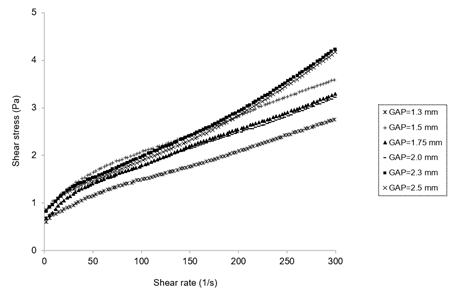
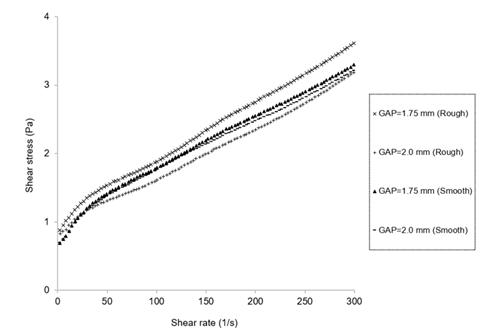
Figure 3: Comparison of flow curves obtained with smooth and rough surface geometries at gaps of 1.75 and 2.0 mm
Figure 4 shows the fit of the empirical models on the rheological behavior of grape juice. All the models showed R2 above 0.98 (Table 1). According to Oliveira and others17, R2 above 0.93 can be considered satisfactory in engineering terms. However, although the Newtonian model showed a high coefficient of determination (R2 = 0.991), this value does not faithfully reflect the quality of the visual fit seen in Figure 4. It can be seen that at low shear rates, the model underestimates the stress values, while at high rates it tends to overestimate. This compensation of deviations throughout the shear range may have contributed to an artificially high R2. This is because R2 is not sensitive to systematic error patterns18. Therefore, the use of R2 alone can lead to misinterpretations and it is essential to also consider the visual analysis of the fits and other statistical parameters for the appropriate choice of rheological model 18)(19) .
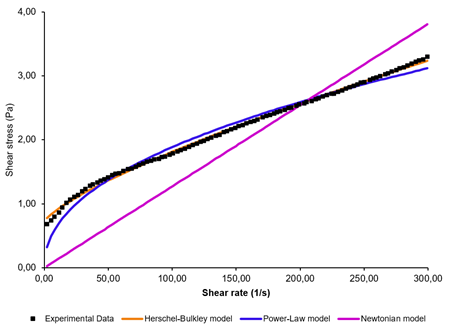
Table 1: Fits of mathematical models to constant shear flow curves of grape juice
| Model | 𝜎 0 (Pa)𝐾 (Pa.sn) | n | 1η (Pa.sn) | R2 | 2SSE | 3RMSE (Pa) | Behavior | |
| Herschel-Bulkley Power-Law Newtonian | 0.72 -- -- | 0.03 0.23 -- | 0.76 0.46 -- | 1.08×10⁻² 1.04×10⁻² 1.27×10⁻² | 0.998 0.982 0.991 | 9.63×10⁻² 9.08×10⁻¹ 2.37×101 | 0.031 0.095 0.487 | Bingham pseudoplastic Pseudoplastic Newtonian |
Note: 1Apparent viscosity measured at a shear rate of 300 s-1. 2SSE: Sum of Squares of Errors. 3RMSE: Root Mean Square Error.
The Herschel-Bulkley model had the highest R2 and the lowest SSE and RMSE (Table 1). This indicates that this model was more accurate in estimating the rheological behavior of grape juice. However, the Power-Law model also showed satisfactory R2, SSE and RMSE values, although it did not outperform the Herschel-Bulkley model. In contrast, despite presenting a satisfactory R2, the Newtonian model exhibited the worst performance among the tested models when evaluated using SSE and RMSE. This confirms the misleading nature of its R2 value and reinforces the inference that grape juice exhibits non-Newtonian rheological behavior.
The Herschel-Bulkley model indicated that the juice exhibits Bingham pseudoplastic behavior, while the Power-Law model indicated pseudoplastic behavior. The Bingham pseudoplastic behavior observed for grape juice is because the juice exhibited an initial stress ( 𝜎 0 ). However, this stress was small (< 1 Pa) and could be disregarded, since pseudoplasticity is predominant20. Thus, from a practical standpoint, it is plausible to state that grape juice has pseudoplastic behavior. A more in-depth discussion can be found in Section 4.3.
3.2 Relationship between Ideal Gap and Grape Juice Particle Size
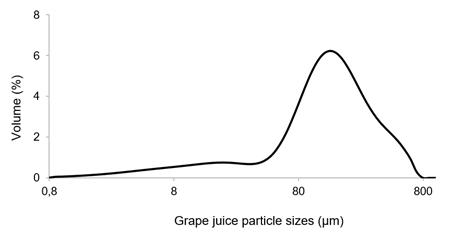
Regarding the mean particle size of grape juice, except for the D(3,2) method, the other parameters suggest that the particles in grape juice are predominantly macroparticles (Table 2), confirming the observations made using the 1.3 mm gap (Section 3.2). The D(4,3) and D(v, 0.5) methods showed size values that were relatively close to each other. In addition, the particles exhibited a monomodal distribution, according to the supplementary material (Figure S1), with the size varying in the range of 0.8 to 800 µm. As a result, the Span was only 2.49 ± 0.04, a value that denotes high homogeneity in particle sizes21. In other words, most of the particles are similar sizes.
Table 2: Mean particle size of grape juice
| Method | Diameter (µm) |
| D(4,3) D(3,2) D(v, 0,5) D(v, 0,9) | 160.09 ± 3.21 34.01 ± 0.49 129.36 ± 1.61 340.52 ± 9.52 |
By dividing the gap values (1.75 mm and 2.0 mm) by the value of D(4.3) (mm), the result shows that the 1.75 mm gap is 10.93 times larger than the size of the grape juice particles, while the 2.0 mm gap is 12.49 times larger. This confirms the validity of the relationship between the choice of gap and particle size for this fluid, demonstrating that the choice of gap satisfies the theoretically recommended value.
4. Discussion
4.1 Evaluation of the Thixotropic Effect on the Steady-State Rheological Behavior of Grape Juice
The presence of thixotropy is common in most vegetable fluids, including fruit22. A greater thixotropic effect usually occurs for juices with 55 °Brix 23) or more, i.e., with a high concentration of sugars, which is not the case with the grape juice used in this study (17.31 ± 0.09 °Brix). The choice of gap in a rheometer is a critical factor in rheological tests, as it directly affects the shear field applied to the fluid24. The difference in the thixotropic effect observed between the different gaps can be attributed to how the structure of the fluid is affected by the shear rate25.
The 2.3 mm and 2.5 mm gaps resulted in higher shear stresses compared to the other gaps. Higher shear stresses may have broken up structures or agglomerates present in the grape juice, thus reducing the thixotropic effect. This is because shear stress breaks the temporary bonds that cause thixotropy26. The use of these gaps has probably also led to a faster recovery of the structures broken during shear. This means that when the shear stress was interrupted under these conditions, the structures had less time to regroup and reconstitute, thus resulting in less thixotropy.
The good performance of the 1.75 mm gap may be related to both the greater shearing effect and the confinement effect. This gap may have confined the fluid more effectively than larger gaps, preventing the formation of large-scale thixotropic structures. When the fluid has limited space to move, the formation of thixotropic structures tends to be less favored6. Theoretically, the 1.3 mm gap should result in less thixotropy compared to the 1.75 mm gap. However, the fact that this gap also contributed to an increase in the shear stress of the juice (below only the values found for the 1.5 mm, 2.3 mm and 2.5 mm gaps) meant that it outperformed the 1.3 mm gap, as well as slightly larger gaps, such as the 2.0 mm gap. From these perspectives, the 1.5 mm gap should have outperformed the 1.75 mm gap. However, it is worth noting that some fluids exhibit thixotropic behavior that is more sensitive to changes in shear rate. It may be that grape juice is more susceptible to changes in shear rate at very low gaps, such as 1.3 mm and 1.5 mm, resulting in greater thixotropy.
It is important to remember that rheology is a complex field, and the results can be influenced by several variables, including the composition of the fluid, temperature, concentration of solids, among others. Therefore, to accurately interpret the results, further analysis and complementary experiments are suggested.
4.2 Determining the Ideal Gap and Type of Plate Geometry for Evaluating the Rheological Behavior of Grape Juice at Steady State
Regarding the 1.3 mm gap performance, the use of small gaps in samples with large particles can result in errors in the reading of the rheology of the suspension, due to the determination of the rheology of the solid particles only 20)(27) . Therefore, the behavior noted with the use of a 1.3 mm gap is an indication that the grape juice contains macroparticles. To avoid blockage and rupture of laminar flow due to the formation of “bridges” between shear surfaces in concentrated suspensions of large particles, the gap should be increased 20)(27) .
At the other extreme, the use of 2.3 mm and 2.5 mm gaps led to an atypical flow behavior like that of dilatant fluids, where the shear stress increases disproportionately with increasing shear rate 28)(29) . Fruit juices generally do not exhibit this type of behavior, since they are typically non-Newtonian fluids in which the apparent viscosity decreases with increasing shear rate (pseudoplastic behavior)6. Although not expected for fruit juices, this behavior can be attributed to the low structural integrity of the sample at larger gaps, which can allow excessive movement and reorganization of the particles under shear, mimicking shear thickening effects30. However, true dilatant behavior is generally observed in dense suspensions such as corn starch, clay or silica 31)(32) . Thus, these results suggest the use of experimental artifacts (i.e. wall slippage or uneven stress distribution) or laminar flow interruption at larger gaps.
Regarding the comparison of the performances of the best gaps on smooth plates with their versions on rough plates, three conditions (1.75 mm in the smooth plate and 2.0 mm in smooth and rough plates) can be considered suitable for carrying out the rheological analysis of the product, with the 1.75 mm gap with smooth geometry standing out, as it results in a lower thixotropic effect and requires less sample, making the process cheaper. Therefore, the use of a 1.75 mm gap is the most suitable configuration for steady-state rheological tests on whole grape juice. However, the gap of 1.75 mm in the rough plate is not suitable as its tests generated compaction of the particles and separation of the liquid part of the juice.
4.3 Predicting the Rheological Behavior of Grape Juice Using Empirical Models
Despite the superior scientific performance of the Herschel-Bulkley model, the Power-Law model can be adopted in industrial applications due to its simplicity and adequate representation of the juice's flow behavior. The use of a simpler model like the Power-Law facilitates calculations in food process engineering, such as pumping and pipeline design, without significant loss of accuracy.
The pseudoplastic behavior observed for grape juice is not unanimous in the literature. Depending on the reference, this juice can be considered Newtonian 16)(33) , pseudoplastic 11)(16)33)(34) 35 and even dilatant 36)(37) . Evangelista and others11, Kaya and Belibaǧli16, de Castilhos and others33, Bravo and others34 and Yoğurtçu and Kamışlı35 found pseudoplastic behavior for grape juice, as well as inferring that the empirical Power-Law model adjusted more accurately to the rheological behavior of the product. Tavakolipur and others 36)(37) found a dilating behavior. However, differently from the works cited above, these results reported by Tavakolipur and others 36)(37) were obtained for grape juice concentrate (67-71 °Brix). For grape juices with a lower concentration of soluble solids (<13 °Brix), Kaya and Belibaǧli16 and de Castilhos and others33 observed a better prediction of the Newtonian model.
Similar to what happened in this study, de Castilhos and others 33) found a very similar performance between the Newtonian model and the Power-Law, Bingham and Herschel-Bulkley models in predicting the rheological behavior of Merlot grape juice. Looking at the rheograms provided by the authors, it is possible to see Newtonian behavior for the juice with the lowest soluble solids content (13.6 °Brix), while the juices with the highest soluble solids content (21-45 °Brix) showed pseudoplastic behavior. This phenomenon may explain the pseudoplastic behavior observed in this study, since the juice used in the study had soluble solids content (17.31 °Brix) higher than 13.6 °Brix. The results obtained by Kaya and Belibaǧli 16) strengthen this hypothesis. By diluting concentrated grape juice, thereby reducing the percentage of soluble solids, the authors noticed that the product changed from non-Newtonian to Newtonian behavior. Tavakolipur and others 36)(37) evaluated grape juice with 67 to 71 °Brix. It is possible that this characteristic of the juice was a determining factor in the dilating behavior of the product. In addition, the authors used a Brookfield viscometer (model DV-III ULTRA) equipped with the spindle R3 to evaluate the rheological behavior of grape juice, applying the system of coaxial cylinders with smooth surfaces. This technique is different from the method used in this study, based on parallel plates (smooth or rough) used in rotational rheometers. This detail may have influenced the authors' results, possibly contributing to the observation of dilatant behavior. It should be noted that these hypotheses have not yet been verified.
Soluble solids, such as carbohydrates (mainly sugars), can interact with water molecules, forming structured arrangements around the solute and affecting its conformation38. At higher concentrations, these carbohydrate-water interactions become more complex, reducing the free energy of the system and limiting the amount of water available to hydrate other particles present in the system39. This results in an increase in apparent viscosity and often in non-Newtonian behavior due to the intensification of intermolecular interactions and the formation of more organized structures40. On the other hand, in juices with lower soluble solids content, the intermolecular forces and interactions between particles are less significant, allowing the system to behave more uniformly, with practically constant viscosity at different shear rates, favoring Newtonian behavior.
5. Conclusions
Therefore, the 1.75 mm gap with smooth geometry plates as well as the 2.0 mm gap with both smooth and rough geometry plates are suitable options for the rheological evaluation of grape juice. However, as the 1.75 mm gap requires less sample, it is more advantageous in terms of cost. A ten to one ratio between gap and particle size was considered adequate for studying the rheological behavior of grape juice. The juice exhibits pseudoplastic behavior. In this context, while the Herschel-Bulkley model is more robust for scientific description, the Power-Law model is sufficiently accurate and more practical for engineering purposes.