


 Inglés (pdf)
 Articulo en XML
 Referencias del artículo

 Permalink
1. Introduction
The MINA Group at the Faculty of Engineering of the University of the Republic (Uruguay) specializes in research and development in mobile autonomous robotics. The group focuses on creating technological solutions that combine mechatronics, machine learning, and automation, intending to address various challenges in dynamic and complex environments.
Recently, the MINA group has been actively working on four case studies that reflect the applicability of their research. This article resumes the work of several undergraduate students and researchers guided by the authors. We aim to share our developments with the community to foster future collaborations and trace new research avenues.
Through advanced technologies, our group develops solutions that enhance efficiency across various sectors, including agriculture, helping to make practices more innovative and effective. In recent years, we have integrated neural networks into our work. These are computer models inspired by the way the human brain processes information. They learn to recognize patterns and make decisions based on data. The most common approach is supervised learning, where the model is trained using a set of examples that have already been labeled with the correct answers. By analyzing this data, the neural network gradually adjusts its internal settings to improve its predictions and solve specific problems more accurately.
The first case focuses on apple counting and quality assessment. In collaboration with the National Livestock and Agriculture Research Institute (INIA in Spanish), an autonomous system has been developed using the Jackal robot equipped with ZED cameras. This project employs computer vision algorithms to automate crop monitoring, allowing accurate counting and assessment of apples' health status. This work contributes to more efficient plantation management.
The second case study addresses the detection of pest birds in agricultural areas. Pest birds can cause significant damage to crops, so their early detection is critical. The MINA group is developing an autonomous system that uses sensor networks and drones equipped with cameras to identify the presence and deterrent of these birds. The system distinguishes between bird species using image processing and machine learning algorithms, alerting farmers to potential threats and enabling timely intervention.
The third case study focuses on ant nest localization, especially in agricultural environments where ants can affect crop health. The group has designed an autonomous robot, equipped with cameras, to identify and track ant activity. This system applies computer vision and neural network techniques to map ant movements and follow them to the nest, providing valuable data for pest control and plantation protection.
Finally, the fourth case presents studies using neural network models for weed detection. These works focus on developing and evaluating machine learning-based approaches to identify and classify weeds in agricultural environments accurately. The proposed models leverage advanced image processing techniques and deep learning architectures to enhance detection performance, contributing to precision agriculture and sustainable weed management.
2. Apple Counting and Quality Assessment
2.1 Introduction
An accurate estimate of the amount of fruit produced allows growers to make key strategic decisions regarding crop production, distribution, and marketing. Similarly, early identification of diseases is crucial to minimize their spread during the crop's development. The omission of disease identification can lead to substantial losses in the total harvest, making early detection a critical factor in agricultural success.
Traditionally, human observation has carried out the detection and identification of fruit diseases and pests. Although this practice is still prevalent in many countries, it is a costly and time-consuming task. Furthermore, detection by human observation presents another major problem due to the periodic application of agrochemicals to combat pests and diseases that can cause health problems for the people in charge of monitoring due to prolonged exposure to these products. Automating the detection and quality classification of fruits such as apples would be highly beneficial.
2.2 Materials and Methods
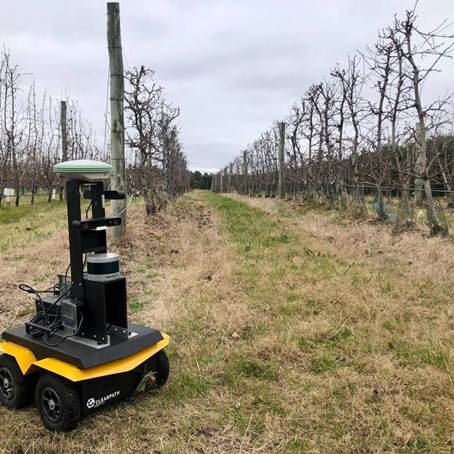
In the context of this project, the proposed solution uses the Jackal robot1 as a base platform. This ground robotic platform, developed by Clearpath Robotics, is recognized for its robustness and versatility in field environments. The Jackal platform is a compact, high-performance autonomous vehicle specifically designed for outdoor applications, making it ideal for inspecting and monitoring agricultural plantations. The robotic platform was adapted to incorporate sensors for image capture using ZED cameras developed by Stereolabs. These high-resolution stereo cameras provide depth data and allow 3D perception of the environment. The combination of the Jackal robot and ZED sensors offers an integrated and efficient solution for the automation of agricultural monitoring (Figure 1), significantly improving the accuracy and efficiency of crop analysis and contributing substantially to decision-making in plantation management. This integration has resulted in the MAGRO dataset2, which openly provides valuable information for counting, quality and autonomous navigation work in agricultural environments.
The Robot Operating System (ROS)3 is a flexible, open-source platform designed for robotic software development. It provides many tools, libraries, and conventions that simplify creation of complex robotic applications. ROS's use in robotics research is primarily justified by its flexibility, modularity, standardization, simulation capability, and broad hardware compatibility. These aspects consolidate ROS as an essential tool for developing advanced and efficient robotic solutions. Recently, the use of computer vision and image processing has increased considerably in a wide variety of tasks, including agriculture. Agricultural environments present several challenges, particularly the use of computer vision in environments with high illumination variations and occlusions caused by fruits, leaves, or branches, what makes this task an open problem. The main objective of this work is to develop a solution to automate and optimize fruit analysis in agricultural environments. Specifically, solutions are sought to solve the problem of detecting and counting apples using object detection and tracking algorithms based on neural networks. Once the apples are detected, disease detection can be performed only in the image section where they are located. This development has the potential to significantly impact agricultural practices, making them more efficient and productive.
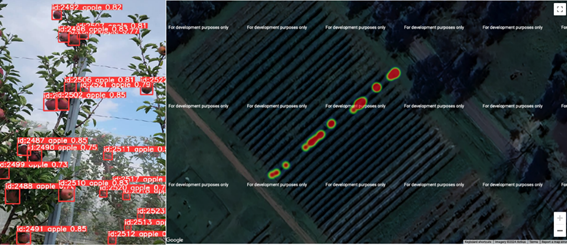
To achieve this purpose, a system was designed that combines computer vision and deep learning techniques. In this context, a system was developed that counts and classifies apples as healthy or diseased and associates them with a geographic position to identify their location (Figure 2). This system is a pipeline that integrates detection algorithms, video tracking, and apple classification, linking them to a geographic location to generate a heat map that identifies areas with a higher presence of diseased apples.
During the processing of each video frame, the apples present are detected and tracked over time, and the number of apples seen is counted. At the end of the video processing, the detected apples are classified using all the images obtained from each one. The system can also classify the apples as the frames are processed in real time. Since it was implemented generically, the pipeline is very flexible in using other algorithms, allowing the implementation of interfaces using different algorithms.
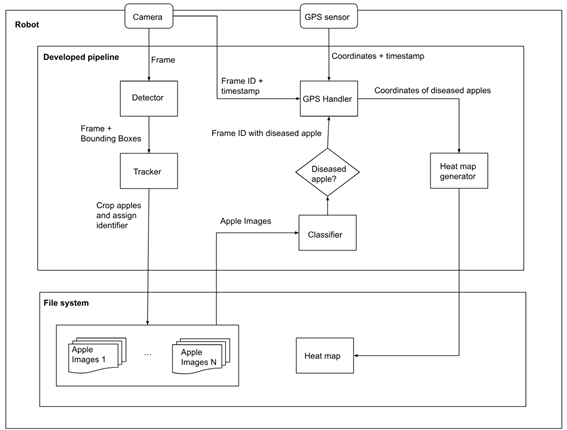
2.2.1 System Architecture
A generic architecture has been developed for detecting, classifying, and tracking various targets. This architecture integrates multiple modules, including data acquisition, preprocessing, and feature extraction, thereby enabling the incorporation of decision-making algorithms to ensure robust and accurate performance across diverse scenarios. The design of this solution is depicted in Figure 3, which illustrates the systematic flow and interaction between the different components of the architecture. By providing a comprehensive framework, this architecture facilitates the implementation of advanced algorithms, enhancing their adaptability and effectiveness in real-world applications.
Various state-of-the-art algorithms were trained and evaluated using different datasets. You Only Look Once (YOLO) model version 8 achieved near-state-of-the-art results for close-up apples but had lower recall for apples on trees, detecting them quickly but missing many. Faster Region-Based Convolutional Neural Network (Faster R-CNN) had high recall but lower precision; while Segment Anything Model (SAM) and Contrastive Language-Image Pretraining (CLIP) performed poorly compared to expectations. For quality classification, CLIP excelled in quality datasets, though the Transformer model was better at detecting diseased apples in tracking datasets, but was slower.
Tracking algorithms, especially StrongSORT, BoT-SORT, and DeepOCSORT, performed well. They associated detections across frames and recovered quickly if a detection failed. Their performance is tied to the quality of the detection algorithms.
2.3 Results
2.3.1 Apple Detection and Counting
The availability of adequate data is essential when training deep neural network models. Upon reviewing the available data for detection, disease classification, and counting, we find several works that, although designed for other tasks such as fruit harvesting -where images are seen in close-up- or using high-altitude drone flights -where images are seen from a distance-, are relevant as they can still provide variability to the type of data used, especially if the availability of data on trees is scarce 4)(5)6)(7) . The use of tracking algorithms is evaluated to avoid counting the same apples multiple times. The datasets are composed of image sequences and the identification of not only the apple but also the assignment of a unique identifier. For this, two datasets are used 8)(9) , one with images acquired at INIA.
Neural network models for object detection, such as YOLO10, Faster R-CNN11, and SAM12, were used and evaluated with various public and self-developed datasets. Tracking algorithms such as StrongSort, ByteTrack, and OCSort were also assessed. For this, video datasets were constructed from recordings of a plantation and data generated with an apple field simulator. The simulator is used to create controlled conditions for testing tracking algorithms, complementing real-world data, which is often scarce, particularly in terms of labeled apple tracking datasets. Finally, two adjustment models that seek to minimize the error of the predictions using linear regression were evaluated for counting.
2.3.2 Apple Quality
In the study on apple quality, we carried out two works that encountered the same obstacle: the need for significant public datasets with images of apples classified as diseased or healthy on the trees, or significant datasets that specify the type of disease or defect.
In the first work, Rieppi and others13 created a dataset with images obtained from Kaggle14, Roboflow15, and QuIIL16. This dataset was curated by removing unrelated images, cropping those with multiple apples to generate one image per instance, correcting misclassifications, and eliminating duplicates. The resulting dataset contains 8410 images of healthy apples and 4116 of defective apples.
We conducted experiments with five models: two for anomaly detection (GANomaly17 and PaDiM18) and three for image classification (ResNet50V219, MobileNetV220, InceptionV321). The results showed that the classification models outperformed the anomaly detection models regarding F1-Score, with MobileNetV2 being the best, achieving the highest scores in all dimensions (mean 0.94).
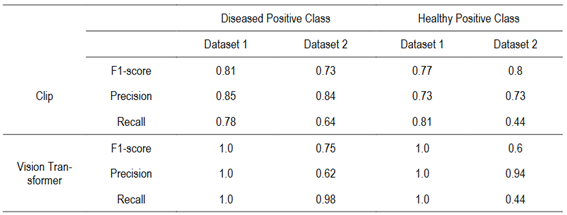
The other study was conducted by Sheppard and Guchin22, who used two datasets: Dataset 1: Fruits fresh and rotten for classification23 with 1694 training images of healthy apples and 2343 diseased apples, and Dataset 2: Apple Detection Dataset24 with 294 training images of healthy apples and 269 diseased apples. They used CLIP25 and Vision Transformer26, two state-of-the-art algorithms for classification. CLIP was not trained, and the labels “a healthy apple” and “a rotten apple” were used for classification, while Vision Transformer was trained with Dataset 1.
The results showed that Vision Transformer is approximately three times slower than CLIP. In Dataset 1, Vision Transformer achieved perfect performance, as it was trained on this dataset, albeit with a different partition. CLIP achieved balanced results with metrics around 80%. In Dataset 2, CLIP had similar results to the other dataset, although with lower recall for diseased apples. In contrast, the Transformer showed lower precision and accuracy than CLIP, with a tendency to classify more frequently diseased apples.
In conclusion, CLIP achieved the best results, similar results in both datasets, outperforming the Vision Transformer in the untrained dataset. However, both methods fell short of state-of-the-art algorithms, which achieve around 94% precision and accuracy, using datasets that are unavailable for comparison.
2.4 Conclusions
Counting the number of apples and detecting diseases in time are fundamental to improving crop quality and productivity. Both tasks can benefit from technology, and thanks to current advances in machine learning, these tasks can be performed successfully.
The developed pipeline for apple classification in videos is not just a solution for today but a platform for the future. It is designed to seamlessly integrate with any upcoming detection, classification, or tracking algorithm. This adaptability ensures its relevance and usefulness in the ever-evolving field of agricultural technology.
Larger, diverse datasets are needed for detection, quality classification, and tracking. The lack of such datasets led to models overfitting and poor generalization. More varied datasets with different backgrounds, sizes, and lighting conditions are necessary for better performance.
3. Sound-Based Parakeet Detection System
This section summarizes and highlights the most important aspects and results achieved in a previous work entitled as the section name27.
3.1 Introduction
In recent years, the rapid increase in parakeets has become a significant and pressing issue for crops in the Rio de la Plata region. Their ability to adapt to various environments, their high reproductive rates, and versatile diet have led to rapid population growth, seriously threatening agricultural productivity. This study is part of an essential feasibility assessment for developing a parakeet detection system and subsequent deterrence mechanism using real-time audio signals captured in the field.
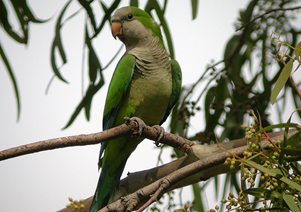
The Argentine parakeet (Myiopsitta monachus, Figure 4), also known as the monk parakeet, is a species of psittaciform bird from the Psittacidae family, native to South America. It is commonly found in Uruguay, Argentina, Brazil, Paraguay, and Bolivia28. The bird predominantly feeds on seeds from both wild and cultivated plants, including thistle, sorghum, corn, and rice. It also consumes fruits, flowers, adult insects, and larvae29.
Due to these feeding habits, the monk parakeet has been a long-standing issue for crops, particularly fruit trees, negatively impacting agricultural output. In Uruguay, it was officially classified as a pest in 1947, and by 1981, the FAO estimated an annual loss of US$ 6 million due to the bird's damage, a figure that has likely risen since then29. Additionally, conventional bird control methods have proven ineffective due to the parakeet's remarkable environmental adaptability.
Recent research has revealed an intriguing aspect of parakeet behavior: they possess a distinct acoustic signature, which allows them to encode their identity through various calls. This enables them to recognize one another and share information. This complex acoustic behavior distinguishes their calls from other sounds in the field, a characteristic our proposed detection system seeks to utilize 30)(31)32)(33)34)(35) 36.
3.2 Materials and Methods
3.2.1 Sound-Based Detection System
Given the large control area, equipment costs, processing time, and the potential frequency of events, a sound sensor system is the most viable option. In this study, only a single audio source will be processed to simplify the problem and evaluate the feasibility of detecting parakeets through audio. This results in a binary classification problem, where continuous audio sampling is used to determine parakeets' presence (True/1) or absence (False/0).
As some authors indicate 31)(32)33)(34) , learning from their sounds appears feasible. The primary techniques used include Spectrographic Cross-Correlation (SPCC) and Mel Frequency Cepstral Coefficients (MFCC); however, the spectrogram image was deemed the most suitable alternative since it inherently contains much of the information provided by the other methods.
3.2.2 The Data
To train the model, the parakeet audio must include a variety of calls and account for variability in the number of emitting parakeets, ranging from a single bird to small groups or flocks. Meanwhile, the ambient noise dataset must cover all possible sounds in the field, including those from other birds and animals. A database was compiled using audio from various public sources found on the internet, along with several recordings captured at different locations across the country between November 2023 and March 2024, using the eBird app.
3.2.2.1 The Parakeet Spectrogram
The parakeets’ spectrograms were studied to adjust their construction parameters to most clearly express the patterns inherent in the sounds emitted by the parakeets (their harmonics). See Figure 5 (a) parakeet, and (b) other species.
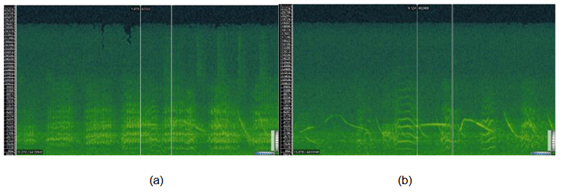
Figure 5: Sonic Visualiser screenshots (Spectrogram: Window 512, 87.5%, dB), approx. two seconds duration
3.2.2.2 The Dataset
With 30% set aside for validation, the dataset results in 511 samples (43.6 minutes of total recording) of the negative class and 309 samples (26.8 minutes) of the positive class for training. In total, including the validation data, there are 1171 recordings of 5 seconds each.
3.2.3 Classification Model: Convolutional Neural Network
3.2.3.1 Architecture
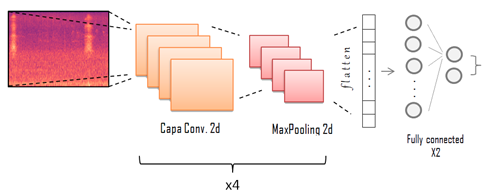
Based on the architecture suggested in Prosise37, after numerous performance tests modifying various parameters, addressing the trade-off between the model’s size and weight and its performance as a classifier, the model architecture is summarised in the diagram shown in Figure 6.
Note that this architecture, for an input size of 192×256, has approximately 700,000 trainable parameters and occupies 2.64 MB of memory, which is relatively low for a CNN.
3.2.3.2 Data Augmentation
Data augmentation is applied to 30% of the training set's parakeet base (label = True) to balance the classes (while the validation set remains the same). White noise is added to 15% at two low power levels.
Natural noise from nine background samples (field, rain, crickets, some bird sounds, etc.) is added to the other 15%. The result was an increase in the sample of parakeets in the Train from 309 to 402, representing 44% of the total Train set, compared to 38% before the rise.
3.2.4 Event Detector
Since the binary classifier expects five-second inputs to determine the presence or absence of parakeets, it does not seem feasible to compute the spectrogram and process it as an image in the neural network every five seconds permanently, especially considering that the sensing comes from a network of multiple microphones. Therefore, an event detector is needed as a previous instance of filtering, maintaining a low computational cost (and consumption). When a relevant acoustic event occurs, it sends five-second fragments to the classifier to determine whether it is a parakeet.
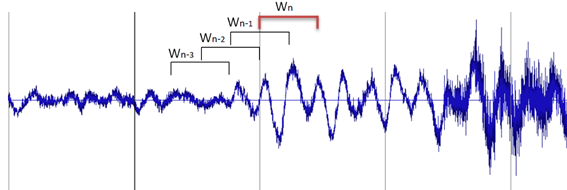
Some tracks were taken (and others were created) to test and tune the event detector. The objective is to prevent ambient noise from triggering the event. The concept of a sliding window, and thus a moving average, seeks to adapt to the variable acoustic conditions at a given time and place while allowing for gradual and ‘smooth’ changes, yet recognizing sudden ones (Figure 7).
3.3 Results
The complete system consists of an event detector that operates continuously. When an event occurs, it sends the last 5 seconds of audio to the classifier. The classifier then converts the time window into an image using the spectrogram, adjusts its size, and feeds it into the trained neural network. If the classification is positive, a drone is dispatched, the detector is paused to conserve energy, and a second detection awaits confirmation. A simulation of the entire system was conducted to test the whole pipeline, simulating the real-time arrival of samples.
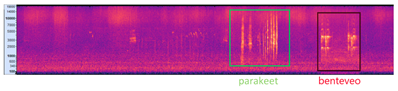
Figure 8 illustrates an example by showing an audio file featuring the sounds of a parakeet and a benteveo bird. Both sounds trigger the event detector, but they are classified differently. The vertical lines in the chart indicate when events are detected: if the classification is positive, the line is green; if negative, it is red. The corresponding spectrogram is displayed below the chart. Based on this information, both classifications are deemed correct.
3.4 Conclusions
After a thorough review of the literature on acoustic event detection in general and the sounds produced by parakeets specifically, along with the promising experimental results, we conclude that it is feasible to develop a detection system. This system can apply models already established in the field for identifying parakeets based on audio classification using spectrogram frequencies. The primary challenge moving forward is to continue improving the dataset. Additionally, the intensity of information exchange and sound production during foraging or feeding is high enough to affect the model's sensitivity, presenting a potential unaddressed complication.
Future work will focus on enhancing the classification model, particularly by collecting more balanced data and considering the environmental factors in which the system will be deployed.
4. Ant Nest Localization
4.1 Introduction
Ants are one of the factors that reduce agricultural productivity, causing economic losses due to decreased production and the cost of controls. These insects are considered pests and constitute one of the leading sanitary problems for agricultural production. Their adaptability and resistance to controls have made ants a global and central issue in agricultural production. Leaf-cutting ants are polyphagous, meaning they feed on many plant species, making them a problem for various sectors, such as forestry, agriculture, viticulture, and horticulture38. For forestry companies, leaf-cutting ants of the genus Acromyrmex cause enormous economic losses due to the damage caused by the defoliation of young plants.
Currently, the only effective control method is agrochemicals, but this creates an unavoidable tension between the principles of environmental sustainability that govern agricultural activity and production's success 39)(40) 41. Additionally, ants have demonstrated a remarkable ability to avoid chemical controls by adapting their behavior to minimize the effect. In this context, it is necessary to adopt alternative methods to chemicals and/or reduce their use to preserve health and the environment.
This project aims to develop an autonomous robot capable of traversing plantations in search of ant nests. To achieve this, it must be able to localize itself and move freely in highly challenging terrains while attempting to recognize both potential ant nests and ant trails, which it can then follow to find the nest. Locating the ant nests would allow for more environmentally friendly control techniques, such as mechanical removal of the nest or localized application of chemicals. In addition, a robotic worker has inherent advantages, including 24-hour operation, autonomy, and precision.
4.2 Materials and Methods
4.2.1 Robotic Platforms
The first step towards a fully autonomous ant-nest detecting robot is a navigation platform ready to traverse the rough terrain of the plantations. The robot base must remain stable and close to the ground to keep its sensors close to the (possible) ants and nests, maximizing the likelihood of detecting them. It is also desirable for the robot to be affordable, easy to build, robust, and easy to control.
To this end, we developed two distinct prototypes based on our experience and the current trends in agricultural robotics. Both are based on the Dynamixel AX-12 servo motors42, which provide good torque and precise control through a Python script and a ROS Controller. Having the motors modeled in the ROS framework allows us to easily use all ROS features, including our own localization and mapping algorithms developed for previous projects. The robots are equipped with an Odroid N2 Single Board Computer (SBC) for computing and control, capable of running low-level motor control, ROS framework, mapping algorithms, and object detection neural networks.
4.2.1.1 Hexapod Robot
The first prototype, shown in Figure 9a, is a hexapod robot with three motors per leg. Using legs instead of wheels means the robot can fully control each point of contact with the ground, adjusting for irregularities in the terrain to maintain its level. This locomotion is also robust to obstacles, using feedback from each leg to detect them and either climb or avoid each one depending on its height, angle or other factors.
In our preliminary test, the robot showed these virtues: moving around dirt, grass, and concrete without major issues. However, the fine control of 18 motors comes at a high computational cost that has proven hard to balance with sensor acquisition and image processing. Using the onboard SBC, the robot can only process one image every two seconds and has to stop entirely before doing so. This limitation can be overcome using a more powerful board or straightforward leg controls.
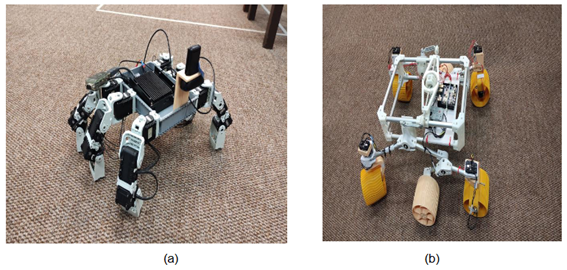
4.2.1.2 Rover Robot
This other prototype (Figure 9b) is inspired by the NASA Mars Rover (as replicated by Sawppy the Rover43) and built by combining aluminum and 3D printing. It features 10 motors, one for each wheel and one for each corner wheel, to adjust its angle.
The robot features a Rocker-Bogie suspension mechanism, which is key to climbing steep terrain and overcoming big obstacles. This system ensures that at least one wheel is always in contact with the ground, meaning it never loses traction. Another advantage is that by connecting both sides of the robot through a mobile link, the base keeps relatively parallel to the ground even when facing obstacles.
4.2.2 Ant Detection
To address the problem of locating the ant nest in an automated manner, detection technologies such as vision with aerial and ground vehicles have been explored, with adequate results only in cases where the environments are controlled and isolated. Additionally, representing the state of the art, these works address the problem of ant species that build their nests superficially, greatly simplifying detection. The ant species in our country build underground nests, representing a much more significant challenge that has not been explored nationally or internationally. However, extensive literature highlights image analysis through deep neural networks as technological tools for identifying and monitoring ants 44)(45) .
In this work, we studied various architectures, considering their applicability to the task, performance, and resource requirements for training and deployment -the selected model needed to run efficiently on the available hardware alongside the rest of the system. Several widely used models were evaluated, including MobileNet, ResNet, and YOLO. Among all the evaluated options, YOLO proved to be the best fit for these requirements. Specifically, YOLOv8 was chosen through the Ultralytics API, as it was the most advanced YOLO architecture available at the start of this project phase.
To retrain the YOLOv8 model and adapt it to our objective, a dataset for ant detection was created using Computer Vision Annotation Tool (CVAT), a manual labeling tool. This dataset consists of frames extracted from videos we captured using the camera installed on the robot. The images were collected to reflect the camera's actual position, height, and angle in the real environment, providing a more accurate context for ant detection under conditions similar to the model's practical application.
Since ants are tiny, frames were captured at a resolution of 1280×852. This ensured that the labeled ants occupied bounding boxes between 30 and 70 pixels in width or height (depending on orientation), facilitating their detection.
This dataset has the advantage of being specifically tailored to the environment where the tests will be conducted, as the images were taken directly from that context. However, a limitation is that it does not include ants of different sizes or from environments other than those considered in our project. This restricts its generalizability to scenarios outside the project, such as different cameras, variations in camera positioning, or diversity in ant sizes, species, and ground characteristics.
The dataset consists of 2,975 images, with 2,679 allocated for training and 296 for validation.
4.2.3 Ant Following
Once ant detection is implemented, the robot must be able to determine the path direction they are following and move accordingly.
4.2.3.1 Path Direction Estimation
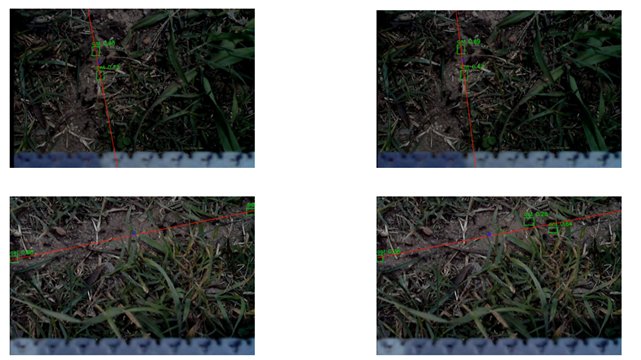
The output of the detection model consists of bounding boxes corresponding to each detected ant. From these bounding boxes, the midpoint of each is calculated and used as input for the least squares algorithm, which returns the best-fitting line for these points. This method was chosen because, given the robot's limited field of view and its proximity to the ground, it is assumed that the paths formed by the ants will have an approximately linear distribution.
Using this line, the robot determines its direction so that it stays centered on the path. This is done by analyzing the location of the midpoint of the detected line segment within the image. The image is divided into three zones: if the midpoint falls in the left zone, the robot turns counterclockwise; if it is in the center, the robot moves forward; and if it is in the correct zone, it turns clockwise.
Additionally, the division into zones depends on the line's inclination. If the line is vertical, each zone occupies one-third of the image. If the line is inclined to the left, the rightmost quarter of the image is assigned to clockwise turning, the next quarter to forward movement, and if the point falls in the left half, the robot turns counterclockwise. A similar reasoning applies when the line is inclined to the right.
4.2.3.2 Simulation
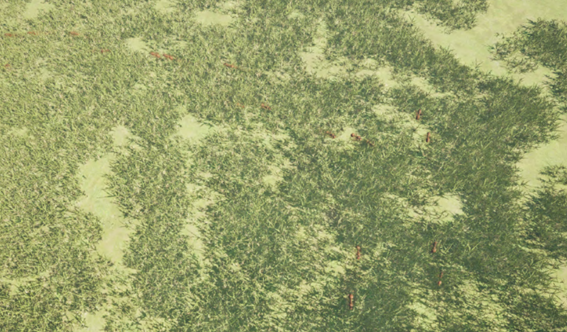
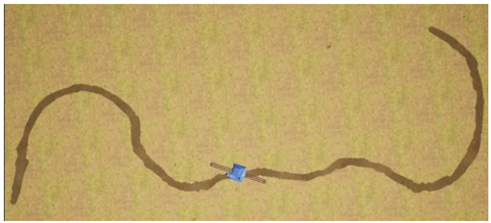
To conduct tests in a controlled manner, a simulation of the robot's working environment was implemented using the Unreal Engine 5 game engine. This simulation allows for the adjustment of grass height and density, the creation of paths of any shape and length, and the configuration of the number of ants moving along them. The robot is then placed on these simulated paths, and its camera view can be rendered. This setup enables testing the effectiveness of tracking algorithms in various scenarios. Figure 10 presents an example scenario from a far point of view, not the one from the robot.
4.3 Results
4.3.1 Ant Detection
The ant recognition model was trained using our dataset for 50 epochs, with early stopping applied. The model achieved a precision of 95.57%, and a recall of 96.57% on the validation set. However, when tested on other videos collected after the dataset was built and the training was completed, the model detected only 40% of the ants on average. This indicates clear overfitting, likely caused by the fact that both the training and validation images were sourced from the same videos, where not all frames present significant differences.
Nevertheless, the model can recognize between two and five ants (40% of the total) at any point during testing (examples in Figure 11). Given this performance, it was decided to proceed with this model and evaluate the feasibility of tracking under these conditions.
4.3.2 Ant Following
Tests were conducted within the simulator to evaluate the system as a whole and assess the robot’s ability to follow the ants to the end of the path. Movement errors were introduced to make these tests more realistic, and the number of ants the model could detect was limited. This approach allows us to assess the system's limitations by adjusting the number of detections and determining whether the robot can still accomplish its task. Each time the robot takes a step, noise is applied to simulate real-world imperfections: a 3% variation in step length, a 10% deviation in the perpendicular component (simulating lateral displacement), and a 10-degree variation in all rotations. In the simulated environment, the vision model detects significantly more ants than in the real-world setting. Its performance was deliberately limited to better approximate real-world conditions by setting a maximum number of detectable ants and randomly discarding excess detections.
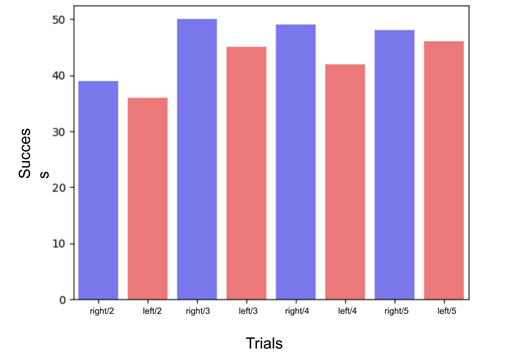
With these modifications, a path was designed within the simulation (Figure 12), and ants were placed on it, moving toward the edges. The robot starts from a random position near the center of the path, oriented toward it. A total of 50 trials were conducted in each direction to evaluate the system’s effectiveness, varying the maximum detectable ants between 2 and 5. Results are shown in Figure 13.
For the tests with a maximum of five detectable ants, the robot reached the goal in 46 out of 50 trials when taking the path to the left and 48 out of 50 trials when going right, achieving a success rate of 94%. This result validates the complete system (locomotion, detection, and decision-making) under conditions similar to a real-world environment.
When comparing performance between the cases with five and two detectable ants, a moderate decrease in success rate was observed, dropping from 93% to 75% -an 18% reduction. This decline is relatively small, especially considering that the number of ants detected by the model decreases by 60% when moving from five to two.
4.4 Conclusions
Identifying ants in an uncontrolled environment has proven to be highly challenging. The low contrast between the ants and the background causes the models to perform poorly regarding precision and recall. On the other hand, tests conducted in the simulation suggest that a system capable of detecting three or more ants (when approximately 12 ants enter the robot’s field of view at any time) should be able to follow the path without issues.
These results are auspicious, as they suggest that deploying these solutions does not require further increases in detection accuracy. In the following stages of development, we will implement these models in the robots designed for real-world testing in an uncontrolled environment. This will allow us to identify the limitations of the complete system and compare the two robot models we developed for this purpose.
5. Weed Control
5.1 Introduction
Weed control is critical in agriculture because it significantly impacts crop productivity and overall farm efficiency. Weeds compete with crops for nutrients, water, light, and space, producing substantial crop yields and quality reductions. Poor weed elimination can cause crop losses of up to 50%. In cases where weed control is absent, meaning the weeds are left uncontrolled, losses of up to 90% have been reported.
Since 2023, we have initiated multiple projects to develop a fully autonomous weed control system utilizing robots. These robots are designed to traverse agricultural fields and accurately identify and eliminate weeds -ideally without pesticide use. As has been indicated, the use of pesticides is not only costly but also detrimental to the environment. It poses significant health risks to consumers of food products exposed to these agrochemicals and the individuals who apply them. Moreover, pesticide application can reduce crop quality and notably increase the resistance of the weeds intended for removal.
5.2 Materials and Methods
5.2.1 Segmentation and Object Detection for Weed Detection
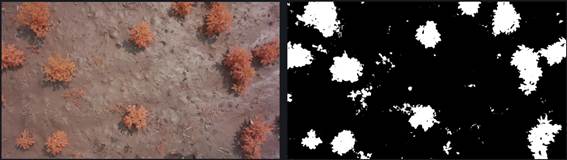
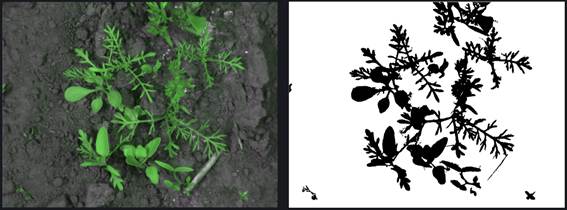
The first project initiated in 2023 focused on developing segmentation and object detection models for weed identification to enable real-time use on a robot. Object detection and segmentation are the two most popular approaches to address this problem. Object detection results in a bounding box that contains the weed of interest. In contrast, segmentation involves identifying all pixels belonging to the weed species, which can be considered a pixel-by-pixel image classification for weed detection. Figure 14 presents an image from the object detection dataset, while Figure 15 and Figure 16 show images from the segmentation datasets.
Regarding segmentation, a neural network called UNet was implemented, while a YOLO (version 8) model was used for object detection. The YOLOv8 nano version was chosen because it requires less computational power than its larger counterparts. This is crucial for deploying the model on a resource-constrained robot. Moreover, the nano model delivers adequate performance for this application.
UNet is a convolutional neural network with a U-shaped architecture. It consists of two main parts: an encoding (contracting) path and a decoding (expanding) path. This structure is typical in many neural network architectures. The encoding path is responsible for extracting the most essential features from each image. In contrast, the decoding path uses these important features identified during encoding to produce the desired output for our application, in this case, generating a segmentation map of the input image.
YOLO is considered a superior model for inference due to its speed. It enables real-time object detection on devices with limited computational power.
5.2.2 Segmentation and Object Detection for Weed Identification
The previous project, which was developed in 2023, focused on weed detection without identifying the species. In the beginning of 2024, a second project explored species identification possibilities and limitations. The main challenge in detecting weed species is the availability of high-quality data for training artificial neural network models. Consequently, the decision was made to focus on the most relevant local fruit-farming species, prioritizing those with the highest agricultural significance (e.g., Lolium, Cyperus rotundus, and Ipomoea). Due to its maturity and robustness, this project utilizes YOLO, one of the most widely adopted object detection models. YOLO has reached an advanced stage of development. By the time the project began, its tenth version and implementation were already available, ensuring a reliable and efficient foundation for our application. Given the lack of available datasets, the only viable option was to create a dataset. This task is complex, as it not only involves labeling the location of each plant within the image but also requires a thorough analysis to identify the best images that add value to the training process. The images were meticulously selected, ensuring specific angles capturing the plant at different growth stages and times of the year to achieve a comprehensive representation and improve prediction accuracy.
The first task was to acquire unlabeled images. We utilized the Global Biodiversity Information Facility (GBIF) platform, which collects plant information worldwide, including pictures of each species. The images included in GBIF were taken to document plant occurrences rather than for dataset construction. As a result, we encountered a wide variety of non-useful images. We selected the front-facing and good-quality images that could represent the problem. However, it was impossible to capture transitional growth stages or other facets due to seasonal limitations.
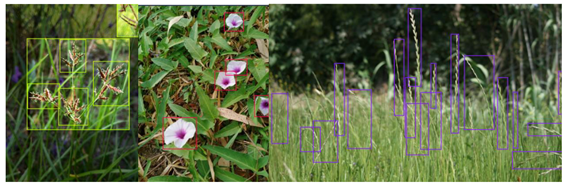
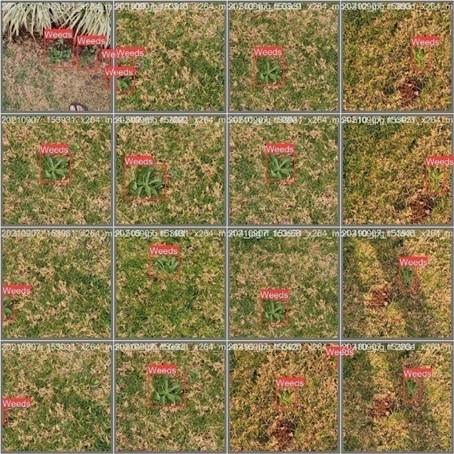
The dataset includes 300, 393, and 426 labeled images for Ipomoea, Cyperus, and Lolium, respectively. Each image has been carefully annotated to provide high-quality data for model training and evaluation. Figure 17 presents an example for each of the species.
5.3 Results
The image processing pipeline developed in the weed detection project was evaluated on the three weed datasets. Table 2 presents the results on the object detection dataset and the two segmentation datasets.
Table 2: Object detection and segmentation: F1-Score in the three datasets
| Dataset | Task | F1 score |
| Weeds Computer Vision Project | Object detection | 0.88 |
| A Crop/Weed Field Image | Segmentation | 0.91 |
| SeSame | Segmentation | 0.93 |
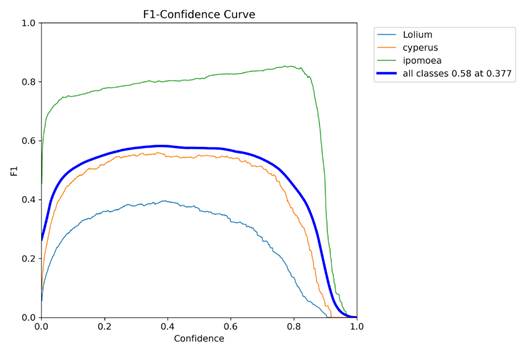
The results obtained in the weed identification project are preliminary but promising. For Ipomoea, the F1 score is notably high, exceeding 0.6 even at low confidence levels. This indicates that the system performs relatively well in identifying Ipomoea, likely due to its distinctive morphological features, which significantly differ from the background elements. Consequently, Ipomoea achieves robust performance metrics despite lower confidence thresholds.
In contrast, Cyperus and Lolium exhibit considerably lower F1 scores at similar confidence levels. This discrepancy is attributed to their greater susceptibility to being misclassified as background elements, such as common grasses or non-target weeds. The morphological similarities of Cyperus and Lolium to these background elements lead to a higher mislabeling rate, resulting in lower overall F1 scores. This highlights the challenge of accurately distinguishing these species from background clutter under conditions of low confidence.
These findings underscore the importance of refining the model to better differentiate between target species and background elements, particularly for species like Cyperus and Lolium, which exhibit more remarkable similarity to non-target species. Figure 18 presents the F1 score curves as a function of confidence for each species and the entire dataset.
5.4 Conclusions
While still in its developmental stages, the emerging weed detection system demonstrates promising potential for effective weed management. The system leverages advanced computer vision techniques, including segmentation and object detection, to identify and classify weeds with increasing accuracy. Initial results indicate that the system can detect and classify weeds with a reasonable degree of accuracy. Segmentation allows for detailed pixel-level classification, while object detection provides useful bounding boxes around detected weeds, contributing to a comprehensive approach to weed identification. Despite its promising performance, the system is still nascent and requires further refinement. Enhancements in model training, data quality, and algorithm optimization are necessary to improve accuracy and reliability. The system's ability to generalize across different environments and weed species remains a focus for future development. Currently, we are undertaking a larger-scale project supported by the Promotion Fund for Agricultural Technologies (FPTA in Spanish) of the National Livestock and Agriculture Research Institute (INIA). This project focuses on developing a fully autonomous weed control system utilizing aerial and ground-based robots.
6. Discussion
This paper explores four distinct autonomous mobile robotics applications promoted by the MINA Group at the Faculty of Engineering of the University of the Republic. These applications aim to improve agricultural practices. Each project showcases innovative approaches to addressing critical challenges in precision agriculture and pest management.
The first case study focused on apple counting and quality assessment. This system integrates advanced computer vision algorithms to automate crop monitoring, offering precise and efficient tools for orchard management. The MAGRO dataset, developed through this project, is a valuable resource for further advancements in autonomous navigation and agricultural analytics.
The second case study introduced a novel approach to pest management by using drones to detect bird pests. Utilizing image processing and machine learning, an autonomous system capable of early detection and identification of pest birds enhances crop protection strategies and reduces potential damages.
The third case study addressed ant nest localization, a critical issue in agricultural environments. By employing robotic platforms equipped with vision systems and deep learning algorithms, the system tries to identify and track ant nests with high accuracy, paving the way for more sustainable pest control methods that minimize environmental impact.
The latest case study, initiated in 2023, will be developed until 2027, utilizing both autonomous ground and aerial vehicles for weed detection and control in fruit orchards. This project integrates computer vision, neural network-based detection models, and state-of-the-art autonomous navigation algorithms, presenting significant challenges in achieving a robust system capable of operating under uncontrolled environmental conditions. By integrating cutting-edge technology, we seek to enhance the precision and efficiency of weed management, thereby reducing the reliance on chemical herbicides and promoting sustainable agricultural practices. The successful execution of this project has the potential to revolutionize traditional weed control methods, contributing to both environmental conservation and improved crop yields.
These projects exemplify the MINA Group's work to integrate cutting-edge technologies into agriculture, improving productivity, sustainability, and resilience against contemporary challenges. The successful deployment and ongoing development of these technologies underscore their potential for widespread adoption in agricultural sectors worldwide.
Looking forward, our research will continue to push the boundaries of agricultural robotics, focusing on several key areas to enhance impact and innovation:
1. Dataset Creation: We are committed to expanding our datasets and making them openly accessible to the global research community. By curating comprehensive datasets across different agricultural scenarios, we aim to facilitate advancements in machine learning and robotics for agriculture.
2. Collaboration with Agricultural Stakeholders: We will deepen our partnership with agricultural producers and researchers to co-develop solutions tailored to local realities.
3. Advancing Autonomous Robotic Solutions: We will focus on developing autonomous robotic solutions to address pressing agricultural challenges. This includes refining existing systems for crop monitoring, pest detection, and soil management and exploring new applications that enhance efficiency and sustainability in farming practices.
4. Environmental Considerations: We prioritize sustainability by developing technologies that reduce environmental impact and promote responsible agricultural practices. This includes minimizing chemical usage and optimizing resource utilization.
By following these avenues, we aim to advance the field of agricultural robotics, contribute to improving the productivity, environment, and economic viability of farming communities, and democratize agricultural technology worldwide.

