


 Inglés (pdf)
 Articulo en XML
 Referencias del artículo

 Permalink
1. Introduction
Salinization has been increased day by day due to bad agronomic practices and climate change effects1. About 7% (100 million ha) of the land of the world is affected by salt stress. Salinity poses a significant risk to crop cultivation and production in semi-arid and arid regions 2)(3) . Inappropriate water and soil management practices, high temperature, high evapotranspiration and low rainfall are the main causes of salinization in arid and semi-arid areas4. Soil salinization limits crop yield due to detrimental effects on seed germination, plant growth, and reduction in photosynthesis 5)(6) 7.
The cultivation of naturally salt-tolerant plants (halophytes) is gaining popularity in the world 8)(9) . Halophytes can be grown in different salt stress environments ranging from coastal areas to deserts10, because halophytes can tolerate higher salt concentrations with adaptations such as high uptake of potassium (K+) as compared to sodium (Na+), ions compartmentalization in the vacuole, synthesis of organic solutes, and salt secreting glands and bladders11. Halophytes are capable of not only surviving (100-200 mM NaCl) but gaining benefits from highly saline irrigation, therefore suggested for arid and semiarid agro-ecological areas. In some halophyte species/genotypes, no significant yield reduction was found even at seawater irrigations, i.e., Chenopodium quinoa Wild.
Quinoa is an annual seed plant that is highly versatile and adaptable to different environments 12)(13) and has been found to exhibit exceptional adaptability to diverse environmental conditions14. It is also classified as a facultative halophyte, meaning it can grow in high-salinity conditions, and is known to be able to produce seeds even in seawater salinity levels15. The primary mechanism behind quinoa's ability to withstand high salt stress is its efficient retention of potassium (K+) and compartmentalization of sodium in leaf vacuoles16. Several factors, such as salt concentration levels, plant growth stage, and genotype, as well as genotype × environment interaction effects, influence the capacity of plants to withstand salinity stress17. Germination and seedling stages of this plant are more susceptible to salinity stress compared to later growth stages18. Assessing the germination potential of seeds and monitoring the growth of seedlings in saline conditions are simple and practical methods for evaluating plant responses to salt stress19. Significant variations in seed germination and seedling growth traits among different genotypes of quinoa indicate that there is wide genotypic variation in this plant's response to salinity18. Cai and Gao20 reported that different genotypes of wild chenopodium quinoa display significant variation in their ability to tolerate salt strain.
The main mechanisms responsible for conferring salt tolerance in plants are ion homeostasis, leaf osmoregulation, Na+ exclusion, and K+ retention20. Inorganic solutes such as Cl-, K+, and Na+ are crucial osmolytes that play a key role in osmotic adjustment and improving the water potential of cells under salinity stress21. However, the contribution of inorganic solutes to osmotic adjustment is still under debate and depends on various factors, such as salt stress intensity, duration, and genotype.
Tissue tolerance and sodium exclusion responses observed in quinoa genotypes at different ontogenetic stages can serve as indirect indicators for assessing genetic variation22. Due to its high genetic diversity for a wide range of salt tolerance, it has been cultivated in various environments for the last seven centuries23. Abd ElMoneim and others24 and Manaa and others 25) reported that several mechanisms work together to attribute the salt tolerance in quinoa, including the plant's growth stage, genotype-specific tolerance, and genetic variation. High-affinity K+ (HAK, H-ATPase), and Na+ (NHX1, SOS1) transporters play a key role in ion homeostasis and salt tolerance. The roots and shoots of different quinoa genotypes showed the expression of various sodium transporter genes26. Quinoa genetic variation provides useful information for improving the salt tolerance genotype to adapt to diverse environmental conditions 27)(28) .
Quinoa is more sensitive to salinity during its seedling stage compared to its later growth stages18. The extent of salinity tolerance has not been determined for these specific quinoa genotypes, especially during the early stages of development. The high genetic variability in quinoa genotypes to abiotic stresses is the reason for studying the salt tolerance mechanism in quinoa genotypes at the early growth stage in the present investigation.
2. Materials and Methods
2.1 Seed Collection
Seeds of the four quinoa genotypes were collected from the Alternate Crops Lab, Department of Agronomy, University of Agriculture Faisalabad, Pakistan. These particular genotypes have been recognized and chosen by the United States Department of Agriculture (USDA) since 2008 for their excellent adaptation and promising performance in the field conditions at Pakistan. The details of genotypes are given in Table 1.
Table 1: The experiment utilized various quinoa genotypes, the details of which are as follows
| Code* | Genotype** | Origin |
| PI 596293 | UAFQ-1 | Colorado, USA |
| Ames 13730 | UAFQ-2 | New Mexico, USA |
| Ames 13737 | UAFQ-7 | New Mexico, USA |
| PI 634919 | UAFQ-9 | Chile |
Note: * means code as per the germplasm database; ** means coding of genotypes made for local identification.
2.2 Quinoa Seedling Raising
A total of fifty quinoa seeds per genotype were planted in polythene bags measuring 8×6 cm. The planting medium consisted of equal proportions of sand, silt, and compost. The sowing took place on November 1, 2012, and the seeds were left to grow at open wire-house conditions under natural environmental conditions at temperature 8/19 °C (minimum/maximum) with a 10-h photoperiod (conditions same as of growing season of quinoa in Pakistan). During the two leaf stage, seedlings of each quinoa genotype were transferred to plastic tubs that held a 20 L solution culture with half-strength Hoagland solution being changed fortnightly. The transplanted plants were held with foam on a floating thermopole sheet in a hydroponic solution29. An electric aquarium pump was utilized to provide continuous aeration. The pH of the solution was maintained within the range of 6.5 to 7.0 throughout the experiment. The tubs were positioned in open wire-house conditions, and each tub accommodated twenty plants of each quinoa genotype. Quinoa seedlings for each salinity level were cultivated in individual tubes with uniform spacing maintained both between and within rows to ensure consistent growth conditions. Upon emergence of the third true leaf, sodium chloride (NaCl) was applied twice daily at an increment of 50 mM per application. This gradual addition continued until the desired final NaCl concentration was achieved. Five different levels of salt stress were established, namely 0 mM (control), 100 mM, 200 mM, 300 mM, and 400 mM NaCl. The seedlings were allowed to grow in their respective treatment media for one month.
2.3 Measuring Na+ and K+ Levels in Roots and Leaves
To measure Na⁺ and K⁺ ion concentrations, fully expanded top leaves (emerged under the stress condition) and corresponding roots were collected from each treatment after one month of exposure to salt stress. These samples were then oven-dried. The dried leaf and root tissues were separately placed in glass tubes and digested using 25 mL (milliliter) of a 1% HNO3 solution on a hot plate at a temperature of 85 °C for 4 hours. Following digestion, 1 mL of the digested sample solution was transferred to a separate measuring cylinder. Distilled water was added to the cylinder to achieve a final volume of 10 mL, resulting in a diluted solution. The absorbance of Na+ and K+ ions in the diluted solution was then measured using a flame photometer (Sherwood, UK, Model 360), following the protocols established by Shavrukov and others30 and Munns and James31.
2.4 Recording of Morphological and Growth Traits
After one month of transplanting the seedlings in the hydroponic medium, a random selection of five plants from each treatment was chosen. These plants were carefully unplugged to measure their morphological and growth traits. The length of both the roots and shoots was measured using a centimeter scale. Additionally, the fresh weights of the roots and shoots were recorded with a digital weight balance. The dry weights were then measured of the roots and shoots after drying the samples in an oven set at 60 °C until a constant dry weight was achieved.
2.5 Leaf Senescence
After one month of transplanting the seedlings in the hydroponic medium, the leaf senescence was manually counted from five plants of each quinoa genotype in both salt-treated and non-treated tubes, and calculated the average number of senesced leaves.
2.6 Statistical Data Analysis
The statistical software Statistics (version 8.1) was utilized to perform ANOVA with a completely randomized design (CRD) factorial arrangement of the data, with four replications for each treatment. Standard error bars in the graph indicate the mean values at 5% probability level. Metabo-Analyst (Version 5.0) created a heat map, correlation, and PCA (principal component analysis).
3. Results
3.1 Shoot and Root Growth of Quinoa Genotypes under Different Salt Stress
To evaluate the impact of salinity stress on plant biomass production, shoot fresh weight and shoot dry weight were assessed. The analysis revealed highly significant differences (P ≤ 0.05) among the quinoa genotypes, salinity levels, and their interaction (Figure 1a-b). Interestingly, shoot dry weight increased for all genotypes at 100 mM NaCl, but declined with further increases in salinity. Among the genotypes, UAFQ-7 and UAFQ-2 consistently recorded higher shoot dry weights compared to UAFQ-1 and UAFQ-9 across all salt concentrations. Notably, UAFQ-2 and UAFQ-7 maintained comparatively better growth under 300 mM NaCl, whereas UAFQ-1 and UAFQ-9 experienced sharp declines in shoot biomass at 300 and 400 mM salt stress levels.
To understand how root development responds to salinity, root fresh weight and root dry weight were examined. These traits also showed significant differences (P ≤ 0.05) among genotypes, salinity treatments, and their interactions (Figure 1c-d). Root fresh weight significantly declined at 300 and 400 mM NaCl across all genotypes. However, UAFQ-2 and UAFQ-7 maintained higher root fresh weights than UAFQ-1 and UAFQ-9 under these higher salinity levels (Figure 1c). A significant increase (P ≤ 0.05) in root dry weight was observed for all genotypes at 100 mM NaCl compared to the control (0 mM), followed by a progressive decrease at 300 and 400 mM. UAFQ-2 and UAFQ-7 genotypes exhibited higher root dry weights than UAFQ-1 and UAFQ-9 at 200 mM and 300 mM salt stress (Figure 1d).
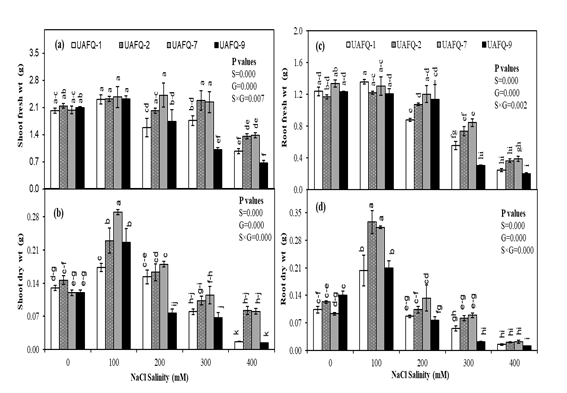
Figure 1: Effects of increasing NaCl salinity on growth traits of quinoa genotypes under hydroponic conditions: (a) Shoot fresh weight, (b) Shoot dry weight, (c) Root fresh weight, and (d) Root dry weight
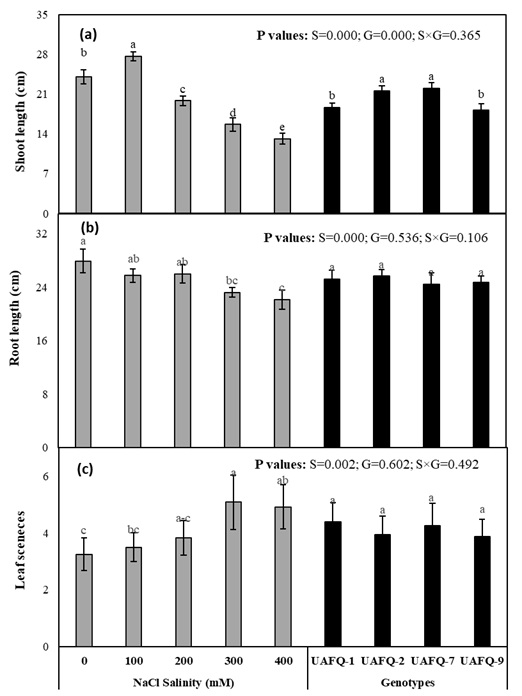
To assess the effects of salinity on plant morphology, shoot and root lengths were measured. Significant differences (P ≤ 0.05) were observed among salinity levels only (Figure 2a-b). Shoot length increased at 100 mM NaCl in all genotypes but declined at higher salt concentrations. UAFQ-7 and UAFQ-2 exhibited longer shoots compared to UAFQ-1 and UAFQ-9 across all salinity levels. Root length, on the other hand, steadily decreased with increasing salinity stress. However, differences among genotypes and genotype × salinity interactions were not statistically significant for both shoot and root lengths (Figure 2a-b).
3.2 Ionic Contents in Leaf and Root of Quinoa Genotypes under Different Salt Stress
The analysis of root K⁺, root Na⁺, and leaf Na⁺ contents revealed highly significant differences (P ≤ 0.05) among quinoa genotypes, salinity levels, and their interaction (Figure 3a-c). Root Na⁺ concentration increased progressively with rising salinity across all genotypes. At 400 mM NaCl, UAFQ-1 and UAFQ-9 showed higher Na⁺ accumulation in leaves compared to UAFQ-2 and UAFQ-7 (Figure 3c), while UAFQ-2 had the highest Na⁺ accumulation in roots at this stress level (Figure 3b). Conversely, root K⁺ content declined gradually with increasing salinity in all genotypes (Figure 3a).
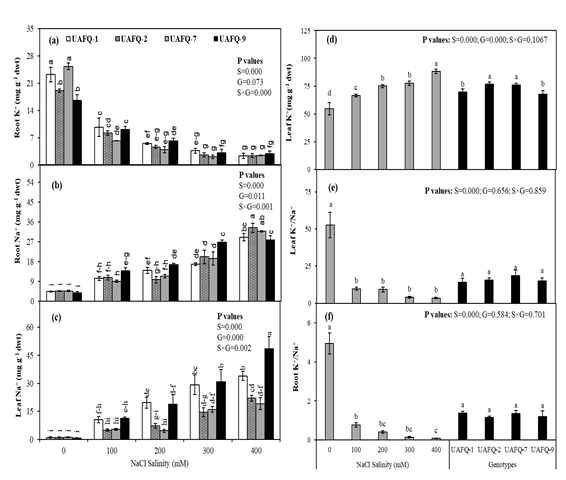
Figure 3: Effects of increasing NaCl salinity on ion concentration of seedling’s organs of quinoa genotypes under hydroponic conditions: (a) root K+, (b) root Na+, (c) leaf Na+, (d) leaf K+, (e) leaf K+/Na+ratio, and (f) root K+/Na+ ratio
In contrast, the effects of genotype and genotype × salinity interaction were not significant for leaf K⁺, leaf K⁺/Na⁺ ratio, and root K⁺/Na⁺ ratio -except for leaf K⁺ content, which differed significantly among genotypes (Figure 3d-f). Leaf K⁺ content showed a significant increase (P ≤ 0.05) under elevated salinity, with UAFQ-2 and UAFQ-7 maintaining higher K⁺concentrations across all NaCl levels compared to UAFQ-1 and UAFQ-9 (Figure 3d). The peak leaf K⁺ content was observed at the highest salinity level. Moreover, the K⁺/Na⁺ ratio in both roots and leaves significantly declined under 400 mM NaCl stress, highlighting the ionic imbalance and disruption in ion homeostasis induced by severe salt stress (Figure 3e-f).
3.3 Leaf Senescence of Quinoa Genotypes under Different Salt Stress
The number of senesced leaves per plant was also evaluated (Figure 2c). Significant differences (P ≤ 0.05) were observed among salinity levels, whereas differences among genotypes and genotype × salinity interactions were not statistically significant. Leaf senescence decreased in all quinoa genotypes as salinity increased from 0 to 300 mM NaCl. However, at 400 mM NaCl, UAFQ-1 and UAFQ-7 exhibited higher leaf senescence compared to the other genotypes.
3.4 Heat Map and Correlation Analysis
The clustering clearly distinguishes treatments based on salinity severity, with higher Na⁺ accumulation (especially in root and leaf tissues) observed under 300 and 400 mM NaCl treatments, predominantly highlighted in red. This pattern indicates a strong ionic response under severe salt stress. In contrast, lower Na⁺ levels are associated with 0 and 100 mM treatments, represented by green hues (Figure 4). K⁺ content in both root and leaf tissues generally declined with increasing salinity, particularly under 400 mM NaCl, where values shifted toward darker shades, suggesting ion imbalance. Leaf K⁺/Na⁺ ratio also followed this trend, decreasing with salt intensity. Growth parameters, including shoot fresh weight (SFW), shoot length (SHL), root fresh weight (RFW), root dry weight (RDW), and seed dry weight (SDW), were negatively impacted by increased salt levels, clustering in the lower value (green to black) zones at high NaCl concentrations (Figure 4). Overall, the clustering distinguished genotype-specific responses, with certain combinations (notably UAQ #4 under 200 and 300 mM) showing better maintenance of K⁺ levels and growth traits, indicating potential salt tolerance (Figure 4).
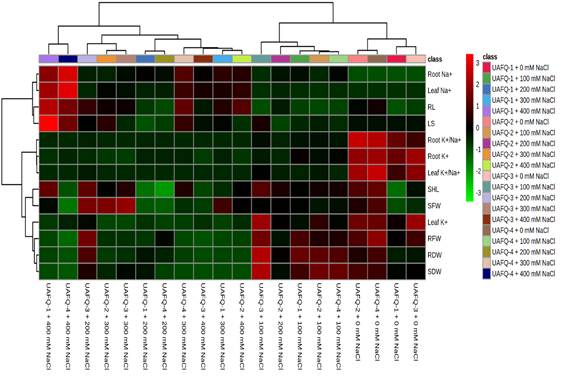
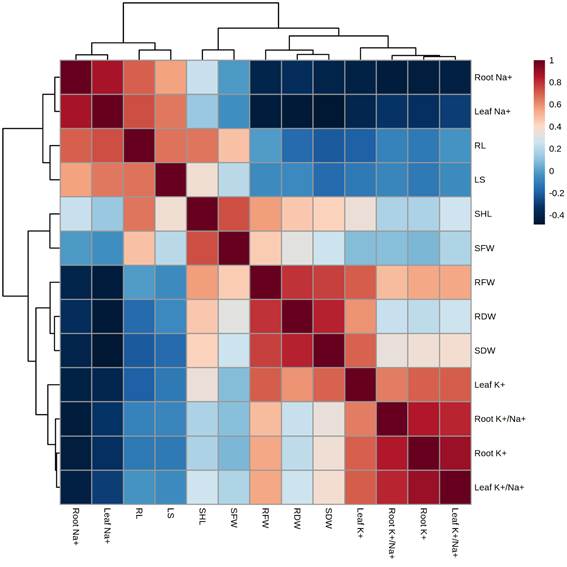
Figure 4: Unsupervised hierarchical cluster analysis of four quinoa genotypes subjected to five salinity treatments, as indicated in the class bar
Moreover, a Pearson's correlation analysis was carried out between different studied parameters of quinoa genotypes exposed to salt stress (Figure 5). The correlation analysis showed that root Na+ and leaf Na+ were positively correlated with RL (root length), LS, SFW, and SFW (Figure 6). Similarly, SFW, RFW, SDW, root K+, root K+/Na+, and leaf K+/Na+ were positively correlated with SFW, RFW, SDW, leaf K+, root K+/Na+, root K+, and leaf K+/Na+ (Figure 5). On the contrary, root Na+ and leaf Na+ were strongly negatively correlated with RFW, RDW, SDW, leaf K+, root K+/Na+, root K+, and leaf K+/Na+ (Figure 5). Overall, this correlation indicated a close relationship between salinity-induced shoot and root growth, and leaf and root Na+, K+, and Na+/K+ ratio.
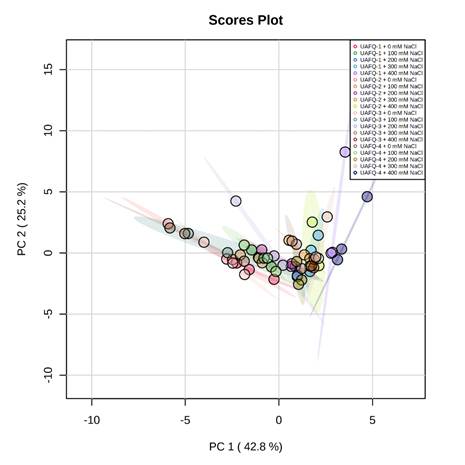
3.5 Principle Component Analysis (PCA)
To evaluate the effect of NaCl salt stress on studied parameters of quinoa genotypes, the score plot of PCA was executed (Figure 6). The first two components, PC1 (PC1, 42.8%) and PC2 (PC2, 25.2%), showed the highest contribution and represented 68% of the total variance in the dataset. Concerning salinity stress conditions, the same treatments in different quinoa genotypes were clustered in the neighbourhood. On the other hand, the different treatments were split realistically by the first two components (Figure 6). Some treatments had positive and negative correlations in PC1 and PC2 components.
4. Discussion
Despite exhibiting characteristics similar to those of a facultative halophyte, quinoa displays significant genetic variability in terms of salt tolerance across various salt and climate conditions32. Halophytes are plants that thrive in high-salinity environments and possess remarkable adaptation mechanisms. Quinoa cultivars have been genetically improved and successfully adapted to various dryland conditions by researchers14. Different cultivars of quinoa have demonstrated varying degrees of tolerance to abiotic stresses, especially saline stress 33)(34) , as the findings of this study support the notion that quinoa genotypes have significant potential to withstand salinity, as indicated by Figure 2, Figure 3, and Figure 4.
In the soilless culture system, all quinoa genotypes showed an increase in leaf Na+ content. However, genotypes UAFQ-2 and UAFQ-7 exhibited relatively lower Na+ levels in their leaves compared to UAFQ-1 and UAFQ-9 (Figure 3c). This suggests that UAFQ-2 and UAFQ-7 have a higher degree of salt tolerance, as they were able to maintain lower Na+ accumulation in their leaves under the given conditions (Figure 3c). The presence of high levels of Na+ can be harmful to both glycophytes and halophytes, making it advisable to steer clear of such concentrations35. The accumulation of toxic ions like sodium (Na+) and chloride (Cl-) within cells can hinder metabolic processes by inhibiting the activation of enzymes and hormones 36)(37) .
Salinity stress imposes a broad spectrum of inhibitory effects on quinoa growth by disrupting critical physiological and biochemical processes 37)(38) . Quinoa grown in highly saline soils often displays stunted growth, driven by salt-induced challenges such as osmotic stress, nutrient imbalances, ion toxicity, oxidative damage from elevated reactive oxygen species, and disturbances in hormonal balance38. Excessive sodium (Na⁺) accumulation in leaves negatively impacts stomatal conductance, Rubisco activity, intercellular CO₂ concentration, chlorophyll content, and sucrose synthesis39. These physiological disruptions collectively result in a marked decline in photosynthetic efficiency, transpiration rate, and leaf water potential, especially seedling stage of quinoa development 39)(40) .
Halophytes plants more efficiently dump or accumulate the Na+ in the vacuole of their leaves16. A similar result was observed in this study, all quinoa genotypes, especially UAFQ-2 and UAFQ-7, accumulated lower leaf Na+ (Figure 3c) than in root Na+ (Figure 3b). As a whole-body response, quinoa restricts Na+ in the leaf. Moreover, quinoa plants accumulate the excess Na+ in their specialized structure on leaf epidermal cells called salt glands, which excrete salt actively41. The limited accumulation of Na in plants may be associated with the uptake of K+ at the root parenchyma and its subsequent transport to the leaves.
K+ accumulation was observed higher in UAFQ-2 and UAFQ-7 leaves as compared to the rest of the genotypes (Figure 3d). Salt stress leads to an increase in the K+ content in both the root and leaves of quinoa plants. This accumulation of inorganic solutes allows the plant to maintain turgor potential and decrease transpiration under salinity stress. The excretion of K+ from the root into the xylem facilitates its movement toward the leaves, and the increase in potassium levels in the leaves can be attributed to the exchange of Na+ and K+ in the root's proximal region16. Loss of K+ from leaves in response to salt stress can activate caspase-like protease, triggering programmed cell death and enhancing leaf senescence20, as reported in this study (Figure 2c). Quinoa plants have been reported to increase K+ accumulation and retention in plant tissue, particularly in leaves 20)(41) . Inorganic ions such as K+ and Na+ exhibit stronger correlations with salinity tolerance and contribute more to osmoregulation than organic solutes20. The K+/Na+ ratio is considered an important criterion for genotype selection and is used as an index of salinity tolerance3. In this hydroponic study, the leaf K+/Na+ ratios of UAFQ-2 and UAFQ-7 were found to be higher compared to UAF-Q1 and UAFQ-9. This study suggests that these genotypes have good ion homeostasis and salt tolerance mechanisms. Physiological traits such as reduced Na⁺ influx, enhanced K⁺ uptake, higher shoot K⁺:Na⁺ ratio, and elevated chlorophyll content have been recognized as key indicators associated with salinity tolerance in quinoa42. Salt-tolerant quinoa genotypes show increased expression of genes such as Cq-NHX1 and Cq-SOS1, which are expressed in both root and leaf cells. Cq-NHX1 helps in Na sequestration in vacuoles and is located on the tonoplast membrane, while Cq-SOS1 is involved in Na exclusion and is located on the plasma membrane43. Various studies have demonstrated the interrelationship between HKT1 and SOS1 transporters, showing that, under saline conditions, HKT1 expression decreases while SOS1 expression increases, facilitating the movement of sodium ions toward the aerial parts of the plant44. The ionic transport mechanisms in the roots play a critical role in sodium partitioning, influencing the expression levels of key sodium transport genes such as SOS1, NHX1, and HKT1. The HKT1 transporter -expressed in the plasma membrane of xylem parenchyma cells- functions by retrieving sodium from the xylem sap, thereby reducing the transport of sodium to the aerial parts. This mechanism helps to protect the photosynthetic tissues from sodium toxicity. In contrast, the SOS1 transporter, located on the plasma membrane of root epidermal cells, acts to exclude sodium from the cytoplasm, exporting it back into the soil45.
A significant positive effect has been observed on shoot and root growth of quinoa genotypes at 100 mM NaCl salt stress level, as shown in Figure 1a-d, and Figure 2a-b. This finding is consistent with the study conducted by Ruiz-Carrasco and others43, which demonstrated that moderate salinity stress can stimulate the growth traits of quinoa and other salt-tolerant species. Therefore, this level of salinity can be considered optimum for quinoa growth. At the seedling growth stage, i.e. shoot, root fresh weight, shoot, root dry weight, it has been reported that the threshold level of salinity tolerance in quinoa is around 80 mM among different genotypes, as indicated by Maleki and others19. Notably, when salt concentrations exceeded 100 mM NaCl, the growth of the quinoa plants was adversely affected, particularly at higher salinity levels found at sea level (599 mM). However, it is worth mentioning that quinoa plants were still able to survive and thrive even under sea-level concentrations of salt. The reduction in biomass production in halophytes due to high salinity in the growth medium is a common phenomenon, as supported by studies conducted by Iqbal 5)(16) . Variations in sodium transporter gene expression among quinoa genotypes result in differences in biomass production under salinity stress. The decrease in biomass with increasing salt accumulation can be attributed to the energy required for osmotic adjustment during plant growth, which can have detrimental effects. The accumulation of Na+ leads to oxidative damage, which can be mitigated by increased production of antioxidant enzymes to enhance plant survival, ultimately leading to reduced biomass production18 as results designated in this study, especially genotypes UAFQ-2 and UAFQ-9 (Figure 1). Derbali and others17 reported that salinity stress can lead to a reduction in plant growth, which is influenced by factors such as salt concentration, plant organs, and genotypes.
High salt stress (200-400 mM NaCl) significantly affects both morphological traits, such as root length, root dry matter, shoot dry matter, and plant height 46)(47) , and metabolic parameters, including amino-acid content, protein content, chlorophyll concentration, proline accumulation, phenolic content, and electrolyte leakage. As NaCl concentration increases, electrolyte leakage also intensifies, leading to the generation of reactive oxygen species (ROS) that damage vital macromolecules, such as proteins 48)(49) . Under high salinity stress, significant changes were observed in the concentrations of sugars, amino-acids, glycine betaine, and organic acids in quinoa plants. Glycine betaine, in particular, functions as an osmoprotectant that supports plant growth under saline conditions, accounting for up to 6% of leaf dry matter50. Quinoa possesses a sodium (Na⁺) exclusion mechanism that helps mitigate the ionic component of salinity stress. Moreover, it enhances osmotic adjustment in response to elevated salt levels51. Additionally, the presence of salt glands on the leaf surface facilitates the storage and excretion of salts, serving as an important tolerance mechanism in quinoa, as a halophytic species48.
Al-Naggar and others52 evaluated 19 quinoa genotypes at the germination and seedling stages under high salinity stress (3000-9000 ppm NaCl). The study reported that salinity stress significantly reduced most germination traits (germination percentage, germination rate, speed germination index) and seedling traits (seedling length, shoot length, root length, seedling fresh and dry weight, seedling vigor index), except for mean germination time, which increased. Based on the correlation between the salinity tolerance index and various traits, root length, seedling weight, and seedling vigor were recommended as key selection criteria for breeding salt-tolerant quinoa genotypes. Manaa and others25 and Negrão and others53 proved that plants exhibit salinity tolerance via multiple mechanisms, which are influenced by various factors, like plant development stage, genotype tolerance, and genotype-environment interaction, as validated by the results presented in this study (Figure 5 and Figure 6). The detection of tolerant genotypes via genetic diversity can potentially lower the expenses involved in the restoration of saline soil53.
Our study primarily focuses on evaluating ion-specific adaptations and seedling growth performance under hydroponic conditions in four selected quinoa germplasms. While it provides valuable initial insights, further research is necessary to identify and characterize the salt-tolerant genes or transporters responsible for the enhanced performance of the selective genotypes (UAFQ-2 and UAFQ-7) under high salinity stress. Previous studies in halophytic crops, e.g. quinoa, suggest that vacuolar compartmentalization of Na⁺, upregulation of ion transporters (e.g., HKT1, SOS1, NHX1), and antioxidant defense systems may contribute to such tolerance. Future research should explore these physiological and molecular traits in UAFQ-2 and UAFQ-7 to validate their adaptive strategies and identify candidate genes for breeding applications.
5. Conclusions
This study was conducted to identify salt-tolerant quinoa genotypes by evaluating genotype × environment interactions at the early seedling stage, a critical period that often determines plant establishment and subsequent yield potential under stress conditions. Our findings revealed significant genotypic variation in response to salinity stress, indicating a strong potential for selecting and breeding quinoa lines with enhanced salt tolerance. Among the evaluated genotypes, UAFQ-2 and UAFQ-7 consistently outperformed others in key growth parameters (shoot/root biomass and length) under increasing levels of NaCl stress. These genotypes demonstrated the ability to maintain higher K⁺/Na⁺ ratios, suggesting efficient ion homeostasis and selective ion uptake mechanisms traits that are often associated with salt tolerance in plants. The accumulation of Na⁺ in leaf and root tissues was closely linked to growth suppression, while better-performing genotypes restricted Na⁺ uptake and retained higher potassium levels, thereby minimizing ionic toxicity and preserving metabolic functions. While UAFQ-2 and UAFQ-7 were identified as salt-tolerant at the seedling stage, the underlying physiological and molecular mechanisms, such as enhanced Na⁺ exclusion, K⁺ retention, and tissue tolerance, remain to be elucidated. In conclusion, UAFQ-2 and UAFQ-7 demonstrate strong potential as donor genotypes for the development of salt-tolerant quinoa varieties and provide valuable material for future physiological and genetic studies aimed at improving salinity stress resilience.

