


 Articulo en XML
 Referencias del artículo
 Curriculum ScienTI
 Permalink
1. Introduction
Uruguayan dairy exports account for more than 70% of the milk processed yearly1. The country ranks ninth globally in dairy export on a milk equivalent basis, following the European Union, New Zealand, United States, Belarus, Australia, United Kingdom, Argentina, and Saudi Arabia2. Over the last 20 years (2000-2020) the dairy sector registered a compound annual growth rate (CAGR) of 2.5%, there was an increase in the number of cows of 0.3%, and a yearly reduction in land of 1.3%3. At the same time, the dairy sector lost 37% of farms (-2.3% CAGR)3, which shows the concentration process associated with the intensification.
In Uruguay there are five pastoral dairy systems (PDS) identified as intensification pathways based on rotation, roughage production, concentrate use, stocking rate, and use of available genetic animal potential. The PDS identified were: Extensive, Improved, Organized, Controlled, and Advanced4. In 2010, the adoption level of PDS was evaluated. The share of adopted farms was: Extensive 6%, Improved 45%, Organized 18%, Controlled 26%, and Advanced 5%4. This showed the opportunity to increase the adoption of more intensive systems. Fariña and Chilibroste5 mentioned that the country's dairy industry has opportunities to increase its production without losing competitiveness by doubling its homegrown forage intake through increasing stocking rate5.
The world dairy sector needs to re-evaluate the farming system to improve efficiency and competitiveness6. The identification of different types of dairy farm systems is very important to develop sectoral growth strategies; it allows a better understanding of the diversity at the farm level to design policies 7)(8) or develop technologies9 focused on dairy systems typology.
This research aims to develop a typology by cluster analysis from the Dairy Farm Survey 2019 to describe different types of dairy farms and determine their economic performance.
2. Materials and methods
A typology using cluster analysis involving the simultaneous presence of various classificatory principles10 was developed to identify different farming systems. Variables related to cow feeding and farm management were used.
2.1 Data and information
The database used was from the Dairy Farm Survey 2019 developed by Instituto Nacional de la Leche (INALE: Dairy Institute of Uruguay) and Oficina de Planificación y Políticas Agropecuarias del Ministerio de Ganadería Agricultura y Pesca (OPYPA-MGAP) 11)(12) . The sample from MGAP - Sistema Nacional de Identificación Ganadera (SNIG), División Contralor de Semovientes (DICOSE) annual declaration 2018 considered dairy farms with ten or more cows; farms with more than 1,000 cows were forcibly included, and remaining cases were selected considering milk produced and total land (they represent other farms of their number of cow’s class)11. The sample included 301 dairy farms (defined as a management unit). The weighting factors considered to expand the sample were the number of farms and milk produced11. The sample represented 2,221 dairy farms (91% of those delivering in the country). The survey collected data from 07/01/2018 to 06/30/2019.
For the analysis, we considered specialized milk delivery farms with 50% or more of their income from this activity (six cases did not meet this condition), and only pasture-based farms were included. The final sample involved 294 farms.
To distinguish family farms in each group, we used the definition criteria of family farms from MGAP (Resolution N° 1.013/016)13, considering: land (500 ha CONEAT Index 100 or less), hired work (up to two workers), farmer residence (in farm or less than 50 km away), and off-farm income (up to USD 19.590 in 2018/19 season).
The estimation of the cow dry matter intake (DMI) initiates with the measurement of the energy required to produce the total solids reported. By considering the quantities of concentrate feed and roughage reserves administered, the amount of pasture consumed is subsequently derived as the difference between energy required and energy consumed (Annex 1). We conducted dry matter estimation utilizing coefficients derived from national data14.
The milk production was standardized from the natural content of solids using the methodology proposed by Hemme15, where Solid Corrected Milk (SCM) = milk production * (fat % + true protein %)/ 7.3.
All the statistical analysis was developed using IBM SPSS Statistics 28®.
Fourteen cases were considered outliers and removed from the data set based on the Mahalanobis Distance 10)(16) considering concentrate, roughage, and grass DMI. The final sample had 281 cases that represented 2,021 farms.
2.2 Dairy farms typology
To develop the analysis, we used indexes that describe the way the cows were fed and the farm management. The following procedure is shown in Figure 1. The selected variables were cow productivity (liters per cow per year, L/cow), stocking rate (cows per cow ha, cow/cow ha), land productivity (liters per cow ha, L/cow ha), and cow intake: concentrate, roughage and grass (kg DMI/cow ha). As an example of other variables tested and removed, we considered soil quality (CONEAT index) and cow body weight. The selected variables have some small and moderate correlation that allows the use of cluster analysis (Table 1).
The method employed to define the number of clusters was the Hierarchical Cluster Analysis using the Ward Method and Euclidean Distance as interval measure and Z standardized values. The determined adequate quantity was six. Then, the farms were classified into six types with the non-hierarchical K-Means Cluster Analysis, which identified groups of cases that were more similar to each other based on selected characteristics.

Table 1: Correlation analysis of variables used in the typology
| Cows' productivity (L/cow) | Stocking rate (C/cow ha) | Land productivity (L/cow ha) | Concentrate intake(kg DMI/cow ha) | Roughage intake (kg DMI/cow ha) | Grass intake (kg DMI/cow ha) | |
| Cows' productivity (L/cow) | 1 | -0.002 | 0.570** | 0.350** | 0.115** | 0.179** |
| Stocking rate (C/cow ha) | -0.002 | 1 | 0.781** | 0.682** | 0.497** | 0.783** |
| Land productivity (L/cow ha) | 0.570** | 0.781** | 1 | 0.764** | 0.481** | 0.737** |
| Concentrate intake (kg DMI/cow ha) | 0.350** | 0.682** | 0.764** | 1 | 0.505** | 0.387** |
| Roughage intake (kg DMI/cow ha) | 0.115** | 0.497** | 0.481** | 0.505** | 1 | -0.002 |
| Grass intake (kg DMI/cow ha) | 0.179** | 0.783** | 0.737** | 0.387** | -0.002 | 1 |
** The correlation is significant at the 0.01 p-value (bilateral).
2.3 Types characterization
The characterization includes the average value of the main variables and indexes for each type. We included the expanded sample (see criteria in 2.1) to represent the Uruguayan dairy sector.
From secondary sources (DICOSE Declaration)(private collection; unreferenced), we had access to the number of cows, total land, and total milk production of the 2014/2015 season for every farm. The evolution of farms in the last 5 years (2014/15-2018/19) was measured by the Compound Annual Growth Rate (CAGR) for milk production, total land, cows, and cow productivity. We only considered production CAGR between -20% and +20%.
2.4 Economic performance season 2018/19
We selected a set of indicators from the bibliography to evaluate the economic performance and the relationship with competitiveness and sustainability of each system 15)(17) 18. The chosen indicators, their definition and dimensions evaluated, and their impact (positive or negative) was presented in Table 2, while in Annex 2 the calculation is explained. To assess social sustainability two new rates were defined: one comparing the family farm income with all the people who live in rural areas per family person, and another to know the relevance of off-farm work over farm income (two last indicators of Table 2).
We developed a Microsoft Excel® book to calculate indicators using technical average coefficients obtained from Survey 201911 and 2014 12) and average prices (milk, inputs, services, etc.). The estimated results were for seasons 2018/19 in USD (average exchange rate of 33.0 pesos), considering the average price for more than 100 items: inputs prices, product prices (milk, meat, cash crops), and estimated asset values.
3. Results
According to the National Dairy Survey 201912, the number of milk delivery farms was 2,430. The survey represented 89% with 2,221 farms and 81% of milk produced (represented 1,766 million liters from 2,173 million total milk delivery farms)12. The average size of these farms was 227 ha (145 cow ha), with 144 cows per farm producing 736,368 milk liters per year (51,902 kg milk solid)12. The main productive indicators were 5,082 L/cow ha, and 5,128 L/cow with a stocking rate of 0.99 cow/cow ha12.
3.1 Characterization of systems
Analyzing the main descriptive results of the six groups, we identified two feeding strategies from the study. One strategy focused on grass intake, High Grass (HG) with more than 60% of grass in total cows DMI, and the other labeled High Supplementation (HS) had less than 60% of the grass portion on the cow’s diet (Table 3). Each strategy involves half of the farmers and includes the same proportion of the total milk produced.
Each feeding strategy involves three farmer types with different levels of intensification (land productivity liters/cow ha). We named them with numbers 1 (the most extensive), 2 (medium), and 3 (more intensified). The cluster's center value for each classificatory variable is exhibited in Table 3.
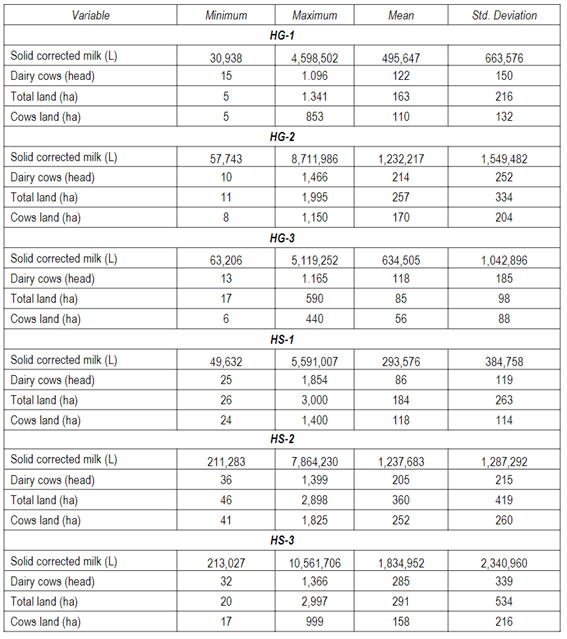
Table 4 presents the minimum, maximum, and average values for the variables that describe farm types. The minimum values of milk production (a measure of farm size) were similar in the case of HG-1 and HS-1 types. Maximum values over 4.5 million liters were found in the groups HG-2, HS-2, and HS-3. This wide range of possible values showed that all farm sizes were represented in almost all farm types (Table 4).
The more intensive systems with more than 2 cow/cow ha involved only 6% of farms, of which 4% focused on grass intake (HG-3; 87 farms), and 2% on supplementation (HS-3; 47 farms). HG-3 was the most intensive system based on grass and was the smallest in terms of land size. On the other hand, the most intensive system with high supplement intake, HS-3, is the largest, with more than three times the area of HG-3. The systems that concentrate the higher quantity of farms were HS-1 and HG-1 (28% and 27%); they were the more extensive systems. The systems HG-2 and HS-2 are, on average, the largest farms, only overcome by HS-3 (see Table 4).
Table 2: Indicators definition and dimension evaluated
| Indicator | Definition | Dimension evaluated 1 |
| Land productivity (kg milk solid/cow ha) | Milk produced over Land used by cows | Productive (+) |
| Cow productivity (kg milk solid/cow) | Milk produced over Total cows (milking and dry cows) | Productive (+) |
| Stocking rate (kg cow/cow ha) | Total cows (body weight) over Land used by cows | Productive (+) |
| Labor productivity (kg milk solid/worker) | Milk produced over Number of workers | Productive (+) |
| Concentrate utilization (kg DMI/kg milk solid) | Quantity of concentrate intake over Milk produced | Productive (+) |
| Feed consumed efficiency (kg milk solid/ton DMI) | Milk produced over quantity of Dry matter consumed (concentrate, roughage and grass) | Productive (+) |
| Unitary cost (USD/L) | Unitary milk cost (including opportunity cost) over milk delivered | Economic sustainability and competitiveness (-) |
| Entrepreneur's income to turnover | (Total receipt minus total expenses (cash and depreciation) minus total opportunity costs) over Total receipt | Economic sustainability (+) |
| Economic Farm Surplus, EFS (USD/ha) | (Total receipt minus total expenses (cash and depreciation) minus Calculated family labor (opportunity costs) over Total farmland | Economic sustainability (+) |
| Return on investment (ROI operating) (%) | (Total revenue minus total expenses (cash) minus calculated family labor opportunity costs) over Total farm assets | Financial performance (+) |
| Return to labor (USD/hour) | (Entrepreneur’s income plus labor added value) over Quantity of labor hours | Resources efficiency (+) |
| Return to land (USD/ha) | (Entrepreneur’s income plus Total land cost) over Total land | Resources efficiency(+) |
| Dairy investment per cow (USD/cow) | (Buildings plus machinery) over Total number of cows | Resources efficiency (-) |
| Liquidity (USD) | Net cash balance | Resilience (+) |
| Operating profit margin (%) | (Operating receipts minusTotal cash cost (including rent, hired labor, interest and Calculated family labor)) over Operating receipts | Resilience (+) |
| Family income over Minimum national wage rate | (Total revenue minus total expenses (cash) plus calculated family labor (opportunity costs) over family workers) over Minimum national wage | Social sustainability (+) |
| Family income over Average income rural household rate | (Total revenue minus total expenses (cash) plus calculated family labor (opportunity costs) over family workers) over Average income for rural household per capita | Social sustainability (+) |
| Off-farm income to Farm receipt rate | Total off-farm receipt over Total farm receipt | Social sustainability (-) |
1 (+): look for higher value; (-): look for lower value. Source: Based on Shoemaker17, Hemme15, Ferris18
Table 3: Classification parameters expressed as means for each system, grass portion, number of cases and farms represented
| System | HG-1 | HG-2 | HG-3 | HS-1 | HS-2 | HS-3 |
| Cow productivity (L/cow) | 4,001 e | 5,879 c | 5,473 d | 3,465 a | 6,148 b | 6,250 b,c |
| Stocking rate (cow/cow ha) | 1.18 e | 1.26 d | 2.12 b | 0.75 a | 0.82 c | 2.07 b |
| Land productivity (L/cow ha) | 4,544 f | 7,266 d | 11,401 e | 2,488 a | 4,992 c | 12,881 b |
| Concentrate intake (kg DMI/cow ha) | 958 f | 1,558 d | 2,266 e | 640 a | 1,150 c | 3,625 b |
| Roughage intake (kg DMI/cow ha) | 1,040 a | 1,427 c | 1,472 c | 966 a | 1,321 c | 4,049 b |
| Grass intake (kg DMI/cow ha) | 4,060 e | 4,589 b | 8,355 d | 2,091 a | 2,557 c | 4,987 b |
| Grass portion (% DMI) | 68 e | 62 d | 69 e | 57 a | 51 c | 39 b |
| Cases | 72 | 59 | 11 | 64 | 65 | 10 |
| Dairy farms represented | 547 | 373 | 87 | 561 | 406 | 47 |
Note: differences appearing with different subscript letters in the same row are significantly different at p< 0,05 in the two-sided equality test for column means. Tests are adjusted for all pairwise comparisons within a row of each innermost sub-table using the Bonferroni correction.
3.1.1 High Grass (HG) strategy
HG-1 was the less intensive type of strategy and produced 496 thousand liters of SCM yearly (Table 4). Regarding HG-1 size, it did not present significant differences with the most intensive system of the strategy (HG-3), with 122 cows/farm, but this group had two times their land (163 vs. 85 ha, and 110 vs. 56 cow ha, for HG1 and HG-3, respectively, Table 5). Despite maintaining a stocking rate nearly 20% higher than the national average, HG-1 had the worst performance indicators of the strategy associated with the stocking rate, 1.18 cow/cow ha (or 567 kg cow body weight/cow ha), and the worst cow, labor, and land productivity (Table 6). This poor performance was associated with a small level of dry matter consumed of grass, concentrate, and roughage measured per cow ha (Table 3). The milk production growth was 1.28% CAGR in the last 5 years, supported by a significant increase in the number of cows (3.01%) and more land (2.14%), but a reduction in cow productivity (Table 7). System HG-1 involved 27% of farms that produced 18% of the total milk in the study. Family farms represented 80% of the farms, and 62% had family women participating in the farm work (Table 8). Nearly half of the farms in this group had bank liabilities, and almost one-third received off-farm income (Table 8). Related to farm management, nearly 30% of the farms had cash flow records and the same share calculated feeding margins, though only 21% had economics records (Table 8).
System HG-2 involved 18% of farms that produced 30% of the total milk. This system comprises the largest HG farms, with production more than two times larger than the other systems, with an average of 1.2 million liters of milk produced per year (Table 4). It has an average of 214 cows in 170 cow ha (Table 5). They had better productive indicators and results than HG-1, with higher stocking rates and more productive cows (1.26 cow/cow ha vs 1.18 cow/cow ha, and 421 kg milk solid/cow vs 285 kg milk solid/cow for HG-2 and HG-1, respectively). This type presented the same calculated cow efficiency as HG-3, with 0.79 kg milk solid/kg cows body weight (with higher productivity per cow but with heavier cows), had higher labor efficiency and the worst performance on the other indicators compared to HG-3 (Table 6). In 5 years, it reached 2.9% milk production CAGR (higher than HG-1 but lower than HG-3), with increasing quantities of cows and land and a small rate increase in cow productivity (Table 7). This evolution aligns with the growing systems identified by Fariña and Chilibroste5. These systems have only 61% of family farms (the smallest value between HG systems), women's participation was present in 57% of the farms, and 31% of the farmers received off-farm income (like HG-1). HG-2 had 59% of farms with bank liabilities, showing the relevance of this source of money to invest, involving the higher share of farms with cash flow records (54%), feeding margin (62%), and economics records (46%; see Table 8).
System HG-3 involved only 4% of total farms and produced 4% of the milk. They were smaller than HG-2 in terms of size and produced 635 thousand liters on average, with 118 cows in 56 cow ha (Table 4). The type has a stocking rate of 2.12 cow/cow ha or 1,067 kg cow body weight/cow ha, 79% higher than HG-1 and 59% higher than HG-2 (Table 5 and Table 6). This type had the best productive performance of the HG strategy, only overtaken by HG-2 in cow productivity and labor productivity (Table 6). For the other indicators, it presents significant differences. In 5 years, this system had the highest production CAGR, 6.8%, associated with an important increase in the number of cows (5.1%), raising cow productivity (1.8%), and decreasing land (-2.2%, Table 7), as was found by Fariña and Chilibroste5. This group involved the higher portion of family farms, 89%, with 61% of farms with family women working and a substantive share of farms with off-farm income, 51% (Table 7). On the other hand, we found that only 29% took cash records, 36% used feeding margins, and 35% had economics records (Table 7).
Table 5: Average resources
| System | HG-1 | HG-2 | HG-3 | HS-1 | HS-2 | HS-3 |
| Dairy cows | 122 c | 214 b | 118 a,c | 86 a | 205 b | 285 b |
| Cows body weight | 512 d | 537 b | 506 a,c,d | 502 a | 536 b | 522 b,c,d |
| Family labor (person 2.100 hour per year) | 2.30 a | 2.32 a | 2.13 a | 2.34 a | 2.62 b | 1.95 a |
| Total labor (person 2.100 hour per year) | 4.24 a | 5.61 c | 3.78 a | 3.82 a | 6.82 b | 6.89 b,c |
| Total land (ha) | 163 a,d | 257 c | 85 d | 184 a,b | 360 b | 291 a,b,c |
| Cows land (ha) | 110 a,d | 170 c | 56 d | 118 a | 252 b | 158 a,c |
| Replacement land (ha) | 40 a | 67 b,c | 19 a | 41 a | 88 b | 74 a,b |
| Other use land (ha) | 13 b,e | 20 b,c | 10 b,d | 24 a,b | 20 b | 59 a |
| Owned land (ha) | 75 a | 93 a,b | 38 a | 72 a | 124 b | 96 a,b |
| Hired land (ha) | 79 d,e | 155 c | 44 d | 96 a,d | 221 b | 193 a,b,c |
Note: differences appearing with different subscript letters in the same row are significantly different at p< 0,05 in the two-sided test of equality for column means. Tests are adjusted for all pairwise comparisons within a row of each innermost sub-table using the Bonferroni correction.
Table 6: Main average productive indicators
| System | HG-1 | HG-2 | HG-3 | HS-1 | HS-2 | HS-3 |
| Milk Solid (protein + fat) content (%) | 7.13 a | 7.17 a,b | 7.20 a,b | 7.15 a | 7.21 b | 7.29 b |
| Milk production (1.000 kg milk solid) | 36.2 d | 90.0 c | 46.3 a,d | 21.5 a | 90.4 c | 134.0 b |
| Land productivity (kg milk solid/cow ha) | 324 f | 521 d | 821 e | 178 a | 360 c | 937 b |
| Cow productivity (kg milk solid/ cow) | 285 e | 421 c | 394 d | 248 a | 443 b | 455 b |
| Labor productivity (kg milk solid/worker) | 8,595 e | 16,291 b,c | 11,649 d | 6,568 a | 15,213 c | 18,854 b |
| Concentrate efficiency (kg concentrate DMI/kg milk solid) | 2,87 c | 2,94 b,c | 2,78 b,c | 3,59 a | 3,19 b | 3,94a |
| Feed intake efficiency (kg milk solid/ton DMI) | 54,21 d | 69,19 c | 68,09 c | 49,24 a | 71,65 b | 73,87 b |
Note: differences appearing with different subscript letters in the same row are significantly different at p< 0,05 in the two-sided test of equality for column means. Tests are adjusted for all pairwise comparisons within a row of each innermost sub-table using the Bonferroni correction.
Table 7: Average CAGR between 2014 and 2019 (range considered between -20% and +20%), quantity of farms represented and portion of new farms
| System | HG-1 | HG-2 | HG-3 | HS-1 | HS-2 | HS-3 |
| Milk production (%) | 1.28 d | 2.90 b | 6.77 c | -1.77 a | 2.59 b,d | 2.35 b,d |
| Land (%) | 2.14 a | 1.86 a | -2.16 b | 3.25 a | 2.79 a | 0.43 a,b |
| Cows (%) | 3.01 c,d,e | 1.91 c | 5.04 d | 0.11 a,b | -0.74 b | 2.80 a,c,d |
| Cow productivity (%) | -1.43 a | 1.07 c | 1.78 b,c,d | -1.42 a | 3.49 b | -0.44 a,c |
| Farms represented | 479 | 288 | 66 | 427 | 342 | 39 |
| New farms started after 2014 (%) | 12 | 15 | 24 | 18 | 13 | 16 |
Note: differences appearing with different subscript letters in the same row are significantly different at p< 0,05 in the two-sided test of equality for column means. Tests are adjusted for all pairwise comparisons within a row of each innermost sub-table using the Bonferroni correction.
Table 8: Farm management characteristics frequencies
| System | HG-1 | HG-2 | HG-3 | HS-1 | HS-2 | HS-3 |
| Share of family farms | 80% | 61% | 89% | 86% | 57% | 53% |
| Have bank liabilities | 47% | 59% | 43% | 36% | 63% | 45% |
| With off-farm income | 31% | 31% | 51% | 26% | 24% | 15% |
| Take cashflow records | 30% | 54% | 29% | 30% | 52% | 53% |
| Have feeding margin records | 28% | 62% | 36% | 21% | 62% | 73% |
| Have economic records | 21% | 46% | 35% | 21% | 48% | 54% |
| With permanent agronomist advice | 48% | 72% | 50% | 44% | 78% | 77% |
| With permanent vet advice | 32% | 59% | 43% | 37% | 60% | 54% |
| With permanent accountant advice | 19% | 44% | 11% | 18% | 53% | 37% |
| With family women work participation | 62% | 57% | 61% | 64% | 54% | 35% |
3.1.2 High Supplement (HS) strategy
System HS-1 represented 28% of farms with 11% of milk production. It is the less intensive farm type within the HS strategy. The average milk production was 294 thousand liters SCM (Table 4), the smallest farm of the strategy with 86 cows in 118 cow ha, and the stocking rate is 0.75 (Table 3), 25% below the national average. All the performance indicators were the worst of the HS strategy. For example, cows' productivity was 60% of the value of HS-2, and labor productivity was less than half of this group's value. In addition, it was the only group that suffered a reduction in production CAGR in the last 5 years, with a rate of -1,8% CAGR based on the decrease in cow productivity, while increasing the land and maintaining the number of cows. Family farms accounted for 86% of all farms, 64% of farms had family women participating as workers, and 26% had off-farm income (Table 8). This system had a small portion of farms with cash records (30%), feeding margin and economic records (21% both; see Table 8). The type presented the worst performance indicators of all the types with the smallest stocking rate.
System HS-2 represented 20% of farms and 33% of milk. They share the main characteristics with HG-2, but the diet of the animals had a higher proportion of supplements. There were big farms with 2.3 million liters of SCM (Table 4) and 205 cows in 252 cow ha, which is the highest in terms of land (Table 5). The level of cow efficiency achieved by this system is the highest together with HS-3; cow efficiency is 0.83 kg milk solid/kg cow body weight, and per cow 443 kg milk solid. They managed a small stocking rate, 0.82 cow/cow ha, this value was 82% of the national average and 40% of HS-3 value (Table 3). Other key indicators were between HS-1 and HS-3 (Table 6). The evolution of the milk production of its farms in 5 years was 2.59% CAGR, supported mainly by increasing cow productivity (3.5%) and land expansion (2.8%). Only 57% of the farms involved in this group are family farms, 54% had family women working, and 24% had off-farm income (Table 8). This system has the highest portion of farms with bank liabilities (63%), and in terms of keeping records, half of the farms had cash, feeding margin and economics records (Table 8).
System HS-3 was the most intensive and the largest of this strategy. They represented only 2% of the farms and produced 6% of the total milk. The average production was 1.8 million liters of SCM (Table 4), with 285 cows in 158 cow ha. They had the best productive performance of the strategy based on the cow productivity and high stocking rate (Table 6). Labor productivity was 24% better than HG-2 (Table 6). The growth strategy achieved 2.3% production CAGR based on the number of cows increased (2.8%; Table 7). This group presented 51% of family farms, with the smallest share of farms with family women's participation in work (35%) and off-farm income (15%; Table 8). At the same time, they had the highest share of farms with cash records (53%), feeding margin (73%) and economics records (54%), presented in Table 8.
3.2 Economic performance for season 2018/19
To describe the economic context, we chose an indicator developed by INALE to monitor the relationship between milk prices and cost prices, known as Milk Purchasing Power (MPP)19. The indicator is the rate between the Milk Price Index and the Cost Milk Index (basket of 78 inputs and services)19. For the season 2018/19, the average value of the MPP was 71, 9.0% below 2017/18 and 2016/17 (78), and 11.8% higher than 2015/16 (64)20. The index value improved in the next seasons achieving the maximum (80) in 2021/22 and 2022/23, surpassed only by season 2014/15 (84)20. That shows a context of tight margin for the analyzed season.
Every year, INALE estimates the average milk price and unitary cost per liter based on the Dairy Survey 2014. For season 2018/19 milk price value was USD 0.30 per liter and the cost value (including opportunity cost of land and labor) was USD 0.27 per liter21. We analyzed the evolution of the rate between average milk cost per liter and average milk price from 2013/14, which was estimated at 0.75 (in one of the best times of the dairy sector), then it increased to the highest rate with 1.1 in 2015/16, improved to 0.89 in 2017/18, and then increased again to 0.94 in 2018/1921. This evolution in recent years became less favorable at the farm economics level, showing one of the worst contexts in the analyzed season.
In this context, for season 2018/19, there are types with negative and positive economic results associated with the intensification level inside each feed strategy (Table 9).
In general terms, the HG feed strategy's unitary cost (cost including unitary opportunity costs) presents better results associated with values smaller than HS, considering the same level of intensification as it seems HG-1 vs HS-1, HG-2 vs HG-2. In the case of HG-3, the weight of family farm work is higher (increasing opportunity cost) than HS-3 (Figure 2 ).
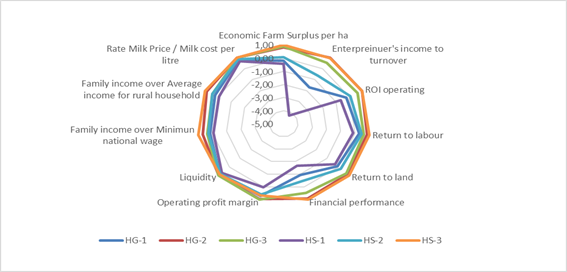
To illustrate the sustainability results, we determined the ratio between the best value for the indicators and the result for each type, presented in Figure 3. The types with the best results were HS-3, HG-3 and HG-2.
Table 9: Economics, competitiveness, and sustainability indicators for season 2018/19
| System | HG-1 | HG-2 | HG-3 | HS-1 | HS-2 | HS-3 |
| EFS per ha (USD/ha) | -53 | 228 | 247 | -125 | 19 | 277 |
| Entrepreneur's income to turnover (%) | -14.8 | 8.6 | 4.6 | -36.7 | -5.4 | 8.1 |
| ROI operating (%) | -1.3 | 6.1 | 4.0 | -4.0% | 0.6 | 6.2 |
| Return to labor (USD/100 hour) | 297 | 862 | 607 | -112 | 448 | 1,005 |
| Return to land (USD/ha) | -20 | 274 | 244 | -90 | 80 | 316 |
| Dairy investment per cow (USD/cow) | 1,416 | 1,349 | 1,733 | 1,719 | 1,875 | 1,501 |
| Liquidity | 1.3 | 1.4 | 1.5 | 1,0 | 1.2 | 1.3 |
| Operating profit margin (%) | 20.5 | 28.2 | 29.0 | 0.5 | 17.1 | 20.3 |
| Family income over Minimum national wage rate | 1.6 | 6.7 | 3.5 | -0.5 | 2.9 | 9.9 |
| Family income over average rural household income rate | 1.2 | 4.7 | 2.4 | -0.3 | 2.4 | 5.3 |
| Off-farm income to Farm receipt (%) | 2.2 | 0.9 | 3.2 | 3.9 | 0.8 | 0.3 |
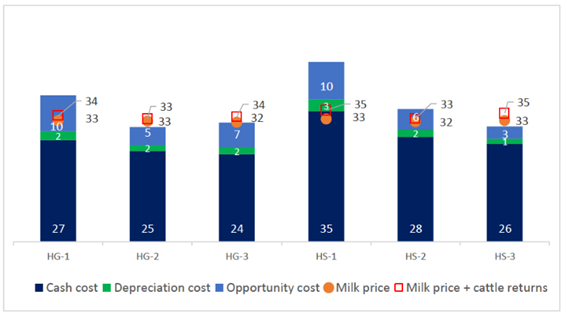
Figure 2: Milk price, Milk price plus cattle returns, Cash cost, Depreciation cost, and Opportunity cost for season 2018/19 (based on Hemme15)
4. Discussion
The discussion will focus on the economic performance based on farm management and productive results of each farm types during season 2018/19. We identified three groups in terms of performance.
4.1 Systems with the best economic performance
The systems included were HS-3, HG-3, and HG-2. Their results show the best performance: economic sustainability, financial, resource efficiency, and competitiveness. They had an EFS higher than USD 225 per ha, a positive Entrepreneur's profit to turnover (5% or more) with the highest profitability (ROI operating, 4% or more), and a competitive Milk cost (USD/L) between USD 0.29 and 0.31 per liter SCM (Table 9 and Figure 2). They represent 25% of farmers and 39% of milk. In these types, the best results in terms of profitability per ha are the consequence of high solid productivity per cow and an increased level of grass consumed, as was mentioned by Hanrahan and others6, in comparison with the other types.
The HS-3 type, with an EFS of USD 277 per ha, had the best results on season 2018/19. It was the most intensive system based on supplementation; their cows' diet included 39% DMI from grass with 4,500 kg DMI/cow ha of grass, but presented the highest share of supplement DMI. The type presented the largest average land size (cows, land and production). Furthermore, they achieved the highest land productivity, based on a high stocking rate, and cow productivity (2.1 cow/cow ha and 455 kg milk solid/cow). This type had a Family income per capita 10 times over the minimum national wage and each family member received 5 times the rural household income. The off-farm work was irrelevant (Table 9). HS-3 type represented the largest profitable farms focused on supplementation, had half of HG-3 grass kg DMI/cow ha, and they doubled the supplements kg DMI/ cow ha. This type had the highest share of farms with records (cash, feeding margin, and economic) and had higher permanent technical advice (agronomist, veterinarian, and accountant) than HG-2 and HS-2. This type had a small portion of family farms involved and they were the largest farms with the highest share of farms with records, and permanent advice for enterprise management22 and to support decision-making processes.
The HG-3 type obtained an EFS of USD 247 per ha supported by a high stocking rate and cow productivity and the highest grass intake (grass portion of 61% DMI, 8,400 kg DMI/cow ha) in farms with the smallest land size. This type represented an efficient pastoral system based on adequate stocking rate, high levels of grazing management, and rigorous cost control, which was found as a profitable strategy by Hanrahan and others6. They had the same stocking rate as HS-3 but a smaller cow productivity (2,1 cow/cow ha and 394 kg milk solid/cow). The main difference between groups appeared in the family income indicator, which was determined by the farms' size. HG-3 had nearly 4 times the minimum wage per family worker, reflecting the capacity to invest in enterprise needs, and doubled the household income per family member (Table 9). The HG-3 type represented the smallest size (production) profitable grass-focused farms and they achieved the highest levels of grass intake. Surprisingly, this type presented a small portion of farms with records. Maybe it was supported by the small scale that allowed it to have a good control level without formal records. They presented a small portion of permanent advice, especially accountants (11%), half of the farms had agronomists, and 43% vets, in comparison with HS-3 and HG-2. This characteristic was highly associated with the high proportion of family farms of this type22.
For the HG-2 type, the EFS achieved USD 228 per ha, with a good level of liquidity of 1.4 (Table 9). The type achieved these results based on high cow productivity and the same grass intake as HS-3 (4,600 kg DMI/cow ha, representing 62% grass in cow’s diet) and consuming the same roughage per cow ha as HG-3, having 60% of the stocking rate of the other two systems (1.3 cow/cow ha), they achieved a low cost (USD 0.25 cash expenses + depreciation and USD 0.05 opportunity cost per liter SCM). The family income per family worker was 7 times the minimum national wage and near 5 times the rural household income per family member. HG-2 represented large profitable farms focused on grass intake, they presented the best land efficiency associated with cow productivity over the national average and higher stocking rate (one-third more than HS-2). This characteristic was associated with the big farmland size and the need for information for decision-making. These indicators highlight the relevance of information to support the decision-making process in this kind of farm. The economic results illustrate the best performance of HG-2 in comparison with HS-2, supporting the idea that higher grass and the need to increase grass intake to achieve better results by feeding the cows with the cheapest feed is the path toward more sustainable systems.
The performance in the economic dimension, resource efficiency, and resilience is presented in Figure 3. In general, HS-3, HG-3, and HG-2 presented the best performance. Analyzing social sustainability HG-3 and HG-2 presented a gap compared with HS-3, associated with the farm size (HG-3).
4.2 Systems with the worst economic performance
HS-1 represents small farms with the worst results -even negative, threatening their sustainability-, and represents 28% of farms and 11% of total milk. The main indicators to represent their situation were EFS of USD -125 per ha, ROI operating -4.0%, and liquidity of 1.0 (representing cash expenses like cash receipt; Table 9). The negative level of EFS and ROI operating means that the system cannot cover non-effective costs (depreciation and opportunity costs for labor, land, or capital). In season 2018/19 HS-1 achieved a price of USD 0.33 that did not cover the cash cost plus depreciation cost of USD 0.35 (cash cost was paid but depreciation could not be covered), and opportunity costs of USD 0.10 per liter determined a total milk cost of USD 0.45 per liter SCM (Figure 2). The negative result per liter was a consequence of the smallest productivity obtained (per land, cows, resources) to cover fixed cost. The indicator was highly related to the smallest operating margin and the worst liquidity. Family income for family workers over minimum wage and Family per capita income over average rural household income were negative. It is the system with more participation of off-farm income over farm receipt (Table 9). In terms of keeping records, this type had a small portion of farms that kept them. It may be associated with the small portion of farms with permanent agronomist, vet, and accountant advice (Table 8), as it was identified by Pérez and García22 in the case of family farms. All these things put a red light on the economic and productive performance of more than a quarter of total dairy farms, mainly family farms, because of the worst performance in every dimension evaluated (Figure 3).
4.3 Systems with intermediate economic performance
The other two systems, HS-2 and HG-1, were included in this group; they represented 47% of farms and 50% of milk production. These types presented negative results when the price relationships were not too favorable as was seen for the season 2018/19.
In the case of type HS-2, with a grass intake of 2,600 kg DMI/cow ha (52% share of grass), they achieved an EFS of USD 19 per ha, achieving an entrepreneur's profit to turnover of -5.4% with a liquidity of 1.2. They received USD 0.32 per liter and the cost was USD 0.32 per liter (Figure 2). In this situation, the milk price could cover all the costs without margin. HS-2 represented large farms with stocking rates below the national average and high levels of supplement intake. They had the smallest stocking rate, which directly determines the small intake of grass, and achieved one of the highest cow productivity (like HS-3). The Family income per family worker was 2.9 times the minimum wage because of the farmland size, and each family member received 2.4 times the average household income per capita. HS-2 had a high portion of keeping-record farms (like HG-2), large farms with less than 60% of family farms, and high levels of permanent advisory, as it was expected in this type of farms22.
HG-1 had a grass intake of 4,100 kg DMI/cow ha (68% of grass in cow’s diet), it received negative EFS (USD -53 per ha) and entrepreneur's profit to turnover (-14.8%), with good liquidity (1.3), that showed the issue in covering cost was related to opportunity cost and not to cash expenses. Looking at unitary Cost (cash + depreciation), it was USD 0.27 and USD 0.10 opportunity cost, which was higher than the other group because of the low productivity to cover fixed cost, especially the opportunity cost of own labor. The Family income was 1.6 times the minimum wage per family worker, 1.2 times the rural household income per capita, and the off-farm income represented 2.2% of total farm receipt (Table 9). The main issue of HG-1 was associated with the small cow productivity and the levels of grass intake that could be improved. Compared with HS-2, HG-1 showed better performance indicators based on a higher stocking rate and grass intake. Despite the better productive results of HG-1, their economic performance was poor. The type had 80% of the family farms with low record-keeping levels, and advisory22.
In 1998, four types of milk delivery farms in terms of management of their farms were identified by Piñeiro and others23. HS-1 was similar to “Disintegrating farmers” with low cow production, with the prevalence of farmers that did not use records, in a decumulation process, and small-size farms23. In that typology HG-1 shared some similarities with “Agribusiness wage-laborers”, related to the small size, economic equilibrium, and low levels of keeping records23. Types HG-2 and HS-3 shared several characteristics with “Diversified entrepreneurs”: large farms with records to support the decision-making process23. The other types were not directly represented in the 1998 classification.
Durán4 identified five systems in the pathway of intensification, some of which had similarities with the types found in this research. Type HS-2 shared some indicators with PDS Advanced, identified 15 years ago. It presented a stocking rate near 0.80 cow/cow ha, land productivity near 4,900 L/cow ha, cow productivity of 6,100 L/C, and concentrate DMI near 1,300 kg DMI/cow ha4. Another type recognized was HS-1 like PDS Organized, with similar land productivity (2,325 L/cow ha), but HS-1 presented a 30% higher stocking rate (0.75 vs 0.53 cow/cow ha) with a smaller cow productivity (HS-1: 3,400 vs 4,500 L/cow)4. The other types had a higher stocking rate and land productivity, showing the intensification process that has happened in the last 15 years.
To summarize, systems with higher stocking rates of more than 1.26 cows per cow ha (or more than 670 kg of cow per ha) had the best indicators in terms of competitiveness (lower milk cost), and economics (EFS/ha, ROI operating and entrepreneur income to turnover). This supports the idea that the key to improving competitiveness is grass management. Looking for higher amounts of forage per hectare (grazing and roughage) intake24, having strategies to increase its diet's contribution25, and maximizing grass intake result in economic sustainability 5)(25) . Types HG-1 and HS-2 could raise the stocking rate looking to increase direct forage intake and require a higher supplementation to maintain cow productivity, as mentioned by Ortega and others24. At the same time, maintaining high levels of grass management and cost control are the keys to having an efficient pasture-based dairy farm5. We saw that these farms generally keep records to support decision-making processes. Uruguayan dairy farm systems could improve on-farm forage-produced intake by increasing the stocking rate without losing competitiveness3. This was observed in the most intensified systems studied. Meanwhile, the system with lower levels of intensification and productivity (HS-1) had the worst situation in terms of social sustainability, with negative levels of per capita family income in comparison with the income in rural areas, and also negative family income per family worker in comparison with the minimum wage.
5. Conclusions
There seems to be a strong linkage between the stocking rate and the economic performance. The types based on high levels of grass intake and strategic supplementation per hectare with higher stocking rates (more than 1.26 cow/cow ha, HS-3, HG-3 and HG-2) achieved the best economic results based on small milk cost per liter and higher levels of grass intake. They represented 25% of farms. On the other hand, the type with the worst economic performance was the extensive group involved in the HS strategy (with small portions of grass in cows’ diet, HS-1). This system represented 28% of farms showing negative results in every dimension evaluated, especially in economic terms. This type of farms needs support to improve grass production and intake, use strategic supplementation to increase cow productivity, and increase the stocking rate. At the same time, they need financial and permanent technical advice support to improve their situation. In an intermediate situation in terms of economic performance, 47% of the farms have a huge opportunity to grow by increasing the stocking rate to lift the levels of grass intake.

