


 Inglés (pdf)
 Articulo en XML
 Referencias del artículo

 Permalink
1. Introduction
Milk production in Uruguay increased twofold from 1991 to 2013, but was stagnant in the following decade1. Countries with similar dairy production systems, predominantly pasture-based, such as Australia, New Zealand and Argentina, also experienced similar stagnation2.
Causes of dairy production stagnation are multifactorial and differ among countries. In New Zealand, environmental regulations imposed to avoid water pollution and greenhouse gas emissions restricted increased milk production3. Dairy farming in Australia had persistent biophysical growth limitations due to the high frequency of droughts, as well as business competition from other agricultural activities4. Growth in Argentina was limited by the country´s fragile economy and lack of credit5. Environmental regulations imposed in Uruguay in the last decade did not seem to restrict dairy production growth. In addition, as Uruguay had one of the most stable economies in South America, credit was readily available to most farms. But it is unclear if biophysical aspects limited the farm area growth (expansion) and/or productivity (intensification) in the last decade.
The objective of this study was to analyze the development dynamic of the Uruguayan dairy farm in the last decade by integrating country, experimental and commercial databases.
2. Materials and methods
2.1 Research approach
The research strategy adopted was a sequence of analyses combining various databases for the study period (1991-2022). Initially, national agricultural statistics1 were used to describe global development of milk production, farms and herds, and to compare them among countries (Argentina, Australia, Ireland, New Zealand, Western Europe), using the FAOSTATS database 20232. To assess local status in terms of production system research, all dairy farm system studies in Uruguay from 1991 to 2022 were compiled to allow analysis of their biophysical performance. In this data set, each research farm system was selected to study each pasture-based system with the highest land productivity, assuming each of them to be a reference of productivity potential at that time. Finally, a commercial dairy farm database was utilized to group farms according to inter-annual changes in productivity throughout 2015 to 2022.
2.2 Statistical analysis of farms database
The database of the local cooperative program “Programa de Producción Competitiva” (PPC) of CONAPROLE was utilized to analyze the effects of production increases in commercial farms on overall productivity and economic performance. The PPC comprised the fiscal year 2021/2022 with 762 farms producing 824 million L of milk, with 111,600 milking cows and 120,700 ha for adult cows. This database covers a wide range of farming systems and the collected information allowed a description and analysis of their feeding strategies and changes over time.
Farmers supplied monthly reports on their number of milking and dry cows, the amount and price of feed supplements, calving of adult and primiparous cows, the area of the milking platform and the effective grazing area where pasture was actively growing. This information was linked with information provided by PPC, including the amount and composition of milk from each farm and the price per L of milk. Physical performance and margin over feed cost for each farm was calculated based on these inputs as gross milk revenue minus total feed costs (including purchased feeds, sowing and maintenance costs of home-grown forage and feeding costs of all diets). To analyze dairy business changes over time, the database was segmented into four groups according to productivity (L/ha/year) growth rate (PGR) during the fiscal years 2015/2016 to 2021/2022 as follows: negative productivity growth rate (NPGR; PGR < 0% per year), low productivity growth rate (LPGR; 0 ≤ PGR < 3%), medium productivity growth rate (MPGR; 3 ≤ PGR ≤ 6%), and high productivity growth rate (HPGR; PGR ≥ 6%). Productivity growth rate (PGR) was calculated as:
PGR= (P2122/P1516)1/6 - 1
where: P2122 = productivity fiscal year 2021/22; P1516 = productivity fiscal year 2015/2016. Only the farms that provided information for fiscal years (2015/2016-2022/2021; n = 293 farms) were considered in the analysis. A correlation analysis between PGR and initial (fiscal year 2015/16) productivity, total production, farm size and milking cows per farm was completed. A mixed model in PROCMIXED of SAS was used with fiscal year as a continuous variable, PGR group as categorical data, and their interaction to evaluate slope heterogeneity. Farm was included in the model as a random effect and initial productivity (L/ha/year; productivity in fiscal year 2015/2016) as a covariable. An autoregressive variance of order 1 was used as a covariance structure based on IAC criteria. Means were declared different when Tukey’s test was in p < 0.05.
3. Results
3.1 Dairy industry evolution
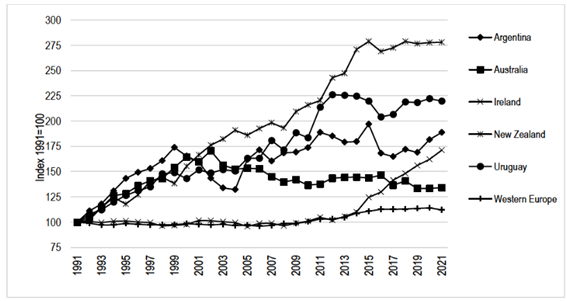
New Zealand was the pasture-based country where the dairy industry had the highest growth in milk production within the 30-year-period from 1991 to 2021, followed by Uruguay (Figure 1). Both countries had a similar pattern of continuous growth in the first two decades, reaching a maximum in the last decade (New Zealand in 2015 and Uruguay in 2012), with no further growth during the next 6 and 9 years, respectively. Argentina had the highest growth in the first decade, peaking in 2015, followed by a steep decline and partial recovery in the following years. The next country in terms of relative growth was Ireland; although it did not grow in the first two decades due to milk quota restrictions in place in Europe until 2015, their partial phaseout allowed Ireland to attain a rate of growth higher than any of the countries examined (37% between 2015 and 2021). Australia had grown during the initial decade, with a 76% increase by 2002. From that time, milk production in Australia gradually decreased to stabilize in the last decade at levels within the range of the 1990s. Western Europe (i.e., Germany, France, Belgium, Netherlands, Switzerland, Austria, Luxemburg), in Figure 1, is a combined region to illustrate growth limitations related to milk quota restrictions until 2014, but also to illustrate that the region only had a 1% increase.
The dairy industry in Uruguay changed dramatically in the last three decades. The number of farms declined by 49%, from 6,516 to 3,320 (Figure 2 ). Land area used to support milk production also shrank, by 29%, from 1,064,000 to 757,000 hectares, whereas the total number of adult milking cows increased by 15%, from 357,000 to 421,000. Thus, national milk production increases (Figure 1 ) were mainly driven by increased milk production efficiency, leading to growth of 223% in productivity from the total area (from 82 to 341 kg MS/ha.year).
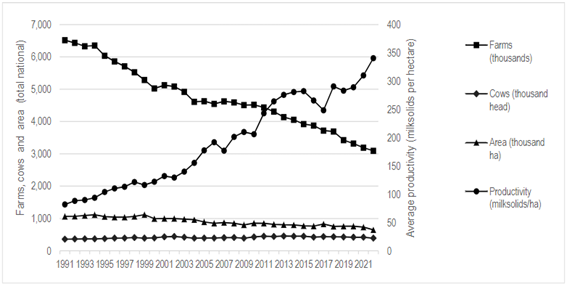
Figure 2: Three decades of changes in the Uruguayan dairy sector in terms of number of farms, herd size, dairy area, and productivity1
3.2 Research farm system studies
Productivity increases at farm level, shown by research farm system for productivity per hectare and its components within the study period, are presented in Table 1. The first two alternatives in Table 1 represent systems that increased the use of feed concentrates from the 1980s baseline. The ‘Controlled’ system doubled its initial level of concentrate (from 600 to 1,200 kg/cow/year) to reach a 40% increase in stocking rate (from 0.70 to 1.29 cows/ha), whereas the ‘Advanced’ increased concentrate use per cow 30% further (reaching a 35% increase in individual cow milk production). The ‘Advanced No-Till’ maintained the same productivity but incorporated no-till technology for pasture-crop rotation, a practice introduced in the 1990s. The following decade, a system with similar productivity was evaluated based only on pasture (AP), thereby excluding winter and summer annual pastures or crops, although with ~50% concentrate in the cows’ diet. The next step in the 2000s was a system also based on an all-pasture system, but importing maize silage from off-block (‘AP+Corn Silage’), which allowed an increase to 1.8 cows/ha and a 30% increase in land productivity. In the 2010s a system including a 60-day early lactation confinement to boost milk per cow (‘AP+CornSilage+Comfort’) was modeled and tested field level6.
The pasture-based system studies from 2015 (Table 1) did not create further increases in productivity. The Centro Regional Sur (CRS) farmlets study evaluated various stocking rates, aiming to capture a large proportion of grazed pasture per hectare in order to reduce production costs. The system with 2 cows/ha reached 6.5 tonnes DM/ha grazed plus 2.4 tonnes DM/ha reserves. Similarly, the 10-Thousand project evaluated different farmlet systems aimed at harvesting 10 tonnes DM/ha of home-grown forage with various feeding strategies and cow genotypes. The GrassMax option with New Zealand Holsteins reached the highest productivity and 9.7 tonnes of DM/ha.year (grazed + conserved forage). Another set of studies combined grazing with different confinement options (EEMAC, 2018-2020), reaching higher individual milk yields than their predecessors but overall similar productivity. An ongoing farmlet study is evaluating a system designed to reduce the cost of production and management simplicity based on an all-pasture milking platform and silage bales as the only fodder supplement (CRS Low Cost).
Table 1: Biophysical performance of 10 farm systems evaluated in research farm studies in Uruguay from 1992 to 2020
| Year | Stocking rate | Milk per cow | Milk per ha | Milk solids per ha | Source | |
| (first evaluated) | (cows/ha) | (KL/cow.year) | (KL/ha.year) | (kg/ha year) | ||
| Controlled | 1992 | 1.3 | 4.79 | 6.18 | 451 | Durán and others21 |
| Advanced | 1994 | 1.4 | 6.49 | 9.08 | 663 | Durán and others21 |
| Advanced No Till | 1996 | 1.4 | 6.53 | 9.14 | 667 | Durán20 |
| All Pasture (AP) | 2004 | 1.4 | 6.34 | 8.88 | 648 | Durán and others21 |
| AP+Corn Silage | 2008 | 1.8 | 6.43 | 11.57 | 845 | Durán and others21 |
| AP+Corn Silage+ Comfort | 2012 | 2.3 | 7.95 | 18.28 | 1334 | La Manna and others6 |
| CRS 2.0 | 2015 | 1.7 | 6.5 | 11.09 | 880 | Ortega and others11 |
| 10-Thousand GrassMax | 2017 | 2.10 | 7.05 | 14.80 | 1217 | Stirling and others12 |
| EEMAC Hybrid | 2019 | 1.9 | 8.05 | 15.30 | 1062 | Méndez and others10 |
| CRS Low Cost | 2020 | 1.8 | 7.85 | 13.99 | 1112 | conversation with P. Chilibroste, unreferenced |
*For the calculation of productivity, the milk solids percentage of 1992 to 2012 was assumed to be constant (7.3%). Solids = fat+protein
3.3 Commercial farms database
Productivity GR was correlated with actual productivity at the beginning of the period (fiscal year 2015/2016; Pearson r = -0.305; p<0.001; n=293 farms) while indicators of farm size, such as number of milking cows and total milk production per farm, were not correlated with PGR. Based on these results, initial productivity was included in the model as a covariable. Mean values of selected variables and the effect of PGR group, fiscal year and their interaction are presented in Table 2.
Farms that were able to increase productivity during the last 6 fiscal years (medium and high PGR) had higher mean productivity, pasture DMI and margin over feed cost vs. less dynamic systems (negative and low PGR: Table 2). Negative and high PGR had the lowest and highest values, respectively, for all other variables except pasture area, milk price and feeding cost, that did not differ among PGR groups. The negative PGR group declined in productivity (-3.15 %/year) but had a positive rate (+0.17% year) for total milk production. The low PGR group also had a higher total milk production GR than PGR (Table 2), while in the more dynamic (medium and high) PGR groups these rates were similar. Nevertheless, for both productivity and production GR, all groups differed. Although mean values are informative, underlying dynamics during the period help clarify productive strategies followed by each PGR group. In Figure 3, the PGR groups are compared within fiscal year for total production, productivity and components (individual cow production and stocking rate), and margin over feed cost.
Table 2: Mean value during the period 2015/16 - 2021/22 of selected variables according to the productivity growth rate group
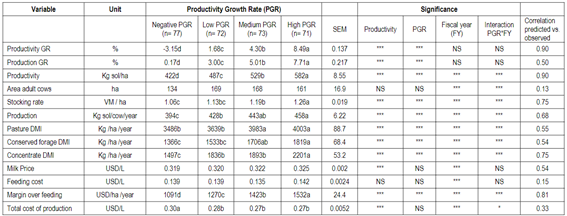
Sol = solids (fat + protein); ha = hectare; PGR = productivity growth rate; NS = non-significative; *** = p<0.01
The high PGR group increased over 250 kg of milk solids per hectare during the 6 fiscal years, while the negative PGR group decreased by 100 kg. The medium PGR group ended with the same productivity as the high PGR group, although it had started with higher levels (plot a, Figure 3). The low PGR group started with similar levels of productivity vs. medium PGR, but finished with 100 kg less solids per ha. The three positive PGR groups ended with similar production (~1.4 million L year), although starting from different levels (plot b, Figure 3). The negative PGR group remained relatively stable in amount of milk produced (Table 3; Figure 3). Stocking rate and productivity had the same trend (plot c, Figure 3). High and medium PGR groups ended with similar stocking rates (~1.3 VM ha), but started different, while the negative PGR group had a decreased stocking rate. This group increased area (145 vs. 119 hectares for 2021/22 and 2015/16, respectively), but did not increase dairy cows in the same proportion (142 vs. 138 dairy cows), explaining why the negative PGR group had a positive increase in total milk GR (Table 3). Within the negative PGR group, 41 of 77 farms decreased productivity and total production, while 21 of 77 farms increased total production at an annual rate of 8.1%. For this last subgroup, the increase in area (+97%) was larger than the increase in cows (+51%), which resulted in a negative PGR but a positive GR in total milk production. At the other extreme, in the high PGR group 59 of 77 farms had a high increase in productivity and total milk production with a +35% increase in number of cows and only +3.1% increase in area. Individual milk production increased in the three positive PGR groups (low, medium, high), reaching 460-470 kg solids per cow per year at the end of the period, while the negative PGR group only maintained individual cow milk production. Larger changes in productivity (64 and 27% for high and medium PGR, respectively) were likely primarily due to changes in stocking rate (+20-30%) and changes in individual milk production (+10-20%; Figure 3). The feeding strategies that supported these growth levels are shown in Figure 4.
As with other variables, the negative PGR group decreased intensity of forage (pasture + reserve) use during the study (Figure 4). It is noticeable that all positive PGR groups increased use of forage per hectare, with the largest increases in the higher PGR group. Concentrate use also increased (2, 14 and 48% for low, medium and high PGR, respectively). The three positive PGR groups ended with similar levels of concentrate use per hectare (2,117 ± 84.1 kg MS ha), although from different initial values (Figure 4). Margin over feed cost (Figure 4; plot e) in all groups reflected variation in milk price during the study. However, the high PGR group had the lowest margin at the beginning but ended with the highest, equal to that of the medium PGR group. The reverse is true for the negative PGR group that started at higher margins and ended with the lowest. The negative PGR group split from the other groups in fiscal year 2019/2020 and this gap increased in the following year. It seems that high and medium PGR groups were better at capturing benefits of higher milk prices (plot e, Figure 4).
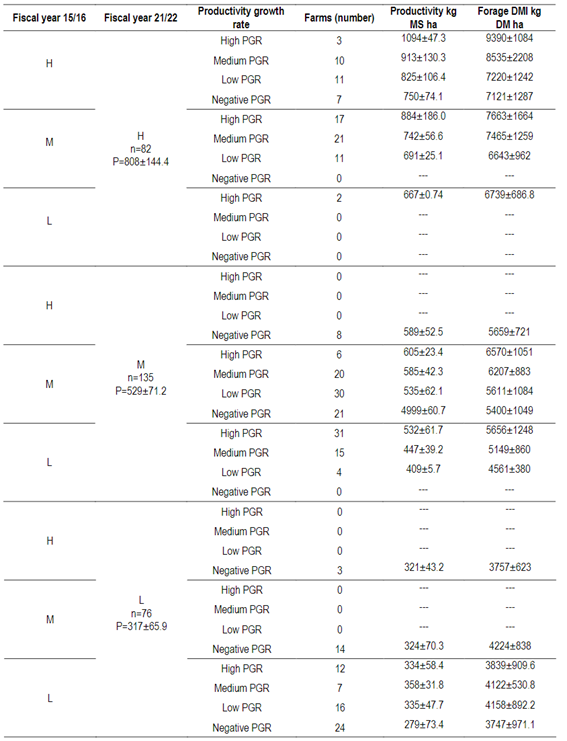
Another analysis in Table 3 used beginning (2015/2016) and end (2021/2022) data to group farms into low (L, <= 450 kg MS/ ha), medium (M, > 450 and <= 650 kg MS/ ha) and high (H, >650 kg MS/ ha) productivity. Table 3 shows changes of farms based on initial and final productivity groups (L, M and H) and growth dynamics during the study: negative, low, medium and high PGR. At the end of the study there were 82 farms in the H group, up from 31 in 2015/2016, with 49 coming from the M group and only 2 from the L group. In contrast, the M group in 2021/2022 (135 farms) is constituted mainly by farms that were in the M and L productivity groups in 2015/2016 (77 and 50 farms for M and L, respectively). The L group in 2021/2002 (76 farms) is mainly of farms that were in this group in 2015/2016.
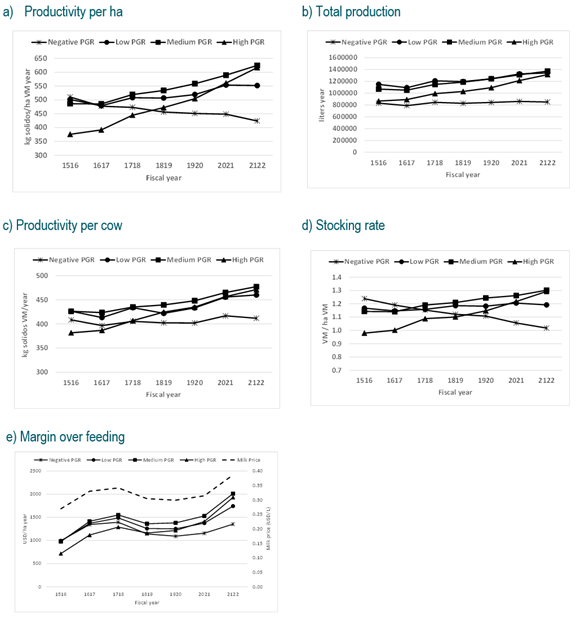
Figure 3: Variation in productivity per cow and per hectare, total milk production, stocking rate and margin over feeding across fiscal years for Negative, Low, Medium and High productivity growth rate groups (PGR)
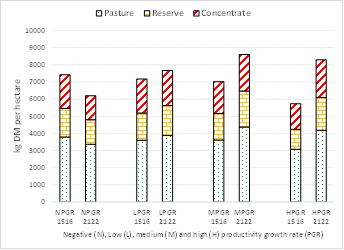
Figure 4: Initial (1516) and final (2122) kilograms DM of pasture, reserve and feed concentrate per hectare for Negative (N), Low (L), Medium (M) and High (H) productivity growth rate (PGR) groups
4. Discussion
Despite the lack of substantial growth of national milk production and productivity in Uruguay during the last decade, it is evident that there was high variability among dairy farms and production systems. Indeed, there are farms that decreased productivity (-3.15% year) while others grew up to +8.5% per year. Seemingly, tactical factors have driven decisions by individual dairy farmers to arrive to such different outcomes under the same dominant economic and weather scenarios.
The more dynamic groups (medium and high PGR) increased stocking rate and individual milk production concomitant with increases in herbage and conserved forage DMI. This is consistent with trends described by Fariña and Chilibroste7 for Uruguay, Hanrahan and others8 for Ireland, and Clark and others9 for New Zealand. However, these groups reached on average a productivity, stocking rate and home-grown forage DMI (pasture + conserved forage) that represented 52%, 65% and 65%, respectively, of the average yields of the most recent farmlet studies 10)(11) 12.
Neither feeding cost nor milk price differed among PGR groups in our study. Performance of the high PGR group is remarkable since most variables started from lower levels than in other groups (Figure 4). It is possible that the “law of diminishing returns” was operating and a series of better management practices were “activated” in the initial years, resulting in a rapid and steep increase in individual milk production and herbage and conserved forage DMI. Such a strategy was supported by early adjustment in the stocking rate, which might have been the cause of the initial lower values of herbage and conserved forage DMI7. Forage consumption per hectare is strongly associated with farm business profit in Uruguay7, Ireland8 and New Zealand9. From fiscal year 2018/19 onwards, the high PGR group appears to have obtained the resources required to capitalize on high milk prices. The medium PGR group had good levels of growth of productivity and total production (Table 3). These systems adjusted stocking rate (+14%) and production per cow (+25%) since land used changed little. It is noteworthy that feeding strategy was based more on increasing herbage and reserves DMI (+25%) than concentrate DMI (+15%).
The negative PGR group also followed the main trends described by Fariña and Chilibroste7, although they started (fiscal year 2015/16) with above average physical indicators, such as productivity and its components. One subgroup within this group (21 of 77 farms) grew in hectares although they were not able to grow the same proportion in cows, thus losing overall farm productivity despite the increase in total milk production (+8% per year). It seems that they first increased hectares and later increased the number of cows, suggesting that they were able to change the trend and start a period of productivity growth. Reasons for this de-coupling of land and cows are unknown, but debt level and/or access to financing could have been a factor13. Another subgroup within the negative PGR group (41 of 77 farms) declined in all variables (fewer cows, less production per cow, less total production) with no sign of recovery. All the parameter averages analyzed in the negative PGR group indicated lower competitiveness7, although this is largely explained by the impact of this last sub-group. According to IFCN 202214, every year 427 thousand farms exit the dairy business worldwide with lack of competitiveness being one of the major drivers.
Will the more dynamic (high and medium) PGR groups keep growing? Based on the research systems described in Table 1, there seems to be room to do so within this model through higher stocking rate, higher milk production per cow and higher overall efficiency. A small proportion of farms in the population (82 of 293) produced more than 650 kg MS/ha by the end of the study (808±144 kg MS ha), which is 66 to 90% of the levels attained by the most productive pasture-based farm systems evaluated 11)(12) . However, 50% of these 82 farms were already over 650 kg MS/ha at the beginning of the study (743±90.6 kg MS ha). Indeed, there were only 9% (13/144) of farms growing at medium or high PGR that started and finished with high levels of productivity (Table 3). This suggests that for Uruguayan farmers to increase productivity beyond 650 kg of MS/ha will present more difficulties than their previous period of productivity growth from lower levels, and this will probably be affected by each farmer´s skill and risk-aversion.
It is noteworthy that the study period was impacted by a low milk price, high farm production cost and low buying power of milk15. With the milk price in the range of 0.30 USD per liter, or below, the annual margin over feeding was below 1,500 USD per hectare, which likely allowed limited business growth13. In contrast, with higher prices per liter, the absolute values of margin over feeding were larger than 1,500 USD per hectare and group differences were amplified. Our research at farm level (PPC) shows that the difference in economic performance among systems was amplified in good economic years and shrank in bad years.
Our study appears to have occurred under a different feeding pattern from that in Fariña and Chilibroste7. Whereas previously a rise in concentrate feeding levels per cow and per ha seemed to have driven productivity increases, in the most recent decade the increase in home-grown forage consumption (grazed plus conserved) appeared to have had a larger impact on productivity increases. In this way, for farms growing in productivity, the increase in home-grown forage consumption between 2015/16 and 2021/22 was 7.3, 3.8 and 2.9 times greater than the increase in concentrate intake per ha for the low, medium and high PGR, respectively (Figure 4). In contrast, home-grown forage consumption potential, shown by recent farm system research 11)(12) , seems to be setting a ceiling productivity growth with current commercial farm dryland strategies. It is expected that under commercial conditions the productivity ceiling and associated home-grown forage consumption would be below research farm system performance due to inefficiencies of scale and management 16)(17) . In addition, our commercial farm database shows that the upper 10% of farms (29 of 293) in terms of home-grown forage DMI averaged 7.4 tonnes DM/ha year, and only 2% of them (5 of 293) reached levels above 9 tonnes DM/ha. This is consistent with our findings that the PGR group with the highest improvement in productivity had started from low levels of home-grown forage consumption (4.7 tonnes DM/ha; Figure 4), and seemingly took advantage of its large yield gap. Thus, strategies to increase production through area expansion may be a business growth option for farmers within pasture-based farming systems that have reached their ceiling yield of home-grown forage. However, such area expansion should not be at the expense of productivity losses in the medium to long term in order to avoid detrimental effects on profitability. In addition, it has been shown that mixed pasture-based systems produce less greenhouse gas emissions than more extensive grazing systems18, and are more able to control nutrient losses19.
5. Conclusions
Production systems that increased productivity relied on increased stocking rate and individual milk production based on more home-grown forage consumption, rather than on more supplementary feed. This strategy operates linearly until ~650 kg of milk solids/ha since there was higher PGR in farms with M and L levels at the beginning of the study. There was a negative correlation between productivity at the beginning (fiscal year 2015/2016) and PGR. Attaining dairy industry growth rate values in the future similar to those of previous decades will likely require strategies that promote an increase in the area devoted to milk production.

